. 2020 Jul;103(2):903-917.
doi: 10.1111/tpj.14747. Epub 2020 Apr 21.

Rapid identification of an Arabidopsis NLR gene as a candidate conferring susceptibility to Sclerotinia sclerotiorum using time-resolved automated phenotyping

Affiliations

Rapid identification of an Arabidopsis NLR gene as a candidate conferring susceptibility to Sclerotinia sclerotiorum using time-resolved automated phenotyping

Adelin Barbacci et al. Plant J. 2020 Jul.

Abstract

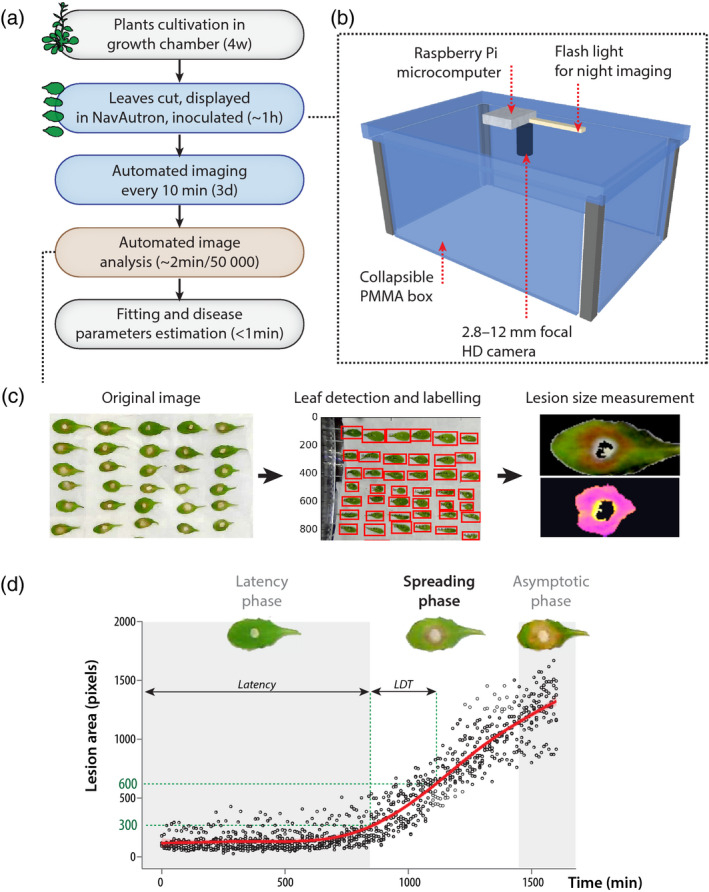
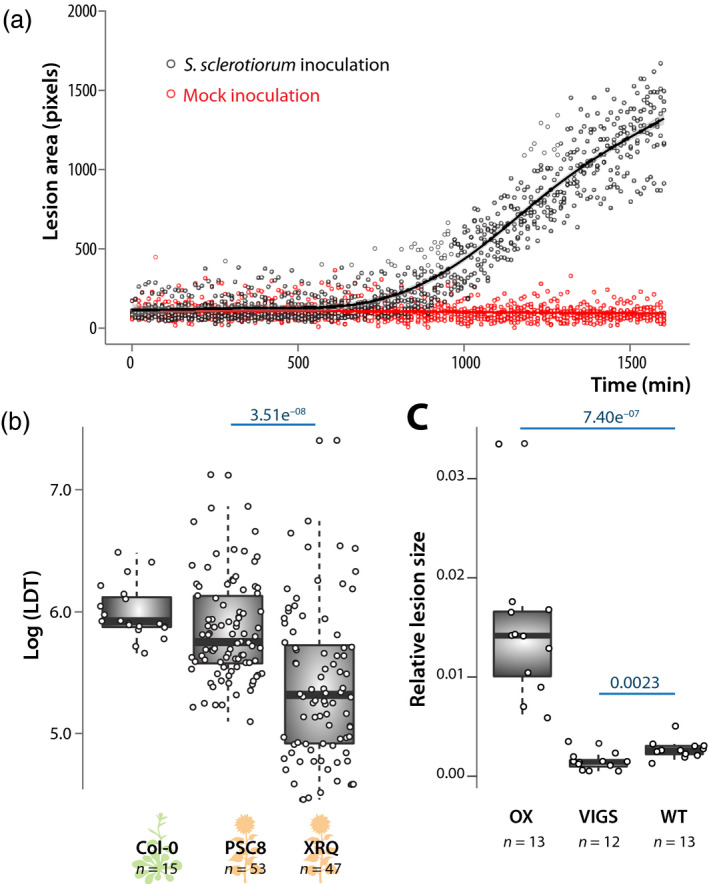
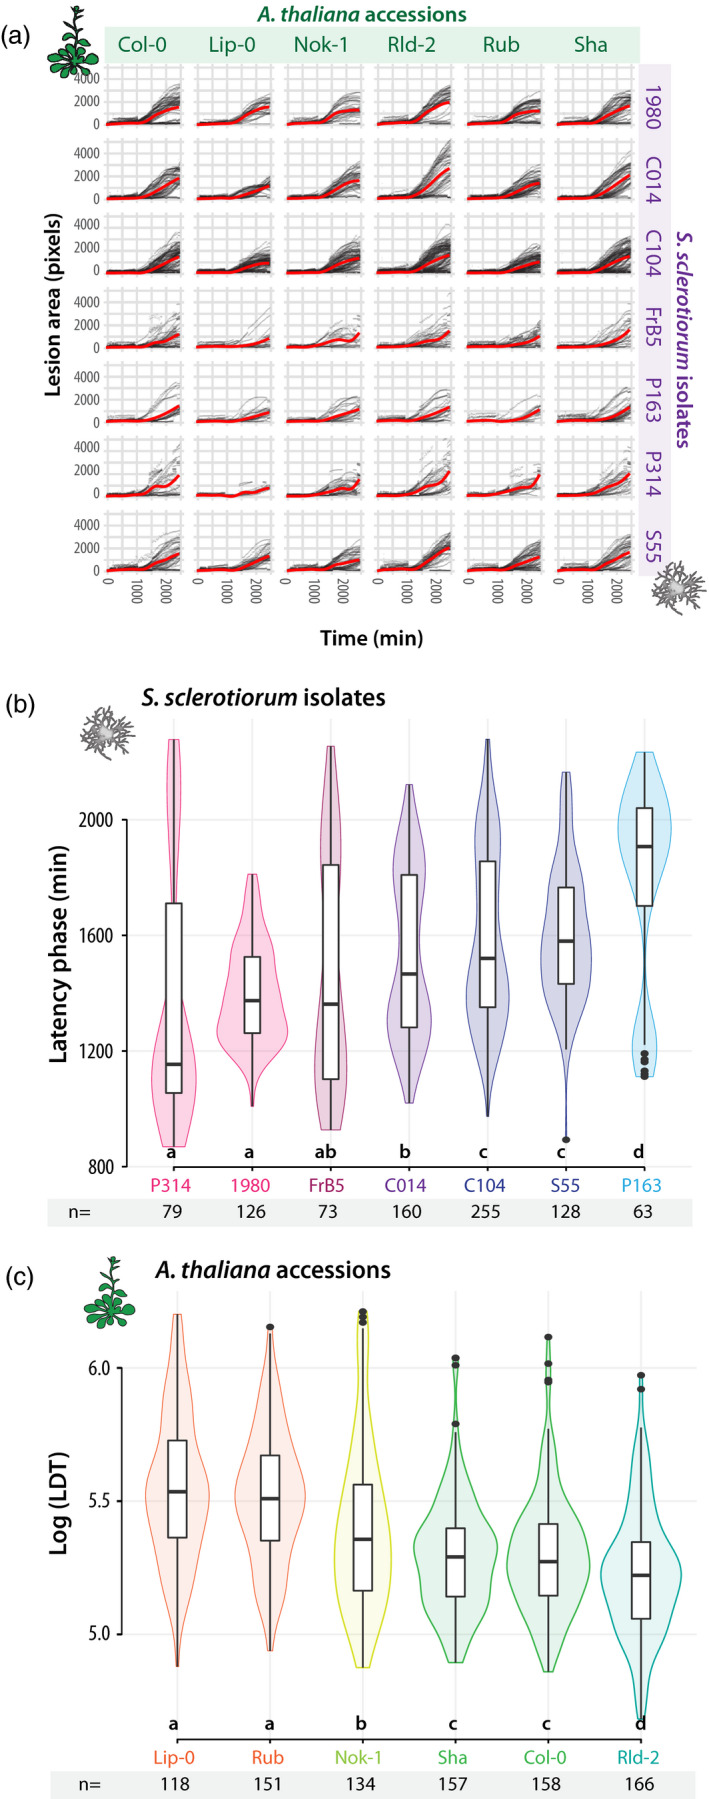
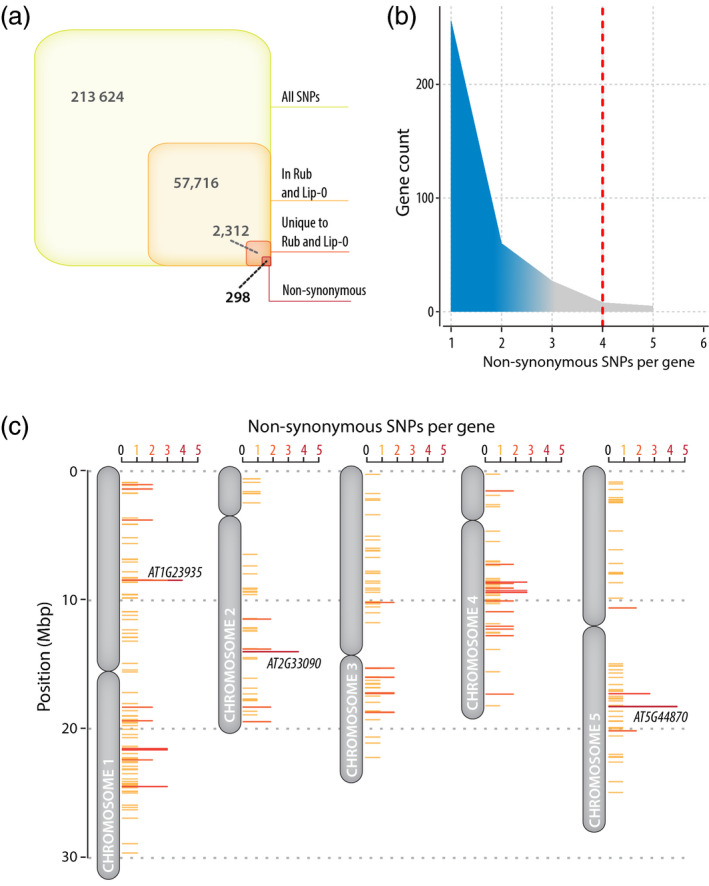
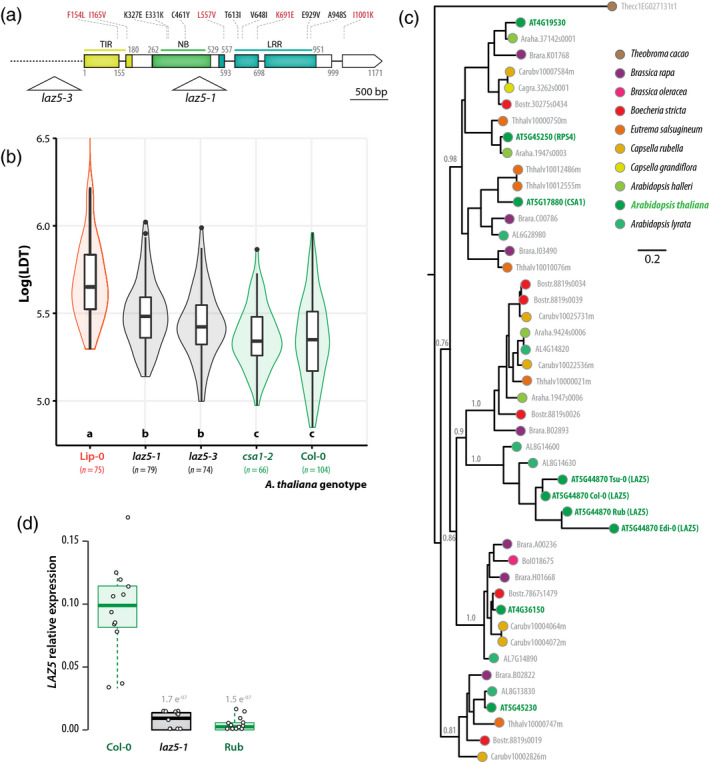
The broad host range necrotrophic fungus Sclerotinia sclerotiorum is a devastating pathogen of many oil and vegetable crops. Plant genes conferring complete resistance against S. sclerotiorum have not been reported. Instead, plant populations challenged by S. sclerotiorum exhibit a continuum of partial resistance designated as quantitative disease resistance (QDR). Because of their complex interplay and their small phenotypic effect, the functional characterization of QDR genes remains limited. How broad host range necrotrophic fungi manipulate plant programmed cell death is for instance largely unknown. Here, we designed a time-resolved automated disease phenotyping pipeline enabling high-throughput disease lesion measurement with high resolution, low footprint at low cost. We could accurately recover contrasted disease responses in several pathosystems using this system. We used our phenotyping pipeline to assess the kinetics of disease symptoms caused by seven S. sclerotiorum isolates on six A. thaliana natural accessions with unprecedented resolution. Large effect polymorphisms common to the most resistant A. thaliana accessions identified highly divergent alleles of the nucleotide-binding site leucine-rich repeat gene LAZ5 in the resistant accessions Rubezhnoe and Lip-0. We show that impaired LAZ5 expression in laz5.1 mutant lines and in A. thaliana Rub natural accession correlate with enhanced QDR to S. sclerotiorum. These findings illustrate the value of time-resolved image-based phenotyping for unravelling the genetic bases of complex traits such as QDR. Our results suggest that S. sclerotiorum manipulates plant sphingolipid pathways guarded by LAZ5 to trigger programmed cell death and cause disease.

Keywords: Sclerotinia sclerotiorum; NBS-LRR; fungal pathogen; plant phenotyping; quantitative disease resistance; technical advance.


Conflict of interest statement

The authors declare that they have no competing interests to disclose.

Figures

Figure 1
Figure 1
Analysis of quantitative disease resistance (QDR) against Sclerotinia sclerotiorum with the Navautron system. (a) Pipeline describing the experiments reported in this manuscript. Detached leaves were analyzed with the Navautron through automated imaging, automated image analysis, curve fitting, and QDR parameters estimation. Approximate duration for each step is indicated (d, days; w, weeks). (b) The Navautron setup: Each Navautron consists of a transparent plastic box (poly(methyl‐methacrylate), PMMA) equipped with a Raspberry Pi microcomputer, a high‐definition (HD) camera and a LED flash light. (c) The three major steps of the automated image analysis. (d) Typical kinetics of S. sclerotiorum disease lesion development on A. thaliana, illustrating the latency phase, spreading phase, and asymptotic phase. Characteristic values are the duration of latency phase and the lesion doubling time (LDT). Data shown correspond to values collected on five leaves of A. thaliana Col‐0, the red curve shows fitted average.
Figure 2
Figure 2
Assessment of sensitivity and versatility of the Navautron system for quantifying plant disease symptoms. (a) Kinetics of disease lesion development of leaves inoculated by S. sclerotiorum (black) and mock inoculated (sterile agar plug, red). Data shown correspond to values collected on five leaves of A. thaliana Col‐0, lines show fitted average. (b) Lesion doubling time (LDT) measured on leaves of A. thaliana Col‐0 accession and sunflower PSC8 and XRQ genotypes after inoculation by Sclerotinia sclerotiorum. LDT was measured on n = 15 to 53 mature leaves per genotype in three independent biological replicates. Statistical difference between LDT on the two sunflower genotypes was assessed by Student’s t‐test with P‐value indicated in blue. (c) Relative size of necrotic lesions measured on leaves of Nicotiana benthamiana plants overexpressing the REM1.3 remorin protein (OX), silenced for rem1.3 by virus‐induced gene silencing (VIGS), and wild‐type (WT), after inoculation by Phytophthora infestans. Measurements were performed on 12 or 13 infection sites per genotype. Statistical difference between LDT was assessed using a Wilcoxon’s test with P‐value indicated in blue. Boxplots show 1st and 3rd quartiles (box), median (thick line) and the most dispersed values within 1.5 times the interquartile range (whiskers).
Figure 3
Figure 3
Characteristic values describing disease symptom dynamics in the interaction between seven Sclerotinia sclerotiorum isolates and six A. thaliana accessions. (a) Kinetics of disease lesion development for 42 different combinations of A. thaliana natural accessions (columns) and S. sclerotiorum isolates (lines). Red curves show smooth fitting curves for 1500 to 12 250 measurements. (b) The duration of latency phase (Y‐axis) was mostly dependent on S. sclerotiorum isolates (x‐axis), ranked from the most (P314) to the least virulent (P163). Duration of the latency phase was measured n = 63 to 255 times for each isolate. (c) The lesion doubling time (LDT, y‐axis) was mostly dependent on A. thaliana accessions (y‐axis), ranked from the most (Lip‐0) to the least resistant (Rld‐2). LDT was measured n = 118 to 158 times on each accession. Letters and colours indicate groups of significance determined by post hoc pairwise t‐tests. Boxplots show 1st and 3rd quartiles (box), median (thick line) and the most dispersed values within 1.5 times the interquartile range (whiskers).
Figure 4
Figure 4
Distribution of single nucleotide polymorphisms (SNPs) in selected A. thaliana accessions and identification of candidate disease‐relevant genes. (a) Distribution of SNPs genotyped by (Atwell et al., 2010) through our pipeline for finding candidate disease‐relevant genes. There were 2312 SNPs common to Lip‐0 and Rub but not present in Nok‐1, Rld‐2, and Sha, among which 298 were non‐synonymous SNPs. (b) Number of non‐synonymous SNP per gene in the list of 298 SNPs identified in (a). We report on the three genes including at least four non‐synonymous SNPs in Lip‐0 and Rub but no SNP in Nok‐1, Rld‐2, and Sha (red dotted line). (c) Map of A. thaliana chromosomes showing genes with non‐synonymous SNPs in Lip‐0 and Rub but no SNP in Nok‐1, Rld‐2, and Sha. Genes discussed in the text are labelled on the figure.
Figure 5
Figure 5
Disruption of the NLR gene LAZ5 reduces lesion doubling time upon Sclerotinia sclerotiorum challenge. (a) Schematic map of the LAZ5 gene showing the position of T‐DNA insertion in the laz5‐1 and laz5‐3 mutant lines (triangles). Exons are shown as boxes, introns as plain lines, upstream non‐coding region as a dotted line. Domains encoded by exons are colour coded and labelled TIR, NB, and LRR. Positions are given as amino acid numbers. Non‐synonymous mutations known in Lip‐0 allele are indicated above boxes, in red when present in (Atwell et al., 2010), in black otherwise. (b) Lesion doubling time (LDT, Y‐axis) in the most resistant accession Lip‐0, two laz5 mutant lines, the csa1‐2 mutant, and Col‐0 wild‐type. LDT was measured n = 74 to 104 times on each accession. Letters and colours indicate groups of significance determined by post hoc pairwise t‐tests. (c) Phylogenetic relationship of LAZ5 and its 42 closest homologues in the phytozome 12.1 database. LAZ5 closest homologue outside of the Brassicaceae family (Theobroma cacao 1EG027131) was included as outgroup, and alleles from A. thaliana Edi‐0, Rub, and Tsu‐0 natural accessions to represent infraspecific diversity. The tree obtained by a maximum likelihood analysis is shown, with the number of substitution per site used as branch length, and branch support determined by an approximate likelihood‐ratio test (grey labels). Terminal nodes are colour coded according to plant species. (d) Relative expression of the LAZ5 gene determined by quantitative RT‐PCR in healthy plants. Values shown correspond to three independent biological samples analyzed through four technical repeats each. Statistical difference from expression in Col‐0 plants was assessed with Student’s t‐tests. Boxplots show 1st and 3rd quartiles (box), median (thick line) and the most dispersed values within 1.5 times the interquartile range (whiskers).

References

    1. Araus, J.L. and Cairns, J.E. (2014) Field high‐throughput phenotyping: the new crop breeding frontier. Trends Plant Sci. 19, 52–61. - PubMed
    1. Atwell, S. , Huang, Y.S. , Vilhjálmsson, B.J. et al . (2010) Genome‐wide association study of 107 phenotypes in Arabidopsis thaliana inbred lines. Nature, 465, 627–631. - PMC - PubMed
    1. Badet, T. , Peyraud, R. and Raffaele, S. (2015) Common protein sequence signatures associate with sclerotinia borealis lifestyle and secretion in fungal pathogens of the sclerotiniaceae . Front. Plant Sci. 6, 776 10.3389/fpls.2015.00776ISSN=1664-462X - DOI - PMC - PubMed
    1. Badet, T. , Peyraud, R. , Mbengue, M. , Navaud, O. , Derbyshire, M. , Oliver, R.P. , Barbacci, A. and Raffaele, S. (2017a) Codon optimization underpins generalist parasitism in fungi. Elife, 6, e22472. - PMC - PubMed
    1. Badet, T. , Voisin, D. , Mbengue, M. , Barascud, M. , Sucher, J. , Sadon, P. , Balagué, C. , Roby, D. and Raffaele, S. (2017b) Parallel evolution of the POQR prolyl oligo peptidase gene conferring plant quantitative disease resistance. PLoS Genet. 13, e1007143. - PMC - PubMed

Publication types

MeSH terms

Supplementary concepts