. 2020 Mar;25(6):1-13.
doi: 10.1117/1.JBO.25.6.063810.

Multispectral singlet oxygen and photosensitizer luminescence dosimeter for continuous photodynamic therapy dose assessment during treatment

Affiliations

Multispectral singlet oxygen and photosensitizer luminescence dosimeter for continuous photodynamic therapy dose assessment during treatment

Tobias J Moritz et al. J Biomed Opt. 2020 Mar.

Abstract

Significance: Photodynamic therapy (PDT) involves complex light-drug-pathophysiology interactions that can be affected by multiple parameters and often leads to large variations in treatment outcome from patient to patient. Direct PDT dosimetry technologies have been sought to optimize the control variables (e.g., light dose, drug administration, tissue oxygenation, and patient conditioning) for best patient outcomes. In comparison, singlet oxygen (O21) dosimetry has been tested in various forms to provide an accurate and perhaps comprehensive prediction of the treatment efficacy.

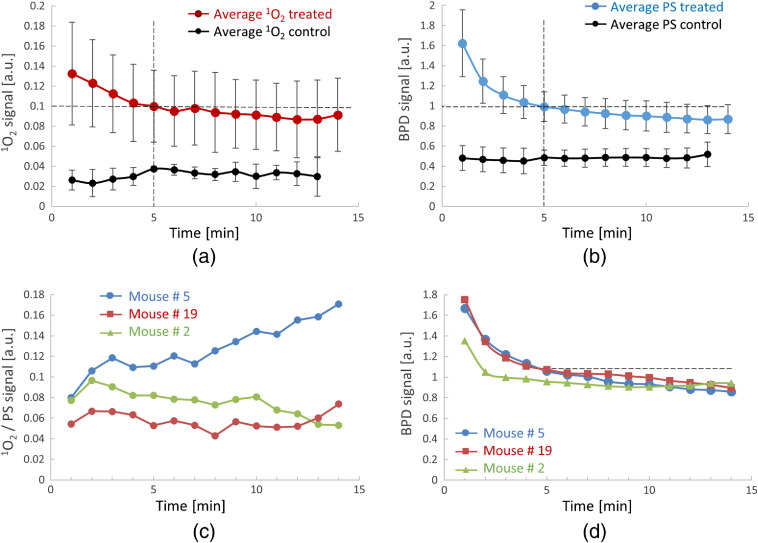
Aim: We discuss an advanced version of this approach provided by a noninvasive, continuous wave dosimeter that can measure near-infrared spectrally resolved luminescence of both photosensitizer (PS) and O21 generated during PDT cancer treatment.

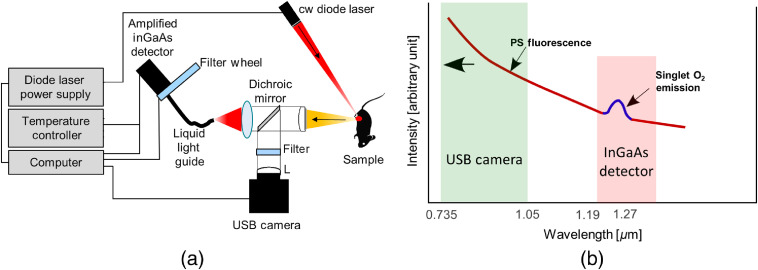
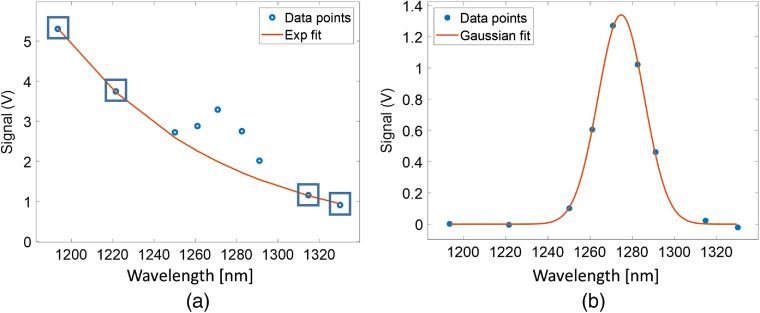
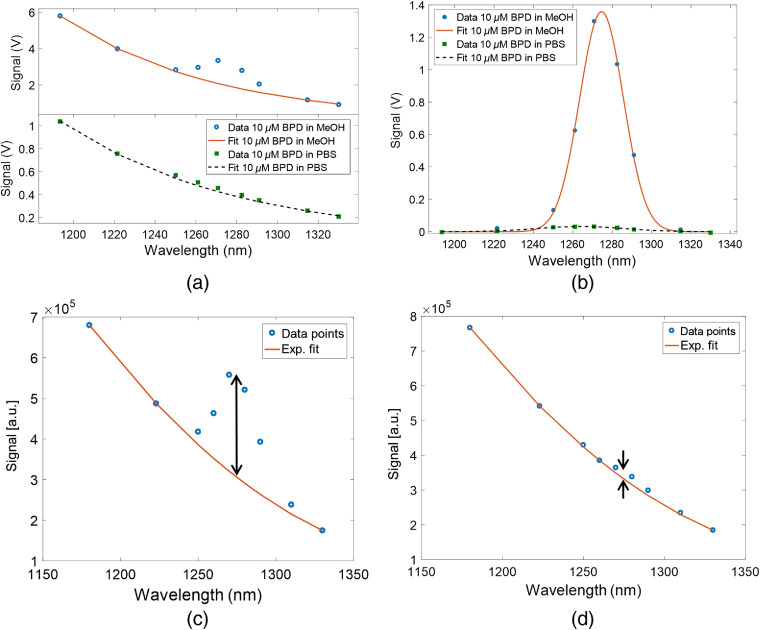
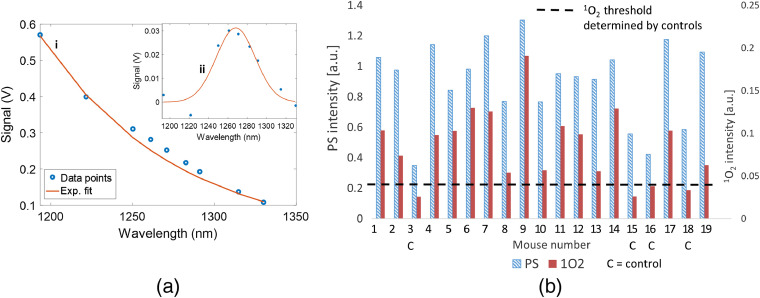
Approach: This dosimetry technology uses an amplified, high quantum efficiency InGaAs detector with spectroscopic decomposition during the light treatment to continuously extract the maximum signal of O21 phosphorescence while suppressing the strong PS luminescence background by spectrally fitting the data points across nine narrow band wavelengths. O21 and PS luminescence signals were measured in vivo in FaDu xenograft tumors grown in mice during PDT treatment using Verteporfin as the PS and a continuous laser treatment at 690 nm wavelength.

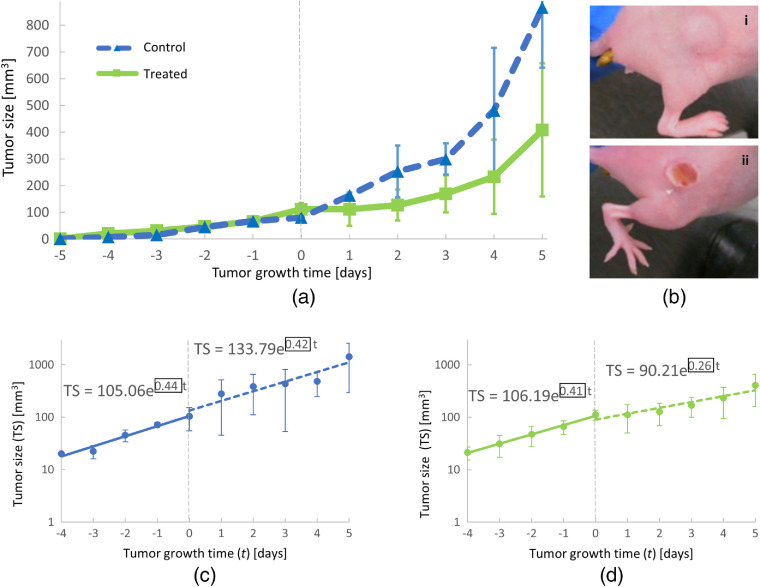
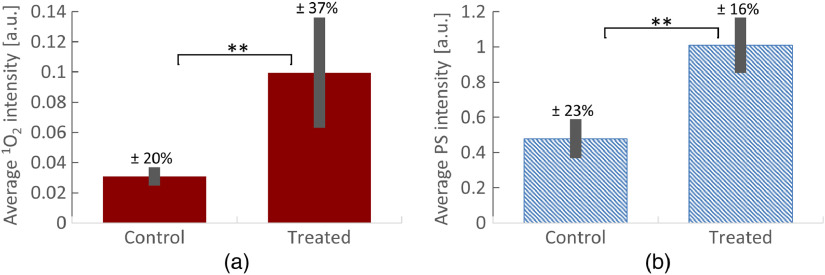
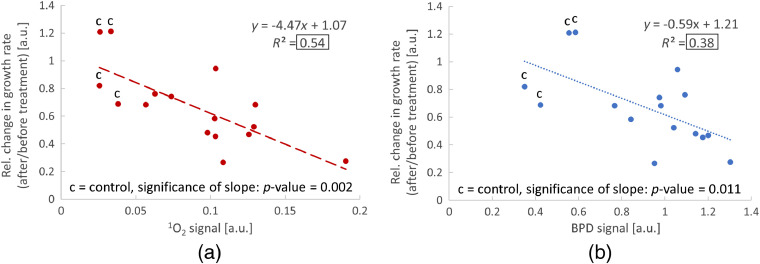
Results: A cohort of 19 mice was used and observations indicate that the tumor growth rate inhibition showed a stronger correlation with O21 than with just the PS signal.

Conclusions: These results suggest that O21 measurement may be a more direct dosimeter of PDT damage, and it has potential value as a definitive diagnostic for PDT treatment, especially with spectral separation of the background luminescence and online estimation of the PS concentration.

Keywords: dose; photodynamic therapy; singlet oxygen; spectroscopy; tumor regrowth.


Figures

Fig. 1
Fig. 1
Experimental setup: (a) schematic of the prototype instrument and (b) conceptual diagram illustrating PS and O21 luminescence spectra and the two wavelength regions detected by separate detection channels.
Fig. 2
Fig. 2
Method to extract singlet oxygen signal: (a) determination of PS (benzoporphyrin derivative, BPD) luminescence background based on exponential fitting (red curve) to the four out of band spectral data points indicated by the blue squares. (b) Gaussian fitting (red curve) to the PS fluroescence background subracted data points (blue dots), which depicts the extracted singlet oxygen (O21) signal.
Fig. 3
Fig. 3
Measurements in PS solutions: (a) raw spectra collected from 10  μM BPD in methanol (top) and PBS (bottom) solutions. (b) Singlet oxygen signal from 10  μM BPD in methanol and PBS solution. (c) Combined BPD luminescence spectra (red line, exponential fit and blue circles, measured data points) from 10  μM BPD in methanol, before nitrogen bubbling. Amplitude of singlet oxygen signal (black double arrow). (d) Combined BPD luminescence spectra (red line, exponential fit and blue circles, measured data points) from 10  μM BPD in methanol, afer 6 min nitrogen bubbling. Amplitude of singlet oxygen signal (black double arrow).
Fig. 4
Fig. 4
Inhibition of tumor growth following PDT treatment of mice: (a) average tumor growth curves for control (blue) and treated (green) mice observed before (time < day 0) and after (time > day 0) PDT treatment. The standard deviations for the measurements are indicated by error bars. (b) Example photographs of (i) control and (ii) treated tumors 3 days after PDT. (c) Comparison of average tumor growth rates (black boxes) before (solid, blue trend line) and after (dashed, blue trend line) light exposure for control mice. (d) Comparison of average tumor growth rates (black boxes) before (solid, green trend line) and after (dashed, green trend line) PDT treatment for treated mice.
Fig. 5
Fig. 5
Quantitation of generated O21 during PDT treatment of mice: (a) example (mouse #1) of the convoluted PS+O21 spectrum (i) recorded during PDT treatment. The inset (ii) shows the extracted O21 signal fitted with a Gaussian curve. (b) Measured singlet oxygen (brown) and PS (blue shaded) signals during PDT treatment of 19 mice. Dotted black line indicates O21 threshold measured in control mice, which are indicated with a “c” under the x-axis.
Fig. 6
Fig. 6
Comparison of generated O21 and PS luminescence during PDT treatment of mice: (a) average measured O21 signal for (left) control and (right) treated mice. Signals are significantly different with p-value<0.005. The O21 signal for control and treated mice has a variability of ±20% and ±37%, respectively. (b) Average measured PS signal for (left) control and (right) treated mice. Signals are significantly different with p-value<0.005. The PS signal for control and treated mice has a variability of ±23% and ±16%, respectively.
Fig. 7
Fig. 7
Time trends of generated O21 during PDT treatment of mice: (a) measured average singlet oxygen signal during PDT treatment of of 19 mice (brown). The measured average singlet oxygen signals for control mice are shown in black. The standard deviations of the measurements are indicated by error bars. (b) Measured average PS signal during PDT treatment of mice (n=19) (blue) and control mice (black). The standard deviations of the measurements are indicated by error bars. (c) Example time trends (mouse # 5, 19, 2) of O21 signal during PDT treatment. (d) Example time trends (mouse # 5, 19, 2) of PS (BPD) signal during PDT treatment. Dotted lines show the trends.
Fig. 8
Fig. 8
Correlation of PDT treatment efficiency to the generated singlet oxygen and PS: (a) correlation of relative change in tumor growth rate (ratio of growth rates after/before PDT treatment) to measured singlet oxygen amount for all mice. (b) Correlation of relative change in tumor growth rate to measured PS amount for all mice (n=19). In both plots, “c” indicates control mice.

References

    1. Dougherty T. J., et al. , “Photodynamic therapy,” J. Natl. Cancer Inst. 90(12), 889–905 (1998).JNCIEQ10.1093/jnci/90.12.889 - DOI - PMC - PubMed
    1. Ochsner M., “Photophysical and photobiological processes in the photodynamic therapy of tumours,” J. Photochem. Photobiol. B: Biol. 39(1), 1–18 (1997).JPPBEG10.1016/S1011-1344(96)07428-3 - DOI - PubMed
    1. Dolmans D. E., Fukumura D., Jain R. K., “Photodynamic therapy for cancer,” Nat. Rev. Cancer 3(5), 380–387 (2003).NRCAC410.1038/nrc1071 - DOI - PubMed
    1. Wilson B. C., “Photodynamic therapy for cancer: principles,” Can. J. Gastroenterol. 16(6), 393–396 (2002).10.1155/2002/743109 - DOI - PubMed
    1. Vrouenraets M. B., et al. , “Basic principles, applications in oncology and improved selectivity of photodynamic therapy,” Anticancer Res. 23(1b), 505–522 (2003).ANTRD4 - PubMed

Publication types