

Natural variability in seizure frequency: Implications for trials and placebo
- PMID: 32172145
- PMCID: PMC7194486
- DOI: 10.1016/j.eplepsyres.2020.106306
Natural variability in seizure frequency: Implications for trials and placebo
Abstract
Background: Changes in patient-reported seizure frequencies are the gold standard used to test efficacy of new treatments in randomized controlled trials (RCTs). Recent analyses of patient seizure diary data suggest that the placebo response may be attributable to natural fluctuations in seizure frequency, though the evidence is incomplete. Here we develop a data-driven statistical model and assess the impact of the model on interpretation of placebo response.
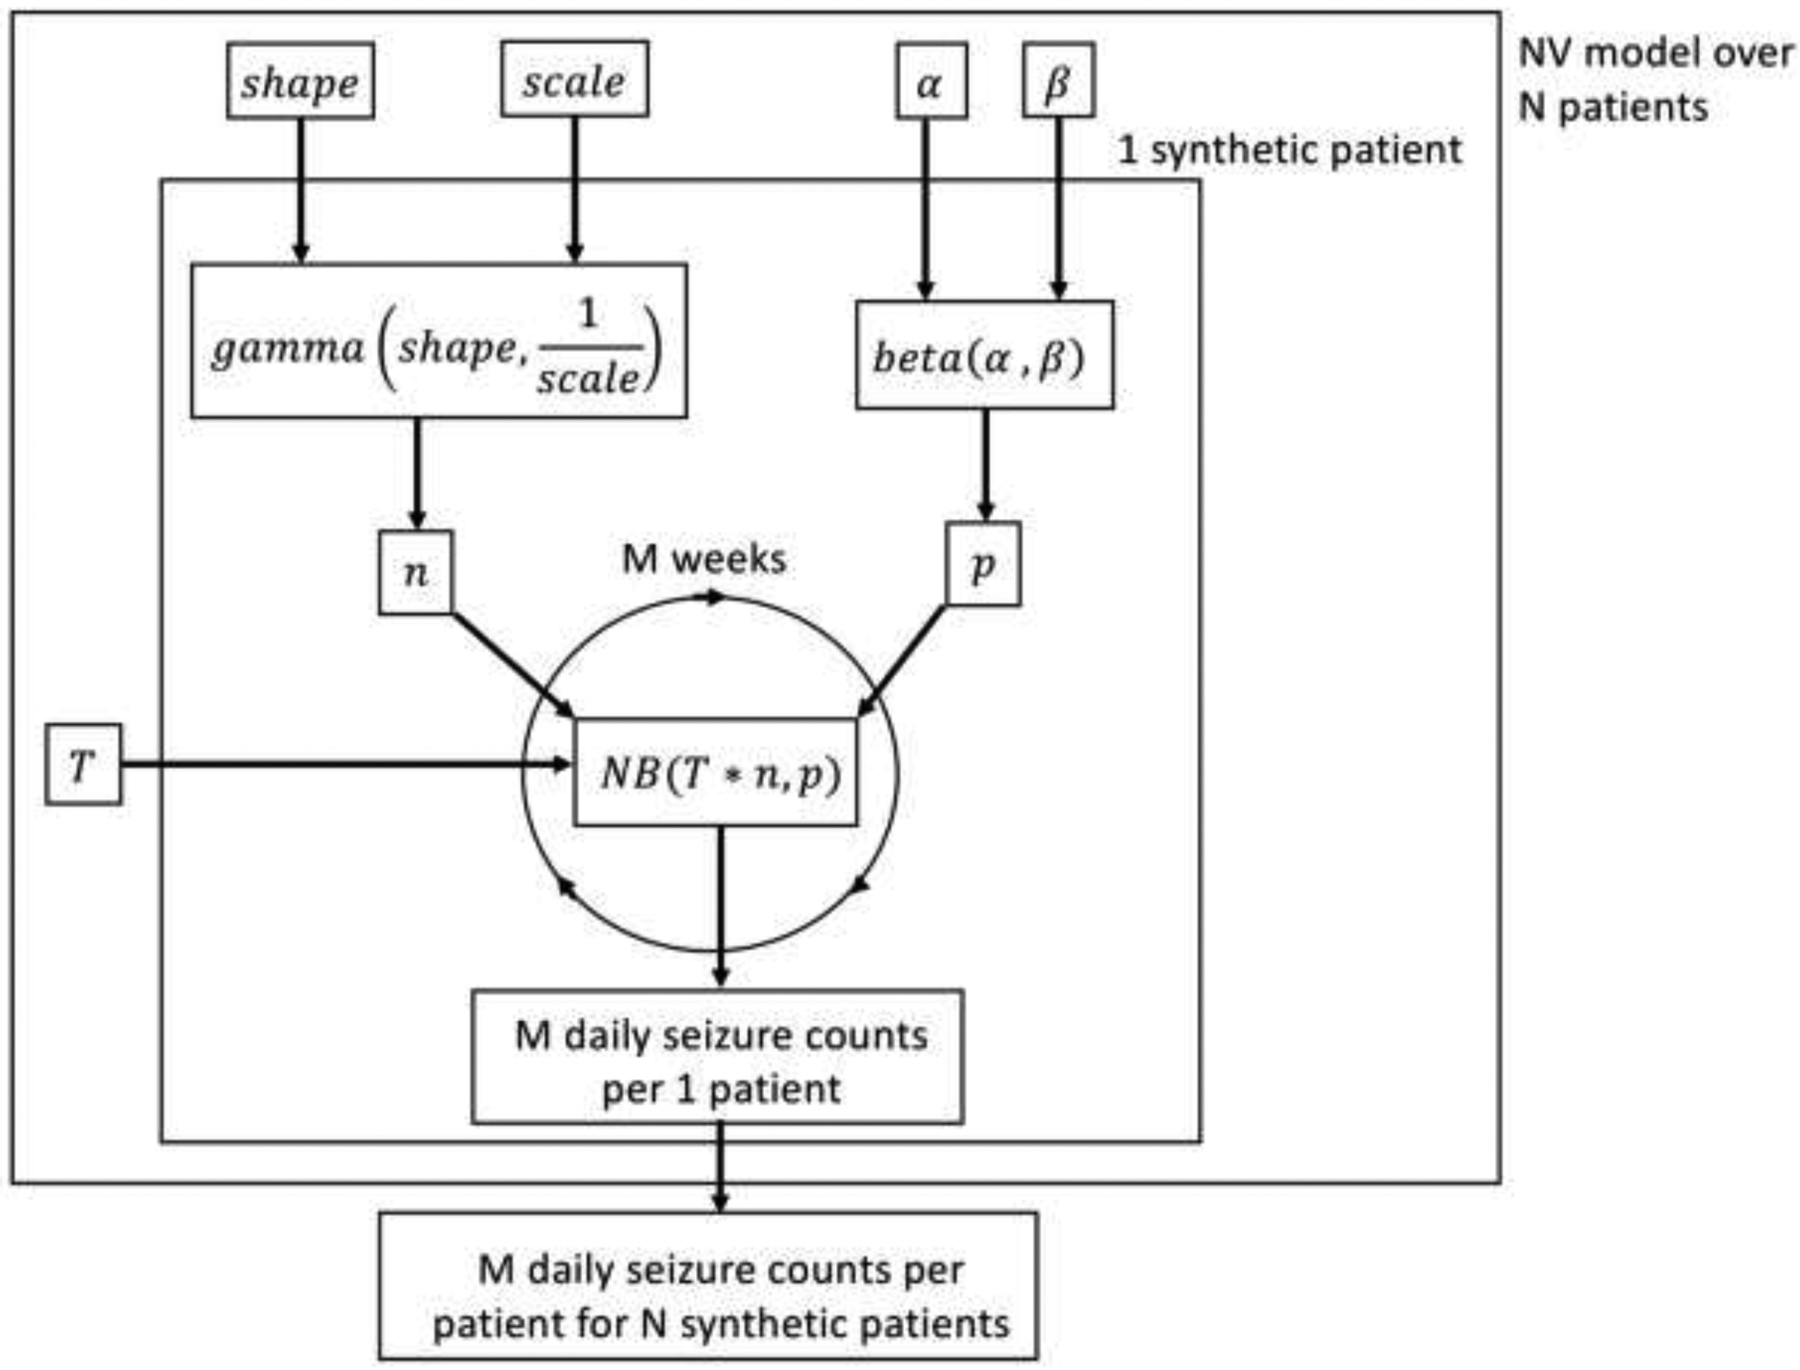
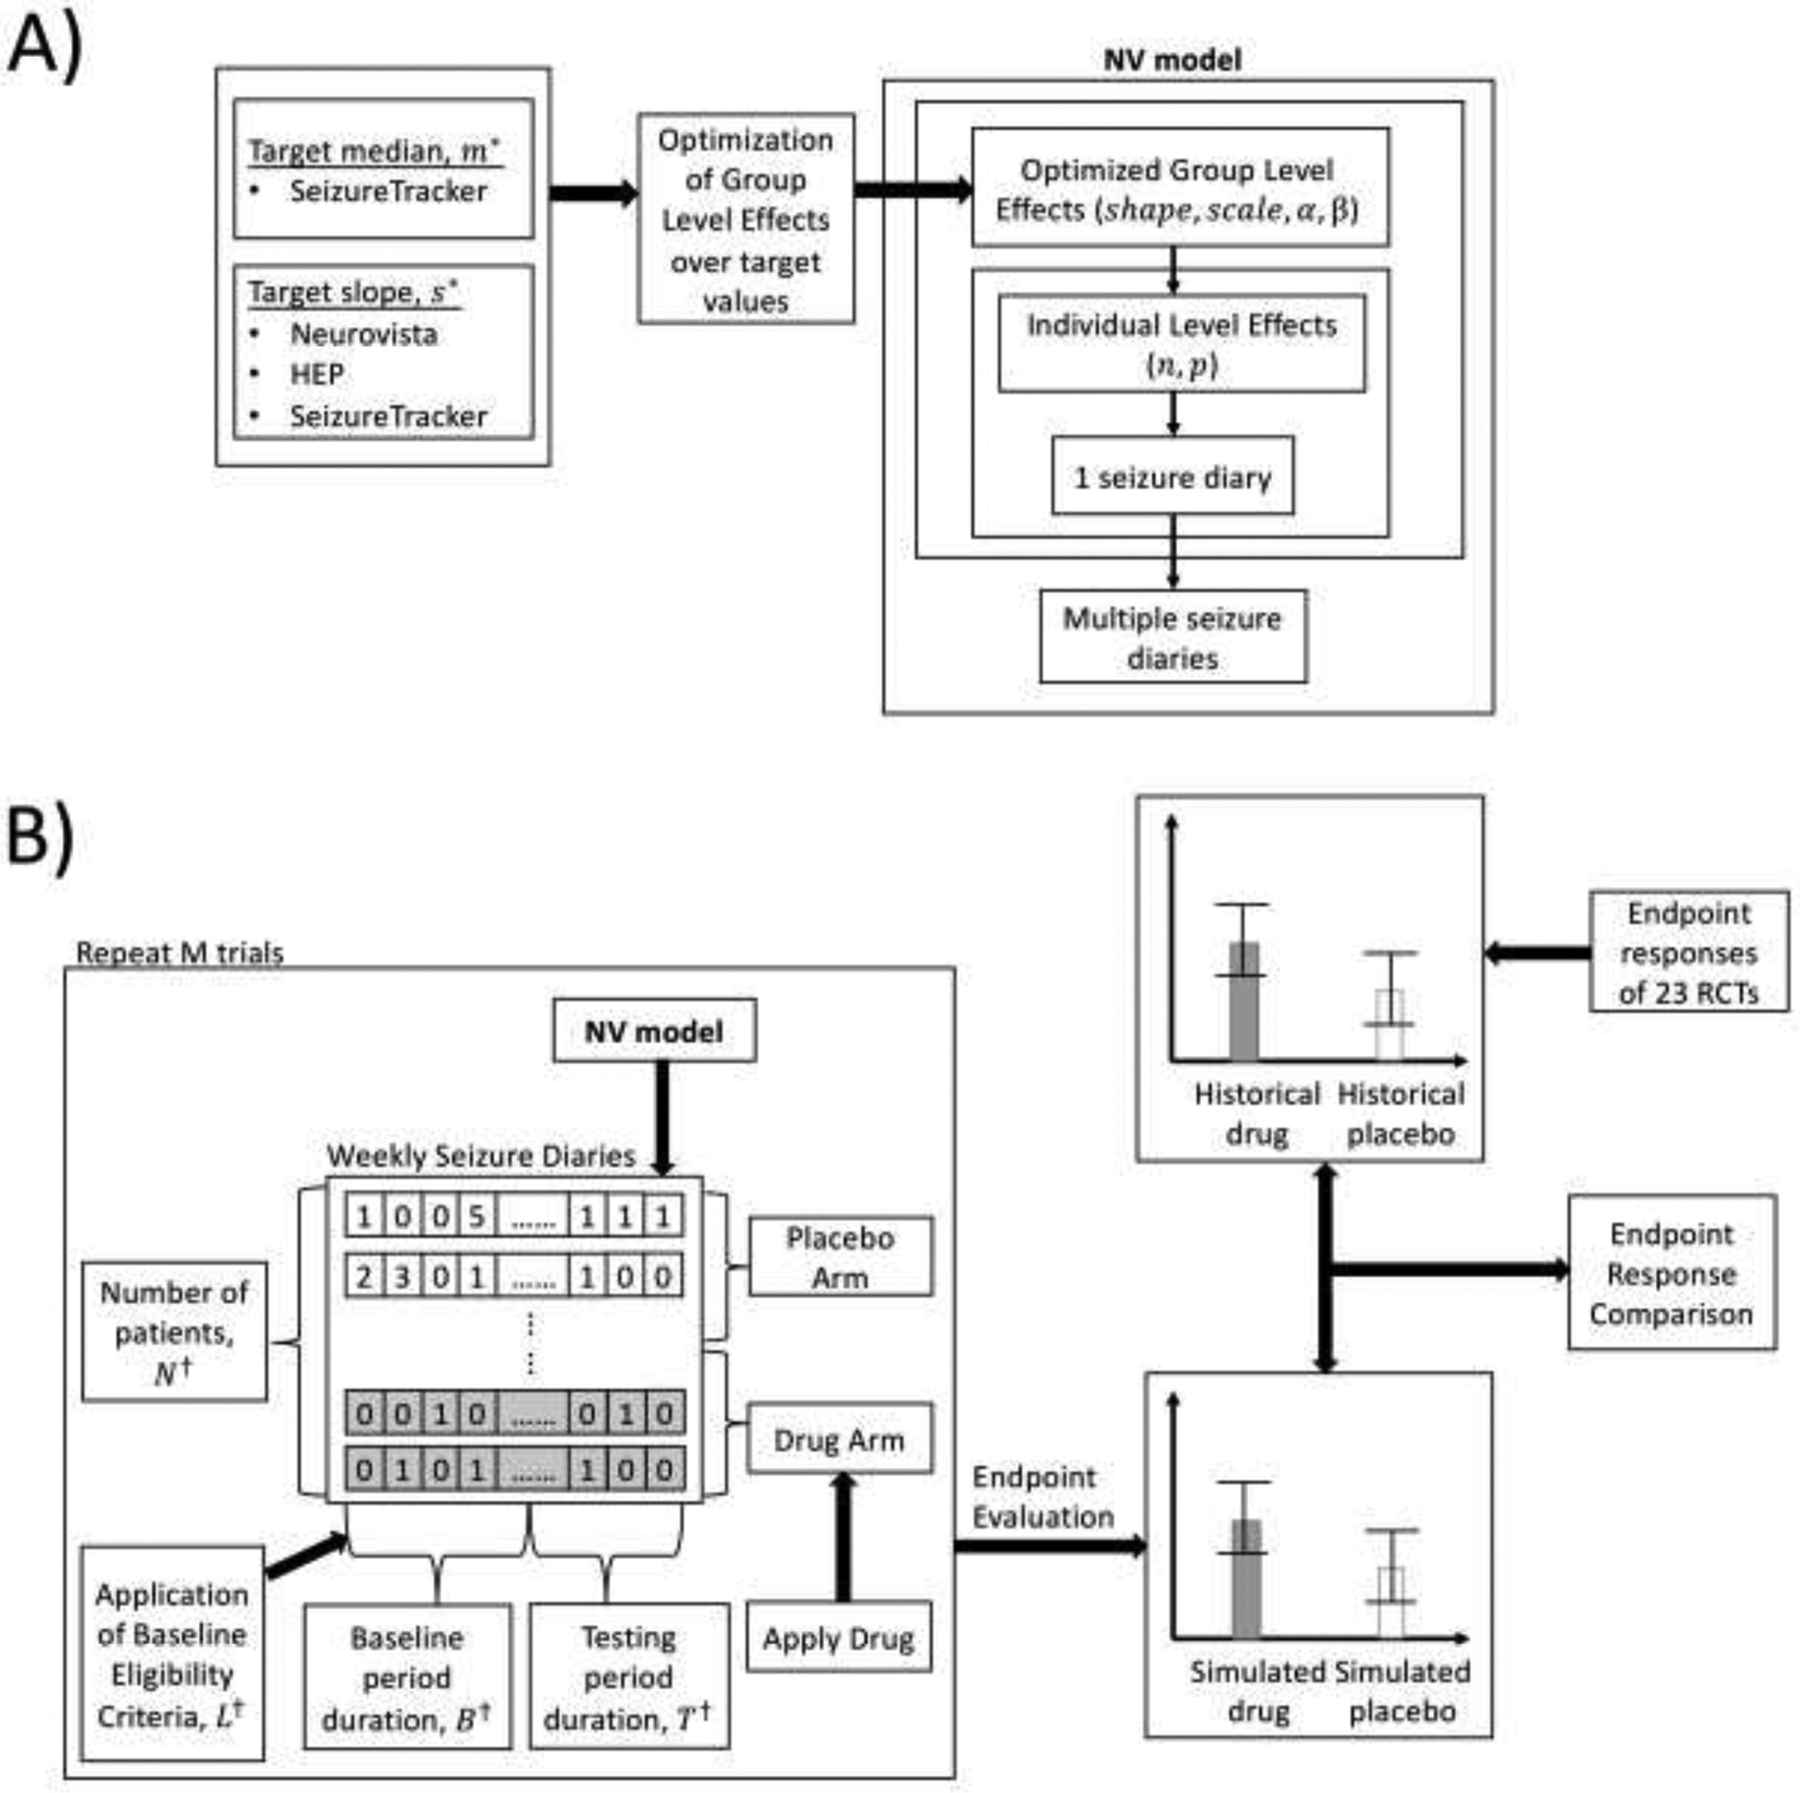
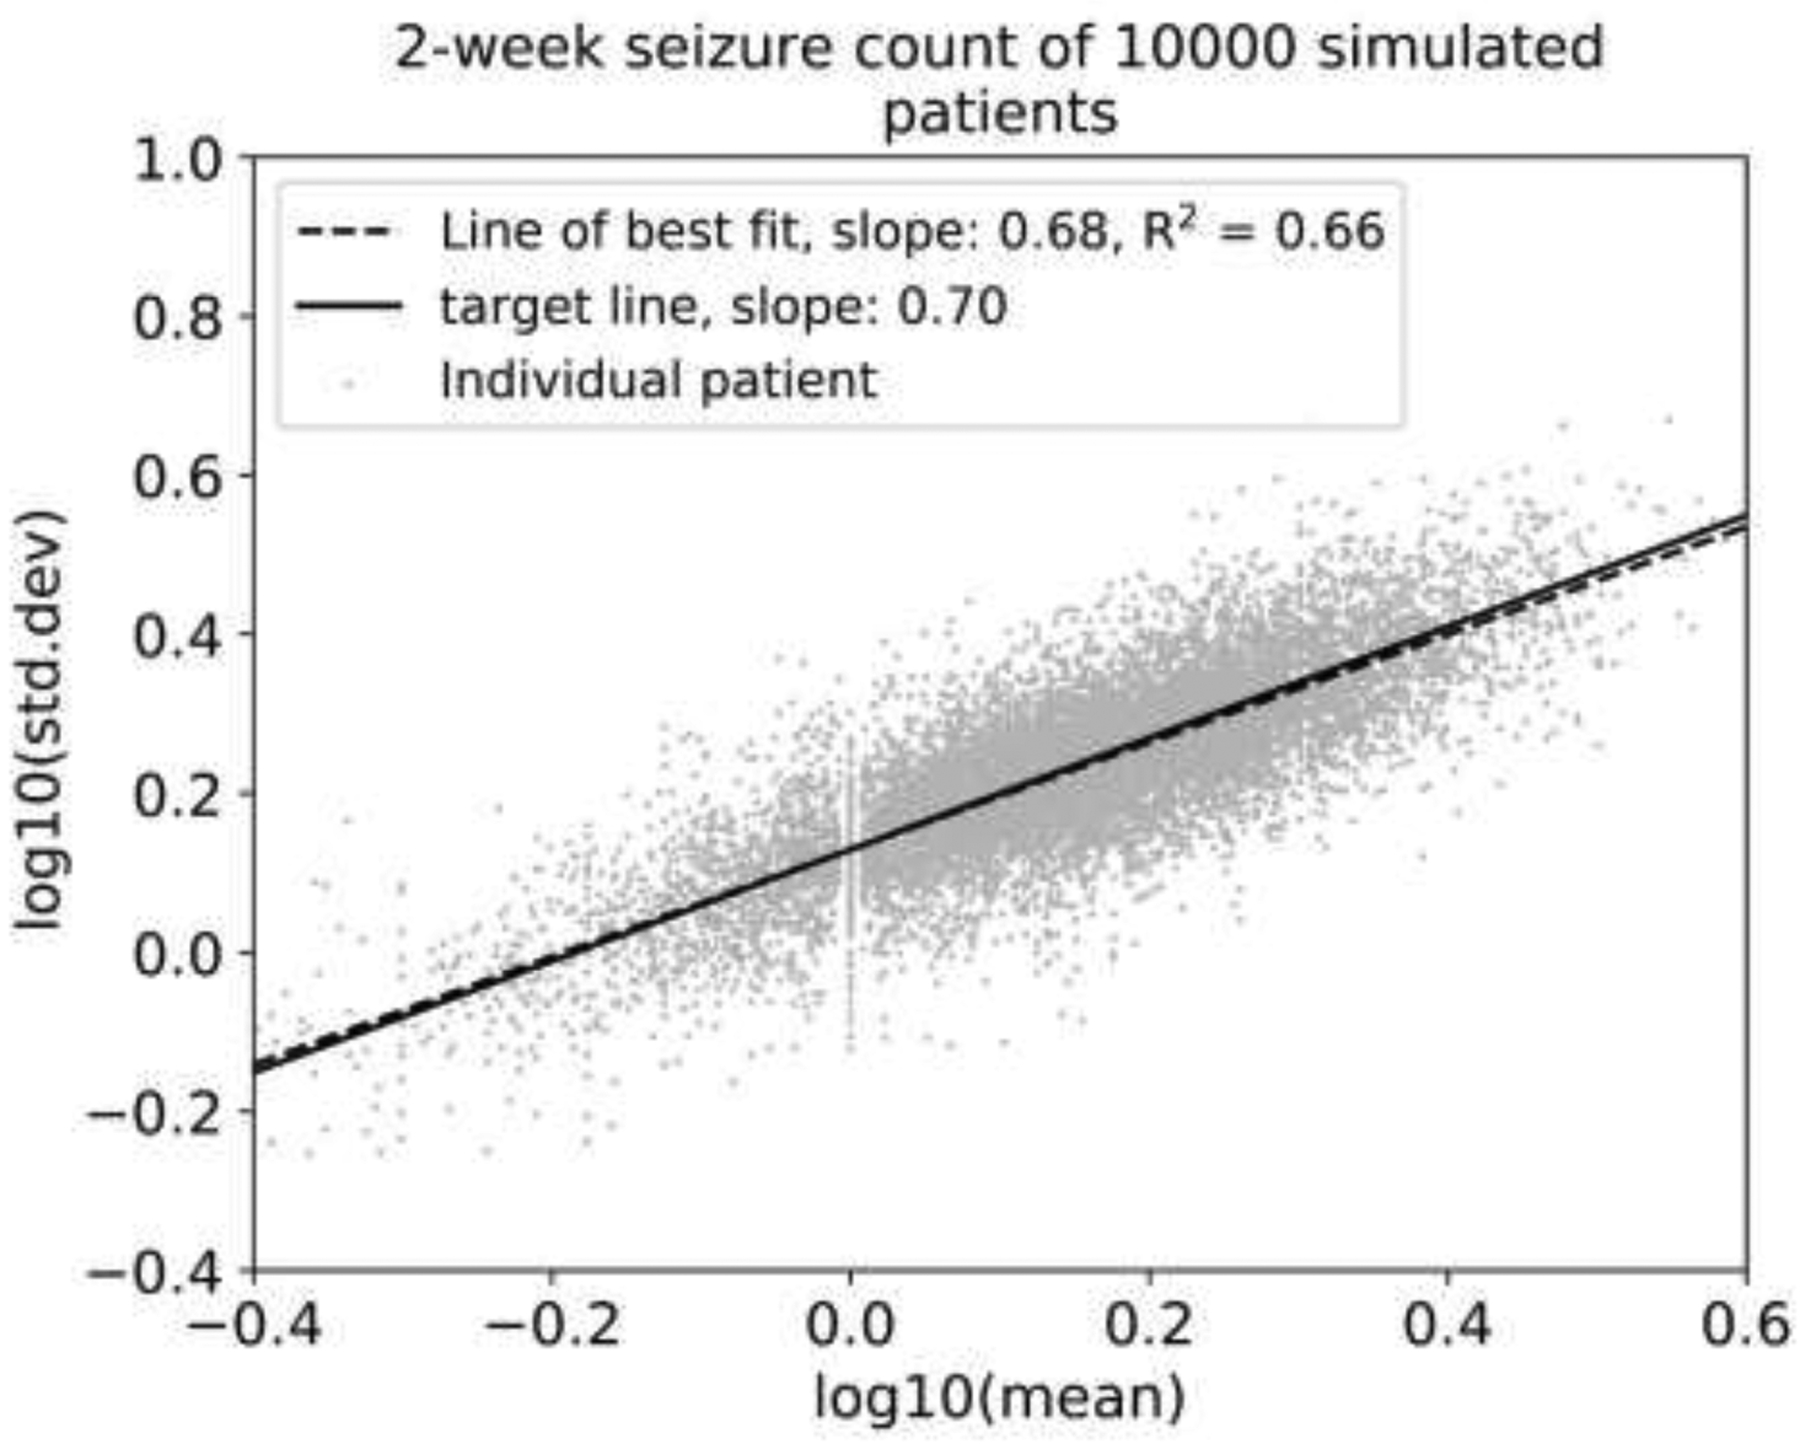
Methods: A synthetic seizure diary generator matching statistical properties seen across multiple epilepsy diary datasets was constructed. The model was used to simulate the placebo arm of 5000 RCTs. A meta-analysis of 23 historical RCTs was compared to the simulations.
Results: The placebo 50 %-responder rate (RR50) was 27.3 ± 3.6 % (simulated) and 21.1 ± 10.0 % (historical). The placebo median percent change (MPC) was 22.0 ± 6.0 % (simulated) and 16.7 ± 10.3 % (historical).
Conclusions: A statistical model of daily seizure count generation which incorporates quantities related to the natural fluctuations of seizure count data produces a placebo response comparable to those seen in historical RCTs. This model may be useful in better understanding the seizure count fluctuations seen in patients in other clinical settings.
Keywords: Clinical trials; Diary; Epidemiology; Seizures; Statistics.
Copyright © 2020 Elsevier B.V. All rights reserved.
Conflict of interest statement
Declaration of Competing Interest The authors declare that there are no conflicts of interest.
Figures


Similar articles
-
Does accounting for seizure frequency variability increase clinical trial power?Epilepsy Res. 2017 Nov;137:145-151. doi: 10.1016/j.eplepsyres.2017.07.013. Epub 2017 Jul 25. Epilepsy Res. 2017. PMID: 28781216 Free PMC article.
-
Flexible realistic simulation of seizure occurrence recapitulating statistical properties of seizure diaries.Epilepsia. 2023 Feb;64(2):396-405. doi: 10.1111/epi.17471. Epub 2022 Dec 4. Epilepsia. 2023. PMID: 36401798 Free PMC article.
-
A multi-dataset time-reversal approach to clinical trial placebo response and the relationship to natural variability in epilepsy.Seizure. 2017 Dec;53:31-36. doi: 10.1016/j.seizure.2017.10.016. Epub 2017 Oct 23. Seizure. 2017. PMID: 29102709 Free PMC article.
-
Treatments for seizures in catamenial (menstrual-related) epilepsy.Cochrane Database Syst Rev. 2019 Oct 14;10(10):CD013225. doi: 10.1002/14651858.CD013225.pub2. Cochrane Database Syst Rev. 2019. Update in: Cochrane Database Syst Rev. 2021 Sep 16;9:CD013225. doi: 10.1002/14651858.CD013225.pub3. PMID: 31608992 Free PMC article. Updated. Review.
-
Immediate antiepileptic drug treatment, versus placebo, deferred, or no treatment for first unprovoked seizure.Cochrane Database Syst Rev. 2021 May 4;5(5):CD007144. doi: 10.1002/14651858.CD007144.pub3. Cochrane Database Syst Rev. 2021. PMID: 33942281 Free PMC article.
Cited by
-
Epilepsy during the COVID-19 pandemic lockdown: a US population survey.Epileptic Disord. 2021 Apr 1;23(2):257-267. doi: 10.1684/epd.2021.1259. Epileptic Disord. 2021. PMID: 33772512 Free PMC article.
-
Increasing challenges to trial recruitment and conduct over time.Epilepsia. 2023 Oct;64(10):2625-2634. doi: 10.1111/epi.17716. Epub 2023 Jul 25. Epilepsia. 2023. PMID: 37440282 Free PMC article.
-
Inductive reasoning with large language models: A simulated randomized controlled trial for epilepsy.Epilepsy Res. 2025 Mar;211:107532. doi: 10.1016/j.eplepsyres.2025.107532. Epub 2025 Feb 24. Epilepsy Res. 2025. PMID: 40020525
-
Factors associated with placebo response rate in randomized controlled trials of antiseizure medications for focal epilepsy.Epilepsia. 2025 Feb;66(2):407-416. doi: 10.1111/epi.18197. Epub 2024 Dec 21. Epilepsia. 2025. PMID: 39707877 Free PMC article.
-
Anti-seizure efficacy and retention rate of carbamazepine is highly variable in randomized controlled trials: A meta-analysis.Epilepsia Open. 2022 Dec;7(4):556-569. doi: 10.1002/epi4.12644. Epub 2022 Aug 30. Epilepsia Open. 2022. PMID: 35980668 Free PMC article. Review.
References
-
- Hougaard P, Lee ML, Whitmore GA. Analysis of overdispersed count data by mixtures of Poisson variables and Poisson processes. Biometrics 1997; 53: 1225–38. - PubMed
Publication types
MeSH terms
Substances
Grants and funding
LinkOut - more resources
Full Text Sources
Medical
