. 2021 Jan;78(1):271-286.
doi: 10.1007/s00018-020-03494-y. Epub 2020 Mar 14.

Bitter taste receptors stimulate phagocytosis in human macrophages through calcium, nitric oxide, and cyclic-GMP signaling

Affiliations

Bitter taste receptors stimulate phagocytosis in human macrophages through calcium, nitric oxide, and cyclic-GMP signaling

Indiwari Gopallawa et al. Cell Mol Life Sci. 2021 Jan.

Abstract

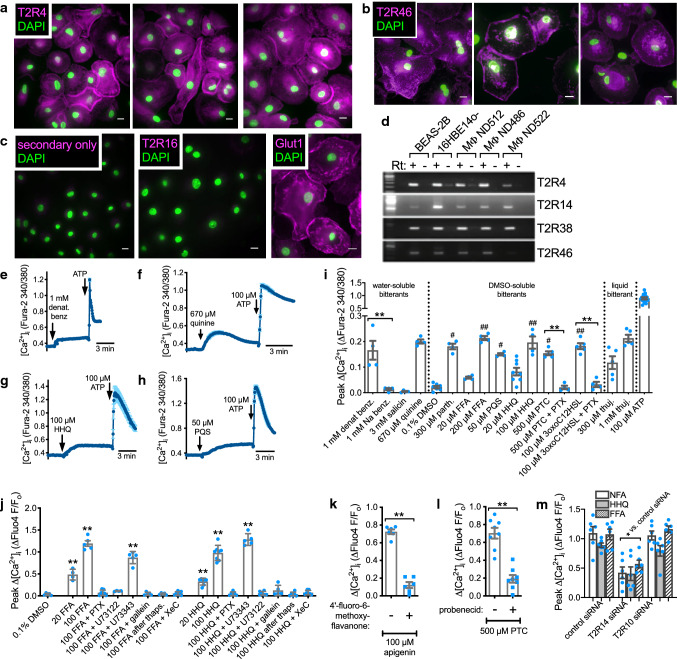
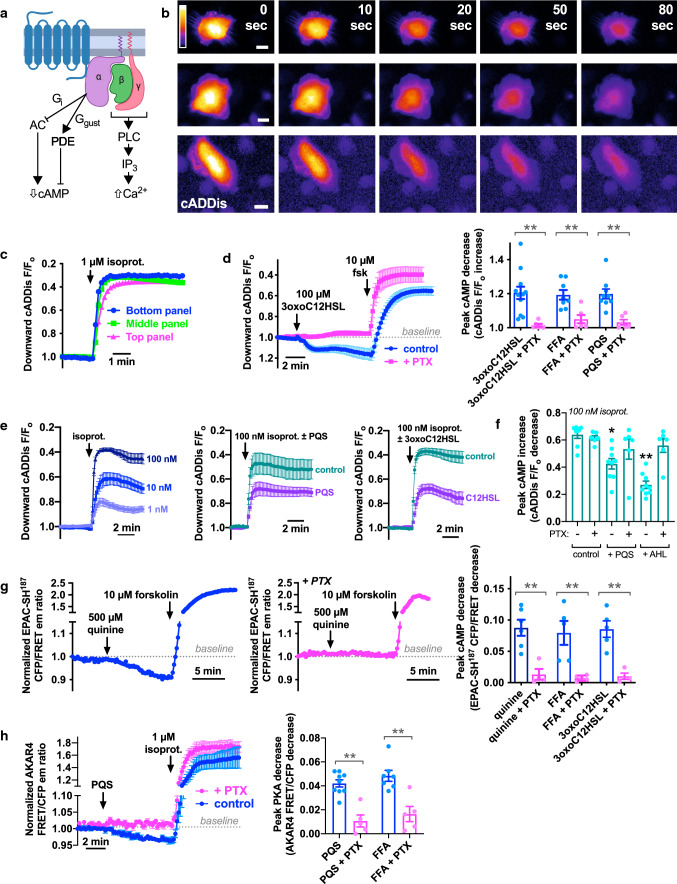
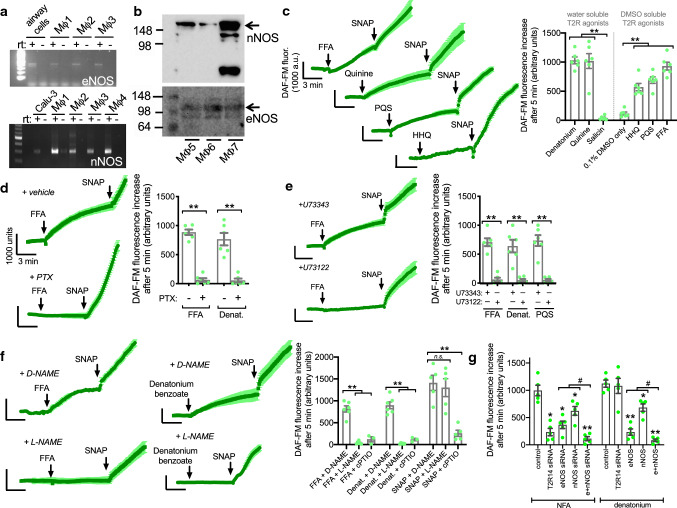
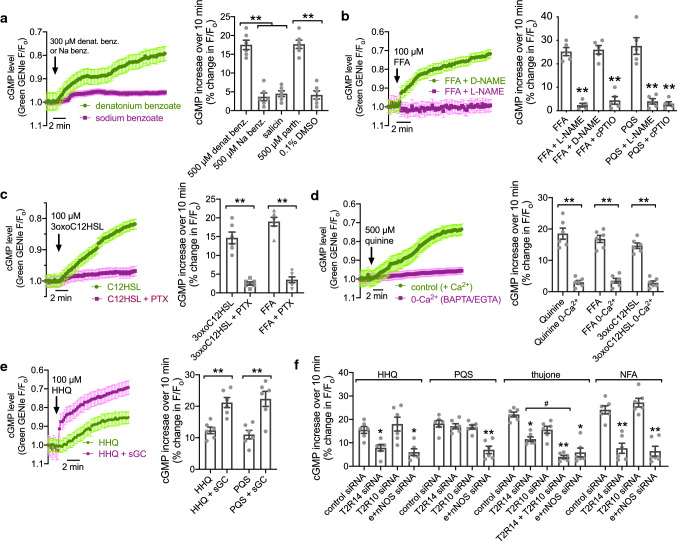
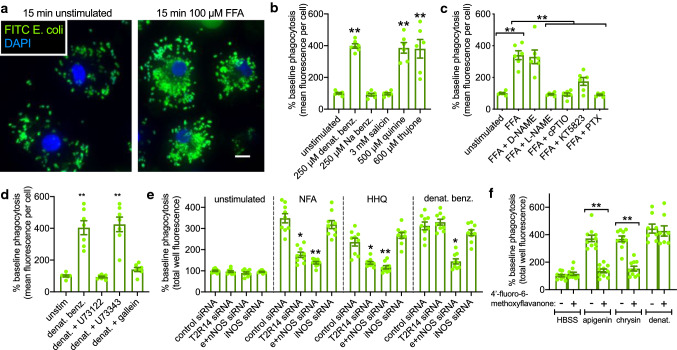
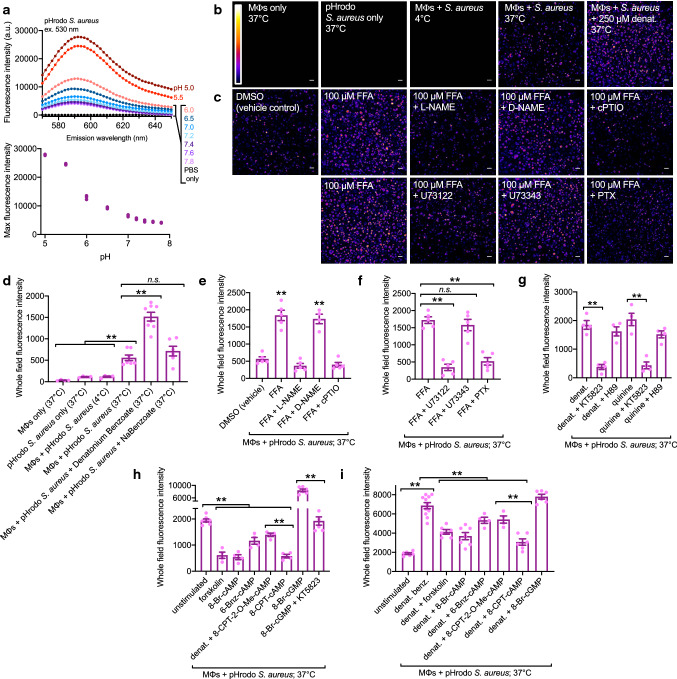
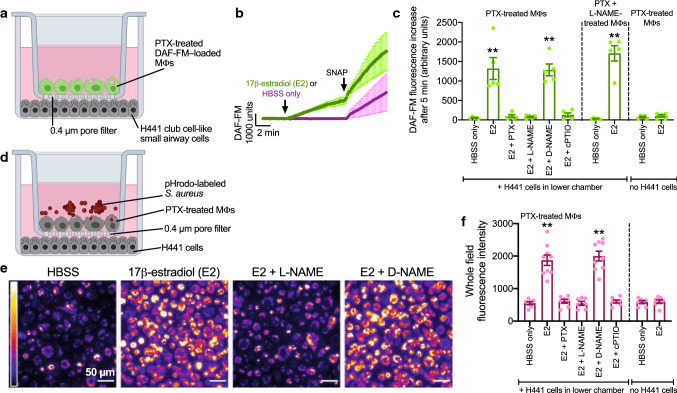
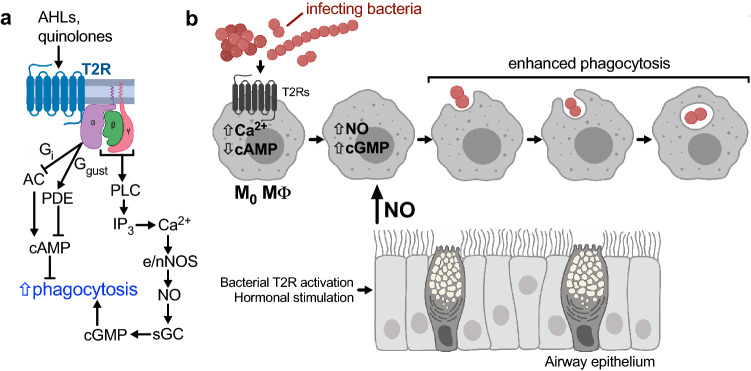
Bitter taste receptors (T2Rs) are GPCRs involved in detection of bitter compounds by type 2 taste cells of the tongue, but are also expressed in other tissues throughout the body, including the airways, gastrointestinal tract, and brain. These T2Rs can be activated by several bacterial products and regulate innate immune responses in several cell types. Expression of T2Rs has been demonstrated in immune cells like neutrophils; however, the molecular details of their signaling are unknown. We examined mechanisms of T2R signaling in primary human monocyte-derived unprimed (M0) macrophages (M[Formula: see text]s) using live cell imaging techniques. Known bitter compounds and bacterial T2R agonists activated low-level calcium signals through a pertussis toxin (PTX)-sensitive, phospholipase C-dependent, and inositol trisphosphate receptor-dependent calcium release pathway. These calcium signals activated low-level nitric oxide (NO) production via endothelial and neuronal NO synthase (NOS) isoforms. NO production increased cellular cGMP and enhanced acute phagocytosis ~ threefold over 30-60 min via protein kinase G. In parallel with calcium elevation, T2R activation lowered cAMP, also through a PTX-sensitive pathway. The cAMP decrease also contributed to enhanced phagocytosis. Moreover, a co-culture model with airway epithelial cells demonstrated that NO produced by epithelial cells can also acutely enhance M[Formula: see text] phagocytosis. Together, these data define M[Formula: see text] T2R signal transduction and support an immune recognition role for T2Rs in M[Formula: see text] cell physiology.

Keywords: Airway epithelium; G-protein-coupled receptors; Innate immunity; Live cell imaging; Quorum sensing.


Figures

Fig. 1
Fig. 1
Unprimed (M0) monocyte-derived MΦs express functional bitter taste receptors (T2Rs). ac Plasma membrane staining observed for T2R4 (a) and T2R46 (b) reminiscent of plasma membrane-localized glucose transporter GLUT1 (c). No immunofluorescence was observed with secondary only control or T2R16 antibody (c). d T2Rs detected in MΦs by rtPCR. Airway epithelial cell lines were used as control. eh Representative low-level Ca2+ responses (fura-2) observed in response to denatonium benzoate (e), quinine (f), HHQ (g), and PQS (h). Subsequent stimulation with purinergic receptor agonist ATP used as control for viability. i Peak change in Ca2+ (fura-2 340/30 ratio) during 5 min stimulation with water soluble, DMSO-soluble, and liquid bitter compounds. ATP response shown for comparison. Also shown is inhibition of responses to PTC and 3oxoC12HSL by pertussis toxin (PTX; 100 ng/ml, 18 h pretreatment). Significance by one-way ANOVA with Bonferroni posttest with preselected paired comparisons; **p < 0.01 between bracketed bars and #p < 0.05 and ##p < 0.01 denote significance compared with DMSO only for DMSO-soluble bitterants. j Peak Ca2+ responses (fluo-4 F/Fo) with T2R14 agonists FFA and HHQ (concentrations are µM) in the presence of inhibitors of GPCR signaling. Significance by one-way ANOVA, Dunnett’s posttest comparing each value to DMSO only. k Peak Ca2+ responses (fluo-4) to T2R14/39 agonist apigenin ± T2R14/39 antagonist 4′-fluoro-6-methoxy-flavanone (50 µM). Significance by Student’s t test; **p < 0.01. l Bar graph showing peak Ca2+ (fluo-4) in response to T2R38 agonist PTC ± antagonist probenecid (1 mM). Significance by Student’s t test; **p < 0.01. m Peak Ca2+ (fluo-4) during stimulation with T2R14 agonists NFA, HHQ, or FFA in MΦs pre-treated with ON-TARGET plus SMARTpool siRNAs. Significance by one-way ANOVA with Bonferroni posttest; **p < 0.01 vs control siRNA condition for each respective agonist. Representative traces are averages of 10–30 MΦs from single experiments. Data points in bar graphs are independent experiments using cells from ≥ 6 experiments (≥ 3 separate donors; ≥ 2 experiments per each donor)
Fig. 2
Fig. 2
T2R signaling in MΦs decreases cAMP. a Diagram (created using Biorender.com) showing canonical T2R transduction pathway by which Gαi (Gi) or Gα gustducin (Ggust) decreases cAMP. b, c Representative image series from 3 separate experiments showing MΦs expressing green downward cADDis (b) and graphs (c) showing reproducibility of fluorescence changes in response to cAMP-elevating isoproterenol. Decrease in fluorescence equals an increase in cAMP, thus shown as an upward deflection (note inverse y axis). d Representative traces (left) and bar graph (right) showing cAMP decreases with 3oxoC12HSL, FFA, and PQS in control MΦs (blue) but not PTX-treated MΦs (pink); adenylyl cyclase-activating forskolin used as control. Traces are mean ± SEM of ≥ 6 independent experiments. e Traces of cADDis fluorescence (mean ± SEM; ≥ 6 independent experiments) during stimulation with isoproterenol ± PQS or 3oxoC12HSL. f Bar graph of peak cAMP increases with 100 nM isoproterenol ± PQS or 3oxoC12HSL (AHL) ± PTX. Graph shows mean ± SEM; each data point equals one independent experiment (n =  ≥ 6 total from ≥ 3 donors). Significance by one-way ANOVA with Dunnett’s posttest (control is isoproterenol only, no PTX). g Traces (left and middle) of changes EPAC-SH187 CFP/FRET fluorescence emission ratio with quinine ± PTX. Each representative trace is a single experiment. Downward deflection equals decrease in cAMP. Right is bar graph of peak cAMP decreases with quinine, FFA, and 3oxoC12HSL ± PTX (mean ± SEM; ≥ 6 experiments each condition from ≥ 3 donors). h Trace of AKAR4 FRET/CFP fluorescence emission ratio (left; mean ± SEM of independent experiments) with PQS (100 µM) ± PTX. Downward deflection equals a decrease in PKA activity. Bar graph (right) shows peak PKA decrease with PQS or FFA ± PTX. Data points in bar graphs use cells from ≥ 3 donors (≥ 6 experiments total, ≥ 2 per donor). Significance in d, g, and h by one-way ANOVA with Bonferroni posttest. Significance in f by one-way ANOVA with Dunnett’s posttest comparing values to control (no PTX); *p < 0.05 and **p < 0.01
Fig. 3
Fig. 3
T2R stimulation activates NO production in MΦs. a Reverse transcription (rt) PCR of MΦs from 3 donors showing expression of eNOS (NOS3) and nNOS (NOS1). b Westerns of eNOS and nNOS using MΦ lysates from 3 donors. c Traces and bar graph showing DAF-FM fluorescence increases during stimulation with FFA (100 µM), quinine (500 µM), PQS (100 µM), HHQ (100 µM), or salicin (3 mM). Non-specific NO donor SNAP (10 µM) shown as a control. d Traces and bar graph showing DAF-FM fluorescence increase in response to FFA (100 µM) or denatonium benzoate (1 mM) ± PTX. e Traces and bar graph showing DAF-FM fluorescence increases in response to FFA (100 µM), denatonium benzoate (1 mM), or PQS (100 µM) in the presence of PLC inhibitor U73122 or inactive analog U73343 (30 min pretreatment, 10 µM). f Traces and bar graph showing DAF-FM fluorescence increases in response to FFA (100 µM) or denatonium benzoate (1 mM) in the presence of l-NAME or inactive d-NAME (100 µM; 30 min pretreatment) as well as with NO scavenger cPTIO (10 µM). g DAF-FM increases in response to 100 µM NFA or 1 mM denatonium benzoate in MΦs treated with Accell SMARTpool siRNAs as indicated. Traces are mean ± SEM from 20–30 MΦs from single representative experiments. Bar graphs are mean ± SEM with data points shown from independent experiments using cells from ≥ 3 donors (≥ 6 experiments total, ≥ 2 per donor). Significance determined by one-way ANOVA with Bonferroni posttest; **p > 0.01 vs control, #p < 0.05 vs bracketed group, ns no statistical significance
Fig. 4
Fig. 4
T2R-induced NO production increases cGMP. a Traces and bar graph showing changes in Green GENIe cGMP indicator with T2R agonists. Decrease in fluorescence equals increase in cGMP, plotted as upward deflection (note inverse y axis). b Traces and bar graph of cGMP increases with FFA or PQS (100 µM each) ±  l-NAME or d-NAME (100 µM 30 min pretreatment) or cPTIO (10 µM). c Traces and bar graph of cGMP increases with 3oxoC12HSL or FFA (100 µm each) ± PTX (100 ng/ml pretreatment for 18 h). d Traces and bar graph of cGMP increases with quinine, FFA (100 µM), or 3oxoC12HSL (100 µM) ± Ca2+ signaling; 0-Ca2+ conditions are 1 µM BAPTA-AM loading for 60 min with stimulation in HBSS containing no added Ca2+ and 1 mM EGTA. e Traces and bar graph of cGMP increases with HHQ or PQS (100 µM each) ± co-infection with BacMam expressing soluble guanylyl cyclase (sGC). f Bar graph of cGMP increases in response to HHQ (100 µM), PQS (100 µM), thujone (600 µM), or NFA (100 µM) in MΦs pre-incubated with ON-TARGET plus SMARTpool siRNAs directed against T2R14 or T2R10, a cocktail of eNOS and nNOS, or control siRNA. All traces are mean ± SEM of ≥ 6 independent experiments. Bar graphs are mean ± SEM with data points shown from independent experiments using cells from at least 2 separate donors (≥ 5 experiments total, ≥ 2 experiments per donor). Significance determined by one-way ANOVA with Bonferroni posttest; * or #p < 0.05 and **p < 0.01
Fig. 5
Fig. 5
T2R-induced NO/cGMP acutely increases MΦ phagocytosis of FITC-labeled E. coli. a Representative image of fixed MΦs after 15 min with FITC E. coli ± FFA. b Bar graphs of normalized phagocytosis (quantified by microscopy) ± various T2R agonists. c Normalized phagocytosis (quantified by microscopy) ± FFA (100 µM) ± d/l-NAME (100 µM, 30 min pretreatment), cPTIO (10 µM), KT5823 (1 µM), or PTX (100 ng/ml; 18 h pretreatment). d Bar graphs showing normalized phagocytosis ± denatonium benzoate (1 mM) ± U73122 (10 µM, 30 min pretreatment), U73343 (10 µM, 30 min pretreatment), or gallein (100 µM). e Bar graph of phagocytosis ± NFA (100 µM), HHQ (100 µM), or denatonium benzoate (1 mM) in MΦs treated with Accell SMARTpool siRNAs as indicated. f Bar graph of phagocytosis increases with T2R14 and T2R39 agonists apigenin and chrysin (50 µM each) in the presence or absence of 50 µM T2R14 and T2R39 antagonist 4′-fluoro-6-methoxyflavanone. Results in (bd) were quantified by microscopy; each independent experiment is average of 10 fields from a single well. Results in (e, f) were quantified by plate reader; each independent experiment is average of 2 wells. Bar graphs are mean ± SEM with data points shown from independent experiments using cells from ≥ 3 separate donors (≥ 2 independent experiments per donor)
Fig. 6
Fig. 6
T2R-induced NO and cGMP acutely increases MΦ phagocytosis of pHrodo-labeled S. aureus. a pHrodo-labeled S aureus were resuspended in PBS buffered to various pHs as indicated to confirm increase in fluorescence with decreasing pH. Experiment in top graph representative of 3 independent replicates, plotted on bottom graph. b Representative images (× 20; scale bar 20 µm) of pHrodo labeled S. aureus and MΦs showing phagocytosis occurring only when both were combined and only at 37 °C. c Representative images of increased phagocytosis with FFA and inhibition with l-NAME (100 µM, 30 min pretreatment), cPTIO (10 µM), U73122 (10 µM, 30 min pretreatment), and PTX (100 ng/ml; 14 h pretreatment). d Quantification of experiments performed as in (b). Significance by one-way ANOVA with Bonferroni posttest; **p < 0.01. e–f Quantification of experiments performed as in (c). g Similar experiments were performed with denatonium benzoate (2 mM) and quinine (500 µM); phagocytosis increase was inhibited by KT5823 but not H89 (5 µM, 10 min preincubation each). Significance by one-way ANOVA with Dunnett’s posttest; ** p < 0.01. h Quantification of pHrodo S. aureus phagocytosis assays ± 10 µM forskolin or cell permeant cAMP or cGMP analogs as indicated. Forskolin or cAMP analogs inhibited phagocytosis; however 8-Br-cGMP increased phagocytosis via PKG, as it was blocked by KT5823 (5 µM, 10 min preincubation). i Quantification of pHrodo S. aureus assays with 1 mM denatonium benzoate ± forskolin or cAMP analogs or cGMP analog. Significance by one-way ANOVA with Bonferroni posttest. Data points in (di) are independent experiments (≥ 6 from ≥ 2 individual donors, all taken with identical microscope settings), each experiment is average of 10 fields from a single well. Incubations for bg were 20 min. Incubations for h and i were 60 min
Fig. 7
Fig. 7
Airway epithelial cells can acutely increase MΦ phagocytosis via intercellular NO. a Diagram of experimental design for (b, c). PTX-pretreated DAF-FM-loaded MΦs were placed in close proximity (< 1 mm) to unloaded H441s separated by a permeable plastic filter. b Stimulation of H441s with 10 nM 17β-estradiol (E2) resulted in an increase in MΦ DAF-FM fluorescence. SNAP (10 µM) added at the end as a positive control. c Bar graph of DAF-FM increases from experiments performed as in a, b. DAF-FM increases were inhibited by treatment of H441s with PTX (100 ng/ml; 18 h) or l-NAME (10 µM, 30 min) or in the presence of cPTIO (10 µM). Treatment of MΦs with l-NAME did not alter responses, and there was no response to E2 in the absence of H441s. d Diagram of experimental design for (ef). PTX-pretreated MΦs incubated with pHrodo-labeled S. aureus were placed in close proximity (< 1 mm) to H441s. e Representative images of fluorescence increases with PTX-pretreated MΦs with H441s stimulated as indicated for 30 min. f Bar graph of MΦs fluorescence increases quantified by microscopy with stimulations as indicated. E2 increased MΦ phagocytosis that was blocked by PTX, l-NAME, cPTIO, or absence of H441s. Bar graphs are mean ± SEM with data points shown from independent experiments using cells from at least 2 individual donors (≥ 2 independent experiments per donor). Significance by one-way ANOVA with Bonferroni posttest with each bar compared with its respective HBSS only control; **p < 0.01. Figures in (a, d) created with Biorender.com
Fig. 8
Fig. 8
Model of T2R signaling in M0 MΦs. a Pathway diagram of T2R signaling investigated in this study, showing T2R inhibition of cAMP via Gαi and/or Gαgust isoforms. Gαi inhibits adenylyl cyclase (AC) while Gαgust activates phosphodiesterase (PDE; based on prior studies; not elucidated in this study), both of which inhibit cAMP production. As cAMP inhibits phagocytosis, the T2R pathway may promote phagocytosis when MΦs are co-stimulated with a cAMP elevating agonist by keeping cAMP levels reduced. Gβγ activation of phospholipase C (PLC), production of inositol trisphosphate (IP3), and elevation of calcium (Ca2+) activates eNOS and/or nNOS to produce nitric oxide (NO). NO activates soluble guanylyl cyclase (sGC) to produce cyclic-GMP (cGMP), which directly enhances phagocytosis. b Activation of MΦ T2Rs increases Ca2+, lowers cAMP, activates eNOS and nNOS, increases cGMP, and enhances phagocytosis. Acute increases in phagocytosis may also be activated by airway epithelial cell NO production. Figures created with Biorender.com

Similar articles

Cited by

References

    1. Behrens M, Meyerhof W. Oral and extraoral bitter taste receptors. Results Probl Cell Differ. 2010;52:87–99. doi: 10.1007/978-3-642-14426-4_8. - DOI - PubMed
    1. Lee RJ, Cohen NA. Taste receptors in innate immunity. Cell Mol Life Sci. 2015;72:217–236. doi: 10.1007/s00018-014-1736-7. - DOI - PMC - PubMed
    1. Freund JR, Lee RJ. Taste receptors in the upper airway. World J Otorhinolaryngol Head Neck Surg. 2018;4:67–76. doi: 10.1016/j.wjorl.2018.02.004. - DOI - PMC - PubMed
    1. Carey RM, Lee RJ. Taste receptors in upper airway innate immunity. Nutrients. 2019 doi: 10.3390/nu11092017. - DOI - PMC - PubMed
    1. An SS, Liggett SB. Taste and smell gpcrs in the lung: evidence for a previously unrecognized widespread chemosensory system. Cell Signal. 2017 doi: 10.1016/j.cellsig.2017.02.002. - DOI - PMC - PubMed

MeSH terms

LinkOut - more resources