

Atrophy patterns of hippocampal subfields in T2DM patients with cognitive impairment
- PMID: 32172485
- PMCID: PMC7308251
- DOI: 10.1007/s12020-020-02249-w
Atrophy patterns of hippocampal subfields in T2DM patients with cognitive impairment
Abstract
Purpose: To identify the volume changes of hippocampus subfields in T2DM patients with cognitive impairment and to determine how these atrophy patterns associate with impairments in different cognitive domain.
Methods: A total of 117 individuals were recruited, including T2DM patients with cognitive impairment (T2DM-CI) (n = 34), T2DM patients without cognitive impairment (T2DM-non-CI) (n = 36) and normal controls (NC) (n = 47). All subjects went through a 3.0 T magnetic resonance (MR) scan and a neuropsychological assessment. Hippocampal subfield volumes were processed using the FreeSurfer 6.0.0 and compared among the three groups. Partial correlation analyses were used to estimate the relationship between cognitive function and hippocampal subfield volume, with age, sex, education, and eTIV (estimated total intracranial volume) as covariants.
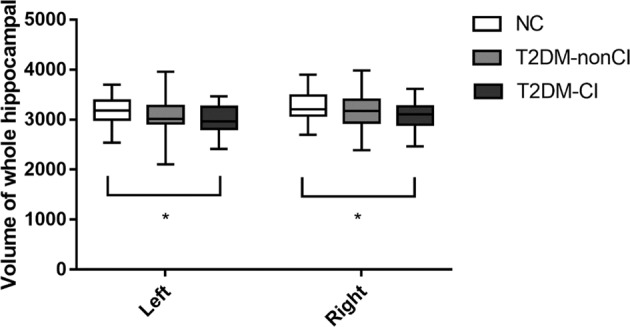
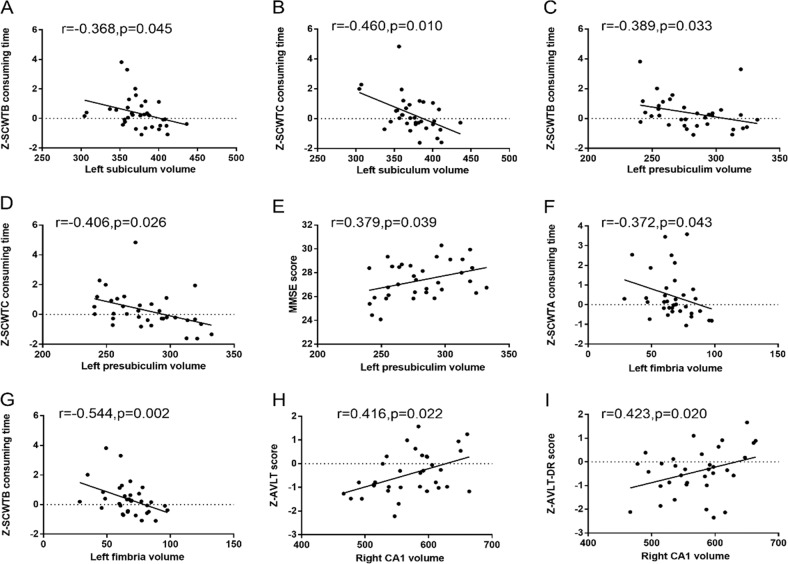
Results: The total hippocampal volume had a reduction trend among the three groups, and the significantly statistical difference only was found between T2DM-CI group and NC group. Regarding the hippocampal subfields, the volumes of left subiculum, left presubiculum, left fimbria, right CA1 and right molecular layer HP decreased significantly in the T2DM-CI group (P < 0.05/12). Partial correlation analyses showed that the volumes of the left subiculum, left fimbria, and left presubiculum were significantly related to executive function. The right hippocampal CA1 volume was significantly correlated with memory in the T2DM-CI group (P < 0.05). But in T2DM-non-CI group, the correlation between the left fimbria volume and the memory, the left subiculum volume and MoCA were different with the T2DM-CI group and NC group (P < 0.05).
Conclusions: The smaller the volume of left presubiculum, the worse the executive function, and the atrophy of the right CA1 was related to memory impairment in T2DM-CI group. However the result was the opposite in T2DM-non-CI group. There might be a compensation mechanism of hippocampus of T2DM patients before cognitive impairment.
Keywords: Cognitive impairment; FreeSurfer; Hippocampal subfields; Magnetic resonance; Type 2 diabetes mellitus.
Conflict of interest statement
The authors declare that they have no conflict of interest.
Figures


References
-
- Schneider ALC, Selvin E, Sharrett AR, Griswold M, Coresh J, Jack CR, Jr., Knopman D, Mosley T, Gottesman RF. Diabetes, prediabetes, and brain volumes and subclinical cerebrovascular disease on MRI: The Atherosclerosis Risk in Communities Neurocognitive Study (ARIC-NCS) Diabetes Care. 2017;40(11):1514–1521. doi: 10.2337/dc17-1185. - DOI - PMC - PubMed
Publication types
MeSH terms
Grants and funding
LinkOut - more resources
Full Text Sources
Other Literature Sources
Medical
Research Materials
Miscellaneous
