

doi: 10.1016/j.jtbi.2020.110243.
Epub 2020 Mar 12.
True epidemic growth construction through harmonic analysis
Affiliations
- PMID: 32173304
- PMCID: PMC7118632
- DOI: 10.1016/j.jtbi.2020.110243
Item in Clipboard
True epidemic growth construction through harmonic analysis
J Theor Biol.
.
Abstract
In this paper, we have proposed a two-phase procedure (combining discrete graphs and wavelets) for constructing true epidemic growth. In the first phase, a graph-theory-based approach was developed to update partial data available and in the second phase, we used this partial data to generate plausible complete data through wavelets. We have provided two numerical examples. This procedure is novel and implementable and adaptable to machine learning modeling framework.
Keywords: Convergence of graphs; Partial to complete data; Wavelets.
Copyright © 2020 Elsevier Ltd. All rights reserved.
Conflict of interest statement
Declaration of Competing Interest None.
Figures
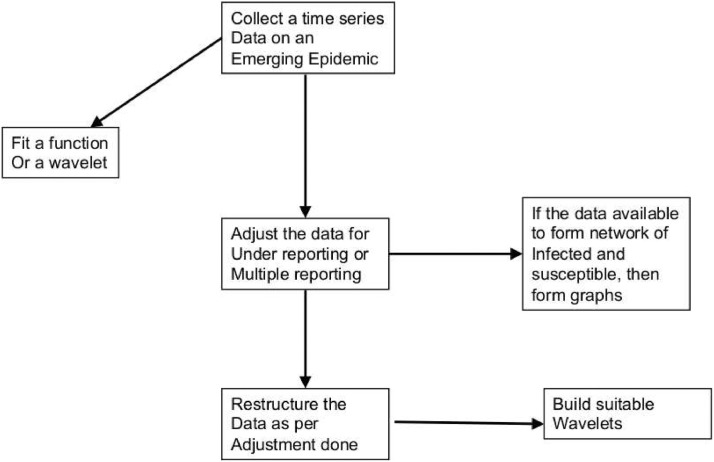
Flow chart describing verious key steps proposed in epidemic data restructuring and constructing wavelets.
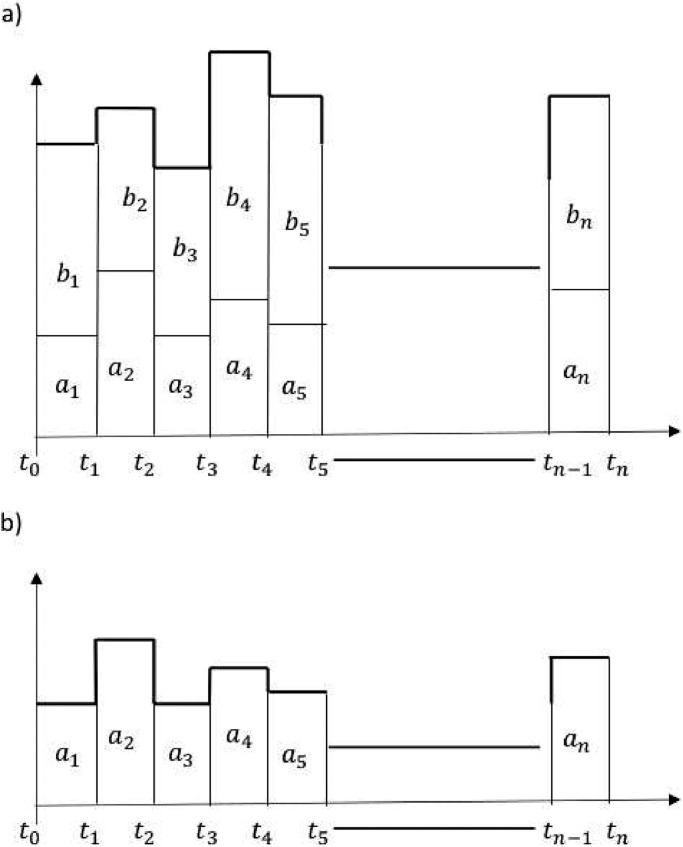
a) True epidemic wave and b) Fractional epidemic wave. The ai values are part of values for each i. We have newly introduced the phrase fractional epidemic waves in this work. This fractional epidemic waves concept we are using with other ideas explained in this paper to develop new ideas related to fractional wavelets. In a sense, fractional wavelets represent fractions of an overall wavelet. This figure serves as a foundational concept to link the idea of fractional reporting waves with reporting errors.
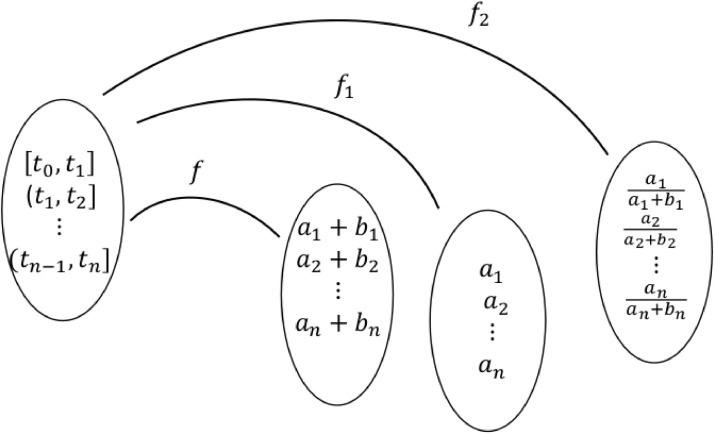
Functions of true and fractional epidemic waves based on reported and actual time series epidemic data.
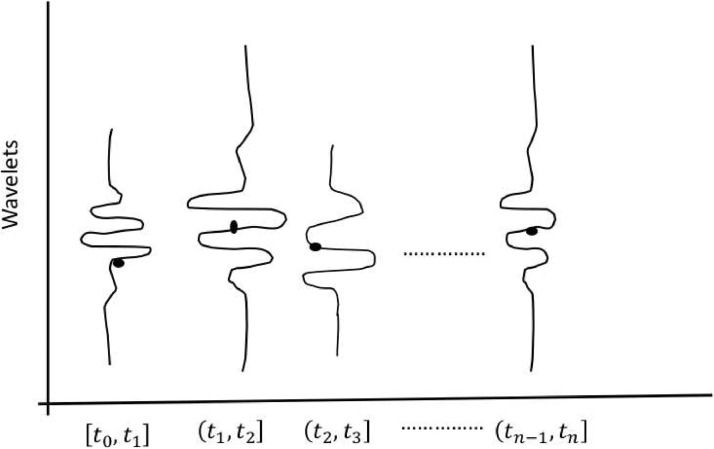
Wavelets constructed from sampled reported data with supports. Black color points on wavelets represent sampled points (of total reported cases). Each wavelet is constructed with the pairs of information {ai, supp(ai)} available. One of the key technical features is that we are proposing through this figure is to construct wavelets within each interval to quantify the proportion of reporting cases out of actual cases.
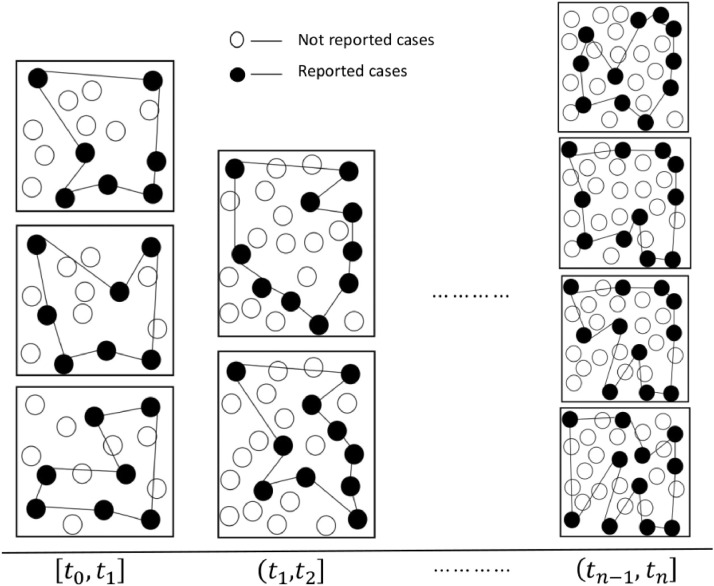
Total reported cases within an interval of time could be formed from sample cases out of total cases. We drew graphs using black colored filled circles in this Figure to represent total reported cases in a few of the situations out of all possible diseases reporting patterns. The sample point of reported cases represents the total reported cases at each time interval. Hence the size of all graphs at each interval was kept the same. Similarly, the size of graphs between different time intervals is kept different for demonstration purposes only and actual reported cases between different time intervals could be constant or not. During the intervals the number of vertices helped to form graph are constant within each time interval (7 in [t0, t1], 10 in (t1, t2] but actual structure of the network has changed between various graphs in each time interval.
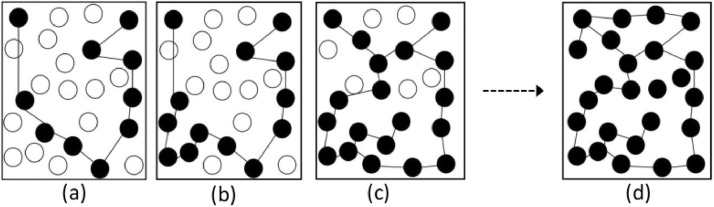
Convergence of graph at sample point to graph at complete reporting. From sampled point number of reported cases to the evolution of actual reported cases. This situation arises due to improved epidemic surveillance.
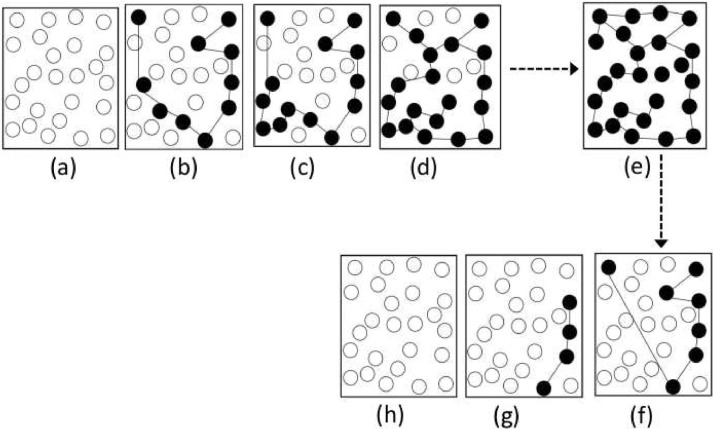
Evolution of reporting of epidemic cases (a) to (e), and returning to disease recovered stage (f) to (h).
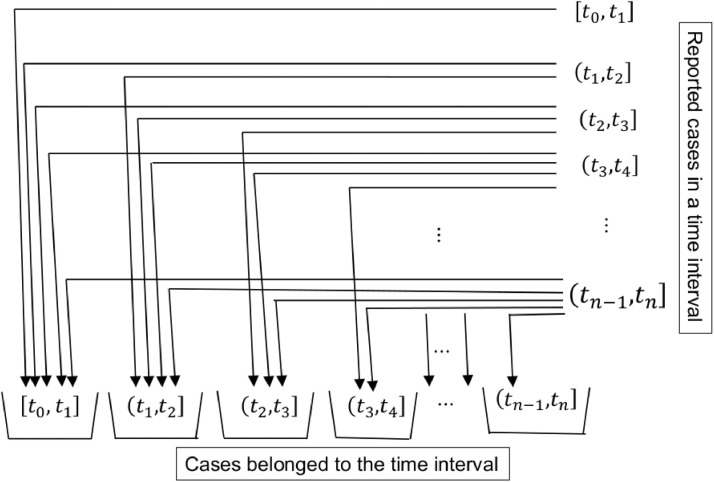
Distribution of reported cases into present time interval and to past time intervals. Reported cases found in a time interval in the column are distributed into respective bins of a time interval as shown through arrows.
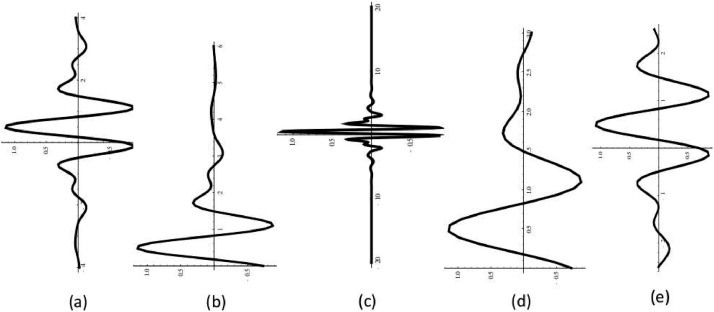
Meyer wavelets of order 3 for various situations for equally spaced interval of (a) [-4,4], (b) [0,6], (c) [-20,20,], (d) [0,3], (e) with order 10 for [-2.5, 2.5].
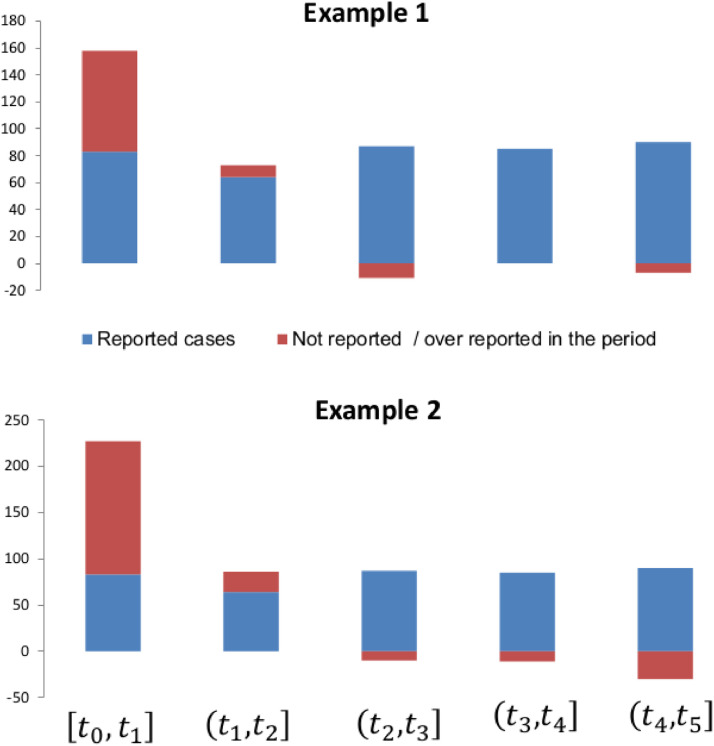
Reported cases and adjusted cases for the first five time intervals. Example 1 and Example 2 are drawn from the reported data in the Table 1 and in the Table 4.
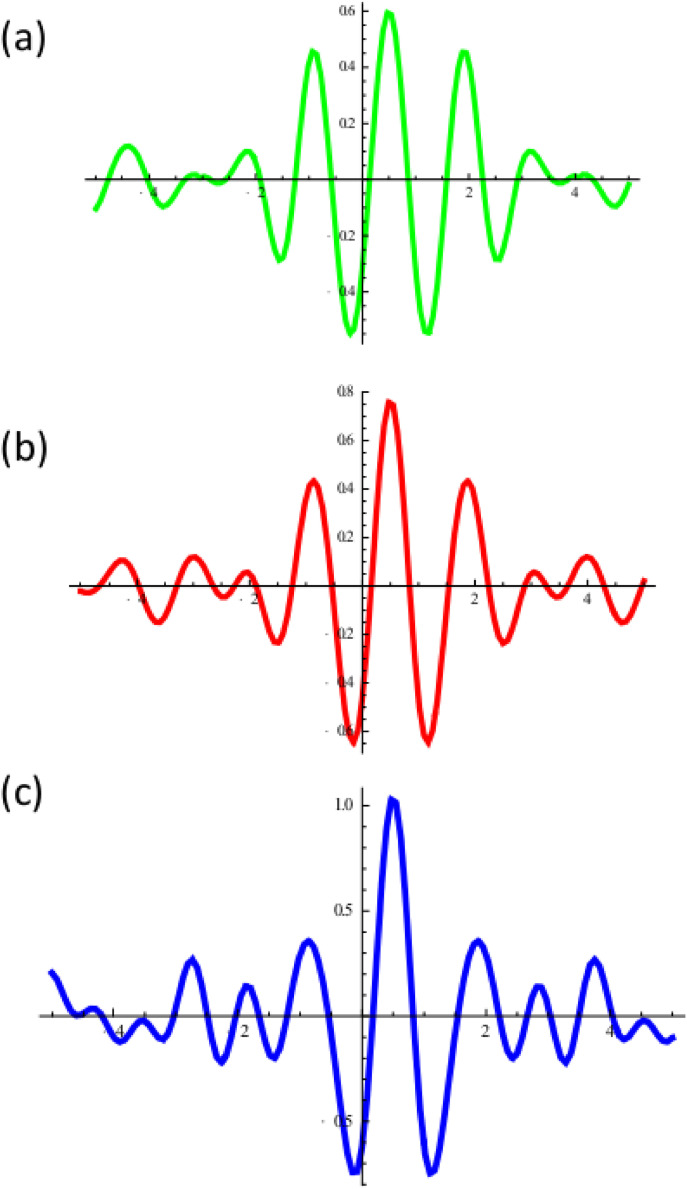
Meyer wavelets constructed on reported and adjusted disease cases. (a) by treating adjusted value of reported cases in Example 2 as 100% reported (order 100), (b) by treating 90% of the disease are reported (order 90), (c) by treating 40% of the original (adjusted) values are reported (order 40).
References
-
- Anderson R.M., May R.M. Oxford Univ. Press; Oxford: 1991. Infectious Diseases of Humans: Dynamics and Control.
-
- Bartlett M.S. Proceedings of the Third Berkeley Symposium on Mathematical Statistics and Probability, Volume 4: Contributions to Biology and Problems of Health, 81–109, 1956. University of California Press; Berkeley, Calif: 1956. Deterministic and tochastic odels for ecurrent pidemics.
-
- Bartlett M.S. Measles periodicity and community size. J. R. Stat. Soc. A. 1957;120(1957):48–70.
-
- Bauch C.T. Vol. 1945. Springer Verlag; 2008. The role of mathematical models in explaining recurrent outbreaks of infectious childhood diseases’. in: ‘mathematical epidemiology. (Lecture Notes in Mathematics, Mathematical Biosciences Subseries).
MeSH terms
LinkOut - more resources
Full Text Sources
