. 2020 Jun:213:116731.
doi: 10.1016/j.neuroimage.2020.116731. Epub 2020 Mar 12.

Does higher sampling rate (multiband + SENSE) improve group statistics - An example from social neuroscience block design at 3T

Affiliations

Does higher sampling rate (multiband + SENSE) improve group statistics - An example from social neuroscience block design at 3T

Ritu Bhandari et al. Neuroimage. 2020 Jun.

Abstract

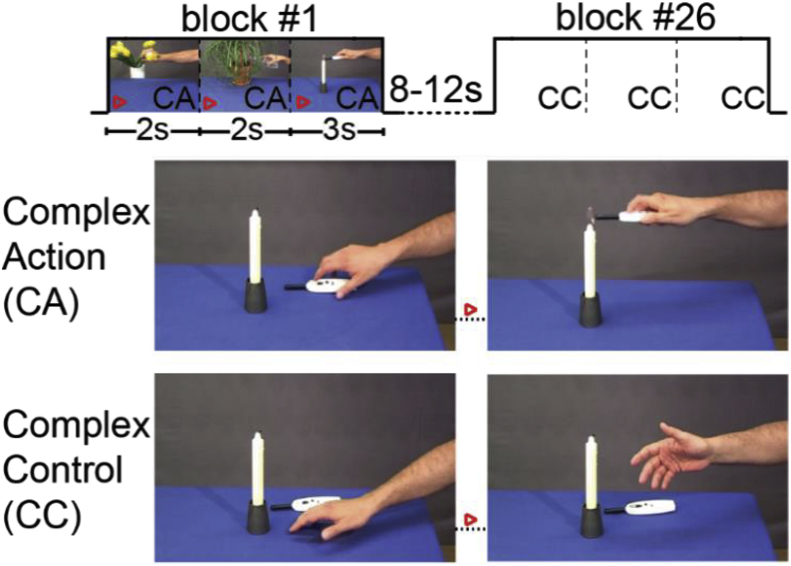
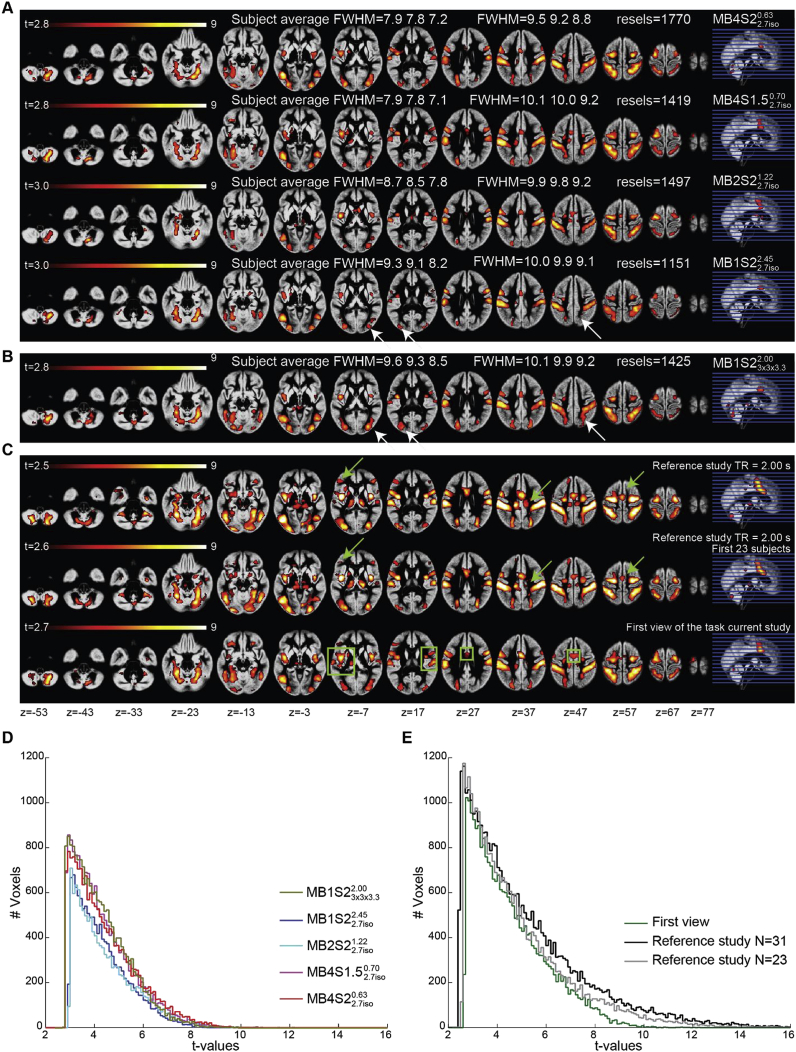
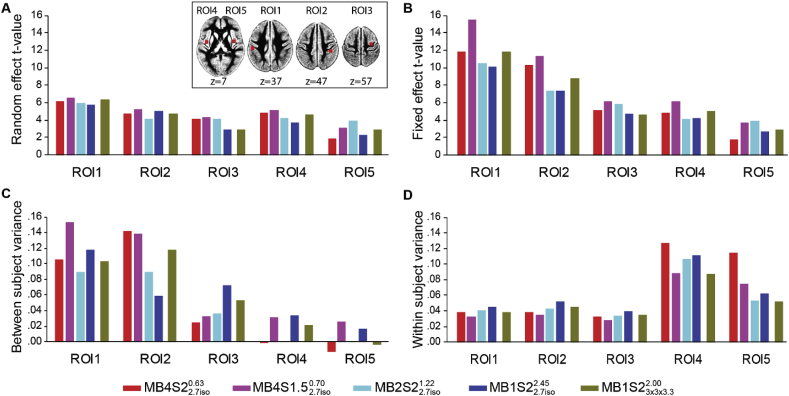
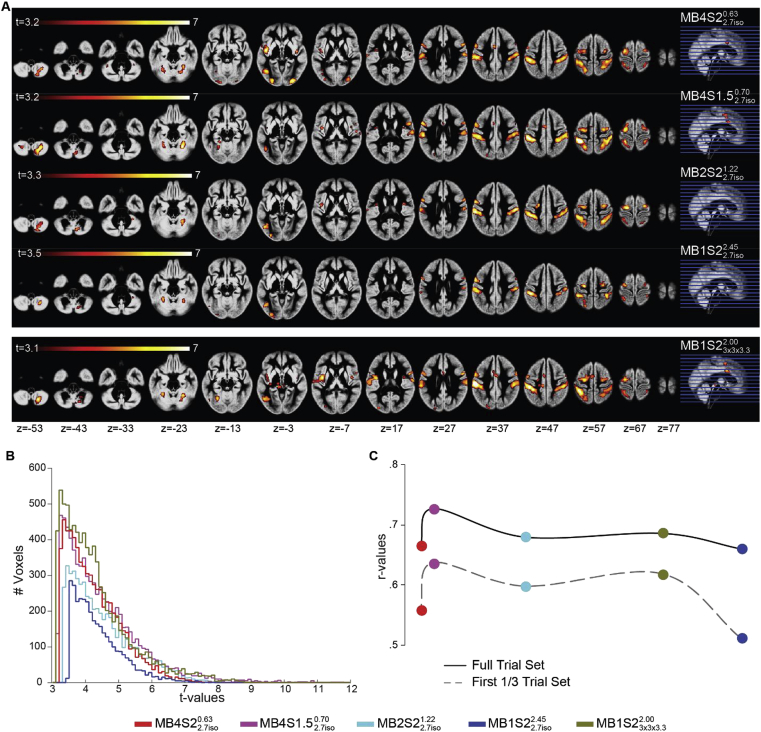
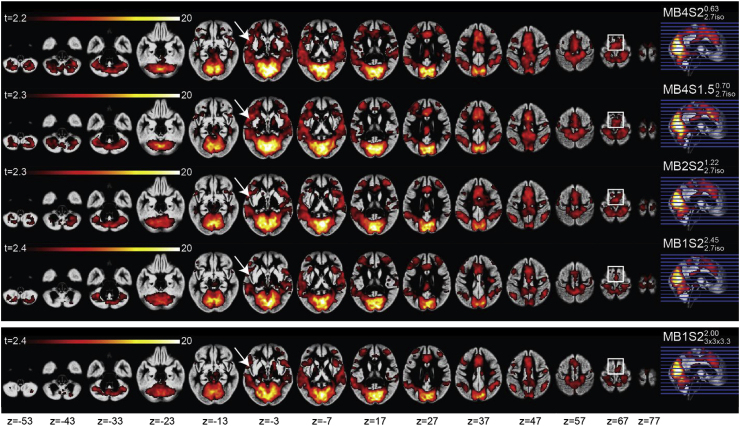
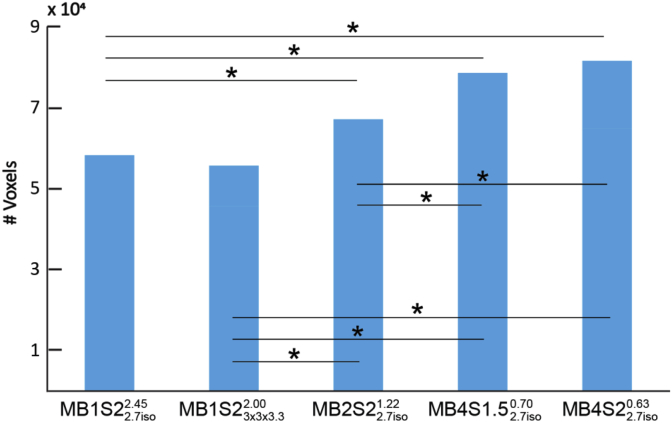
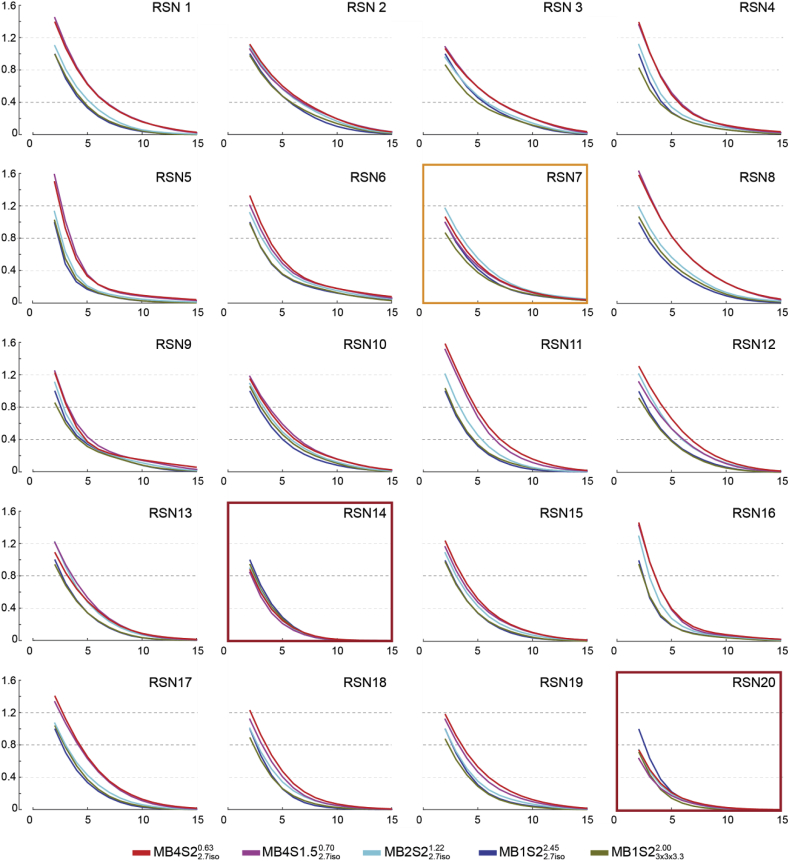
Multiband (MB) or Simultaneous multi-slice (SMS) acquisition schemes allow the acquisition of MRI signals from more than one spatial coordinate at a time. Commercial availability has brought this technique within the reach of many neuroscientists and psychologists. Most early evaluation of the performance of MB acquisition employed resting state fMRI or the most basic tasks. In this study, we tested whether the advantages of using MB acquisition schemes generalize to group analyses using a cognitive task more representative of typical cognitive neuroscience applications. Twenty-three subjects were scanned on a Philips 3 ​T scanner using five sequences, up to eight-fold acceleration with MB-factors 1 to 4, SENSE factors up to 2 and corresponding TRs of 2.45s down to 0.63s, while they viewed (i) movie blocks showing complex actions with hand object interactions and (ii) control movie blocks without hand object interaction. Data were processed using a widely used analysis pipeline implemented in SPM12 including the unified segmentation and canonical HRF modelling. Using random effects group-level, voxel-wise analysis we found that all sequences were able to detect the basic action observation network known to be recruited by our task. The highest t-values were found for sequences with MB4 acceleration. For the MB1 sequence, a 50% bigger voxel volume was needed to reach comparable t-statistics. The group-level t-values for resting state networks (RSNs) were also highest for MB4 sequences. Here the MB1 sequence with larger voxel size did not perform comparable to the MB4 sequence. Altogether, we can thus recommend the use of MB4 (and SENSE 1.5 or 2) on a Philips scanner when aiming to perform group-level analyses using cognitive block design fMRI tasks and voxel sizes in the range of cortical thickness (e.g. 2.7 ​mm isotropic). While results will not be dramatically changed by the use of multiband, our results suggest that MB will bring a moderate but significant benefit.


Conflict of interest statement

Declaration of competing interest The authors report that M.W.A. Caan is shareholder of Nicolab Inc.

Figures

Fig. 1
Fig. 1
Subjects observed 26 blocks of video stimuli per session (x 5 acquisition sequences) showing one of the two conditions: complex action (CA) or complex control (CC). Thirteen bocks per condition were presented and each block comprised of three clips of the same condition. The inter block interval was randomized between 8 and 12 ​s. The blocks and conditions were randomized between the five acquisition sequences per subject and between subjects. The top row schematically illustrates the structure of each run; the bottom two rows illustrate, for a randomly chosen clip, how it differs in the two conditions: a goal directed action in CA and a random movement in CC.
Fig. 2
Fig. 2
All maps are overlaid on the mean grey matter segment of the group. qfdr<0.05, cluster threshold 50 voxels. (A) Group maps showing the task correlated activity detected using the GLM predictors for the acquisition sequences MB1S22.7iso2.45, MB2S22.7iso1.22, MB4S1.52.7iso0.70 and MB4S22.7iso0.63. At the group level the effective smoothing is ~0.5 ​mm more in MB1S22.7iso2.45 compared to MB4S22.7iso0.63 and the average smoothness at the subject level is ~1.4 ​mm more for MB1S22.7iso2.45 compared to MB4S22.7iso0.63. (B) Group maps for the acquisition sequence MB1S23x3x3.32.00. White arrows represent the effect of voxel size on the BOLD outcomes. (C) Group maps from the reference study using the same task (N ​= ​31 subjects), maps from the reference study with a smaller sample of N ​= ​23 subjects and from the current study looking at the first view of the task. Green arrows show how results change with the number of subjects. Green boxes represent the clusters that become bigger or more significant if we only consider the first view. (D) Histogram of the group t values for the CA-CC contrast in Fig. 2A and B. (E) Histogram of the group t values for the CA-CC contrast in Fig. 2C.
Fig. 3
Fig. 3
Mean parameter values for the CA-CC contrast from five ROIs (radius 6 ​mm) centered on the first five voxels showing highest t values (at correction qfdr<0.05) for the CA-CC contrast in the reference study. Figure A and B show the mean t-values from the random effect model and the fixed effect model, respectively. Figure C and D show the between-subject variance and the within-subject variance in these ROIs, respectively. Inset shows the location of the five ROIs.
Fig. 4
Fig. 4
(A) Group maps showing the task correlated activity detected using the task GLM predictors, but using only the first one third of the total acquisition per sequence. Overlaid on the mean grey matter segment of the group. qfdr<0.05, cluster threshold 50 voxels. (B) Histogram of the t values for the CA-CC contrast for the one third of the total acquisition per sequence. (C) Correlation between t-maps of the CA-CC contrast per sequence and t-maps of the same contrast from the 31 subjects of the reference study.
Fig. 5
Fig. 5
Group maps per acquired sequence showing a representative RSN: network number 6, as described in Smith et al. (2009). White arrows and rectangles evidence areas with visually different cluster extension across different sequences. Maps overlaid on the mean grey matter segment of the group, and thresholded at qfdr<0.05 with a minimum cluster size of 50 voxels.
Fig. 6
Fig. 6
Total number of voxels that are significant at qfdr<0.05 for each sequence. (∗p ​< ​0.001 for between sequence comparisons.)
Fig. 7
Fig. 7
Per component number of voxels surviving any t-threshold relative to the non-accelerated MB1S22.7iso2.45 sequence for resting state analysis. The x-axis represents the voxel wise t-values, and the y-axis the number of voxels surviving that threshold relative to the number of voxels surviving t ​≥ ​2 ​at MB1S22.7iso2.45. MB4 sequences are most inclusive, except for the plot framed in orange and red, where MB2S22.7iso1.22 and MB1S22.7iso2.45 sequences include the largest number of voxels.

Similar articles

Cited by

References

    1. Abdelgabar A.R., Suttrup J., Broersen R., Bhandari R., Picard S., Keysers C. Action perception recruits the cerebellum and is impaired in spinocerebellar ataxia patients. BioRxiv. 2018:480293. doi: 10.1101/480293. - DOI - PMC - PubMed
    1. Arnstein D., Cui F., Keysers C., Maurits N.M., Gazzola V. μ-Suppression during action observation and execution correlates with BOLD in dorsal premotor, inferior parietal, and SI cortices. J. Neurosci. 2011;31(40):14243–14249. http://www.jneurosci.org/content/31/40/14243.abstract Retrieved from. - PMC - PubMed
    1. Auerbach E.J., Xu J., Yacoub E., Moeller S., Uğurbil K. Multi-band accelerated spin-echo echo planar imaging with reduced peak RF power using time-shifted RF pulses. Magn. Reson. Med.: Off. J. Soc. Magn. Reson. Med. / Soc. Magn. Reson. Med. 2013;69(5):1261–1267. doi: 10.1002/mrm.24719. - DOI - PMC - PubMed
    1. Badillo S., Vincent T., Ciuciu P. Group-level impacts of within- and between-subject hemodynamic variability in fMRI. Neuroimage. 2013;82:433–448. doi: 10.1016/j.neuroimage.2013.05.100. - DOI - PubMed
    1. Barth M., Breuer F., Koopmans P.J., Norris D.G., Poser B.A. Simultaneous multislice (SMS) imaging techniques. Magn. Reson. Med. 2016;75(1):63–81. doi: 10.1002/mrm.25897. - DOI - PMC - PubMed

Publication types

MeSH terms