T-Cell Infiltration and Adaptive Treg Resistance in Response to Androgen Deprivation With or Without Vaccination in Localized Prostate Cancer
- PMID: 32173650
- PMCID: PMC7334055
- DOI: 10.1158/1078-0432.CCR-19-3372
T-Cell Infiltration and Adaptive Treg Resistance in Response to Androgen Deprivation With or Without Vaccination in Localized Prostate Cancer
Abstract
Purpose: Previous studies suggest that androgen deprivation therapy (ADT) promotes antitumor immunity in prostate cancer. Whether a vaccine-based approach can augment this effect remains unknown.
Patients and methods: We conducted a neoadjuvant, randomized study to quantify the immunologic effects of a GM-CSF-secreting allogeneic cellular vaccine in combination with low-dose cyclophosphamide (Cy/GVAX) followed by degarelix versus degarelix alone in patients with high-risk localized prostate adenocarcinoma who were planned for radical prostatectomy.
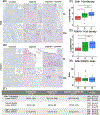
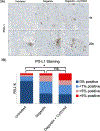
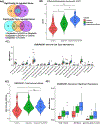
Results: Both Cy/GVAX plus degarelix and degarelix alone led to significant increases in intratumoral CD8+ T-cell infiltration and PD-L1 expression as compared with a cohort of untreated, matched controls. However, the CD8+ T-cell infiltrate was accompanied by a proportional increase in regulatory T cells (Treg), suggesting that adaptive Treg resistance may dampen the immunogenicity of ADT. Although Cy/GVAX followed by degarelix was associated with a modest improvement in time-to-PSA progression and time-to-next treatment, as well as an increase in PD-L1, there was no difference in the CD8+ T-cell infiltrate as compared with degarelix alone. Gene expression profiling demonstrated that CHIT1, a macrophage marker, was differentially upregulated with Cy/GVAX plus degarelix compared with degarelix alone.
Conclusions: Our results highlight that ADT with or without Cy/GVAX induces a complex immune response within the prostate tumor microenvironment. These data have important implications for combining ADT with immunotherapy. In particular, our finding that ADT increases both CD8+ T cells and Tregs supports the development of regimens combining ADT with Treg-depleting agents in the treatment of prostate cancer.
©2020 American Association for Cancer Research.
Conflict of interest statement
Figures


Comment in
-
Androgen deprivation as a tumour-immunomodulating treatment.Nat Rev Urol. 2020 Jul;17(7):371-372. doi: 10.1038/s41585-020-0328-6. Nat Rev Urol. 2020. PMID: 32355324 No abstract available.
Similar articles
-
Androgen Deprivation Therapy Drives a Distinct Immune Phenotype in Localized Prostate Cancer.Clin Cancer Res. 2024 Nov 15;30(22):5218-5230. doi: 10.1158/1078-0432.CCR-24-0060. Clin Cancer Res. 2024. PMID: 39269310 Free PMC article.
-
Systemic GM-CSF Recruits Effector T Cells into the Tumor Microenvironment in Localized Prostate Cancer.Cancer Immunol Res. 2016 Nov;4(11):948-958. doi: 10.1158/2326-6066.CIR-16-0042. Epub 2016 Sep 29. Cancer Immunol Res. 2016. PMID: 27688020 Free PMC article.
-
Sequence of androgen receptor-targeted vaccination with androgen deprivation therapy affects anti-prostate tumor efficacy.J Immunother Cancer. 2024 May 20;12(5):e008848. doi: 10.1136/jitc-2024-008848. J Immunother Cancer. 2024. PMID: 38772685 Free PMC article.
-
Impact of androgen-deprivation therapy on the immune system: implications for combination therapy of prostate cancer.Front Biosci. 2007 Sep 1;12:4957-71. doi: 10.2741/2441. Front Biosci. 2007. PMID: 17569623 Review.
-
Current vaccination strategies for prostate cancer.Eur Urol. 2012 Feb;61(2):290-306. doi: 10.1016/j.eururo.2011.09.020. Epub 2011 Oct 3. Eur Urol. 2012. PMID: 22001436 Review.
Cited by
-
Comprehensive data analysis of genomics, epigenomics, and transcriptomics to identify specific biomolecular markers for prostate adenocarcinoma.Transl Androl Urol. 2021 Jul;10(7):3030-3045. doi: 10.21037/tau-21-576. Transl Androl Urol. 2021. PMID: 34430406 Free PMC article.
-
Lymphangiogenesis-inducing vaccines elicit potent and long-lasting T cell immunity against melanomas.Sci Adv. 2021 Mar 24;7(13):eabe4362. doi: 10.1126/sciadv.abe4362. Print 2021 Mar. Sci Adv. 2021. PMID: 33762337 Free PMC article.
-
First-in-human, phase 1 study of PF-06753512, a vaccine-based immunotherapy regimen (VBIR), in non-metastatic hormone-sensitive biochemical recurrence and metastatic castration-resistant prostate cancer (mCRPC).J Immunother Cancer. 2023 Mar;11(3):e005702. doi: 10.1136/jitc-2022-005702. J Immunother Cancer. 2023. PMID: 36948505 Free PMC article. Clinical Trial.
-
What Do We Have to Know about PD-L1 Expression in Prostate Cancer? A Systematic Literature Review. Part 4: Experimental Treatments in Pre-Clinical Studies (Cell Lines and Mouse Models).Int J Mol Sci. 2021 Nov 14;22(22):12297. doi: 10.3390/ijms222212297. Int J Mol Sci. 2021. PMID: 34830179 Free PMC article.
-
What Do We Have to Know about PD-L1 Expression in Prostate Cancer? A Systematic Literature Review. Part 3: PD-L1, Intracellular Signaling Pathways and Tumor Microenvironment.Int J Mol Sci. 2021 Nov 15;22(22):12330. doi: 10.3390/ijms222212330. Int J Mol Sci. 2021. PMID: 34830209 Free PMC article.
References
-
- Siegel RL, Miller KD, Jemal A. Cancer statistics, 2019. CA Cancer J Clin 2019;69:7–34. - PubMed
-
- Pound CR, Partin AW, Eisenberger MA, Chan DW, Pearson JD, Walsh PC. Natural history of progression after PSA elevation following radical prostatectomy. JAMA 1999;281:1591–7. - PubMed
-
- D’Amico AV, Whittington R, Malkowicz SB, et al. Combination of the preoperative PSA level, biopsy gleason score, percentage of positive biopsies, and MRI T-stage to predict early PSA failure in men with clinically localized prostate cancer. Urology 2000;55:572–7. - PubMed
-
- Kwon ED, Drake CG, Scher HI, et al. Ipilimumab versus placebo after radiotherapy in patients with metastatic castration-resistant prostate cancer that had progressed after docetaxel chemotherapy (CA184–043): a multicentre, randomised, double-blind, phase 3 trial. Lancet Oncol 2014;15:700–12. - PMC - PubMed
Publication types
MeSH terms
Substances
Grants and funding
LinkOut - more resources
Full Text Sources
Other Literature Sources
Medical
Research Materials
Miscellaneous

