. 2020 Apr 21;23(3):165-177.
doi: 10.1093/ijnp/pyz071.

Amygdala-Based Altered miRNome and Epigenetic Contribution of miR-128-3p in Conferring Susceptibility to Depression-Like Behavior via Wnt Signaling

Affiliations

Amygdala-Based Altered miRNome and Epigenetic Contribution of miR-128-3p in Conferring Susceptibility to Depression-Like Behavior via Wnt Signaling

Bhaskar Roy et al. Int J Neuropsychopharmacol. .

Abstract

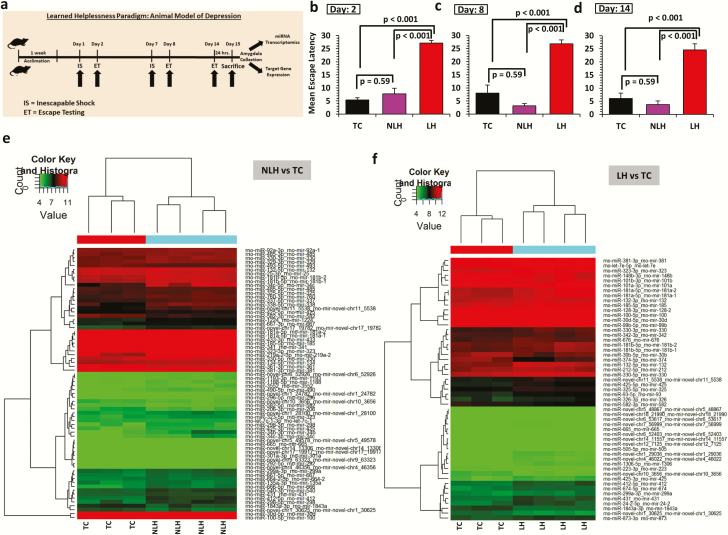
Background: Recent studies suggest that microRNAs (miRNAs) can participate in depression pathogenesis by altering a host of genes that are critical in corticolimbic functioning. The present study focuses on examining whether alterations in the miRNA network in the amygdala are associated with susceptibility or resiliency to develop depression-like behavior in rats.

Methods: Amygdala-specific altered miRNA transcriptomics were determined in a rat depression model following next-generation sequencing method. Target prediction analyses (cis- and trans) and qPCR-based assays were performed to decipher the functional role of altered miRNAs. miRNA-specific target interaction was determined using in vitro transfection assay in neuroblastoma cell line. miRNA-specific findings from the rat in vivo model were further replicated in postmortem amygdala of major depressive disorder (MDD) subjects.

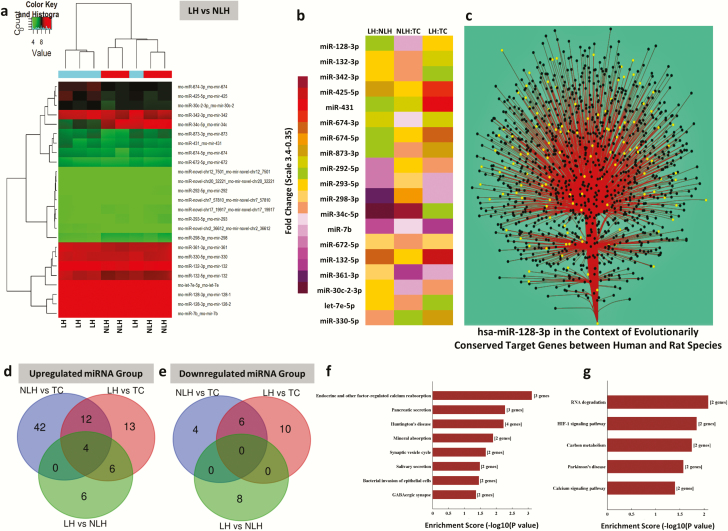
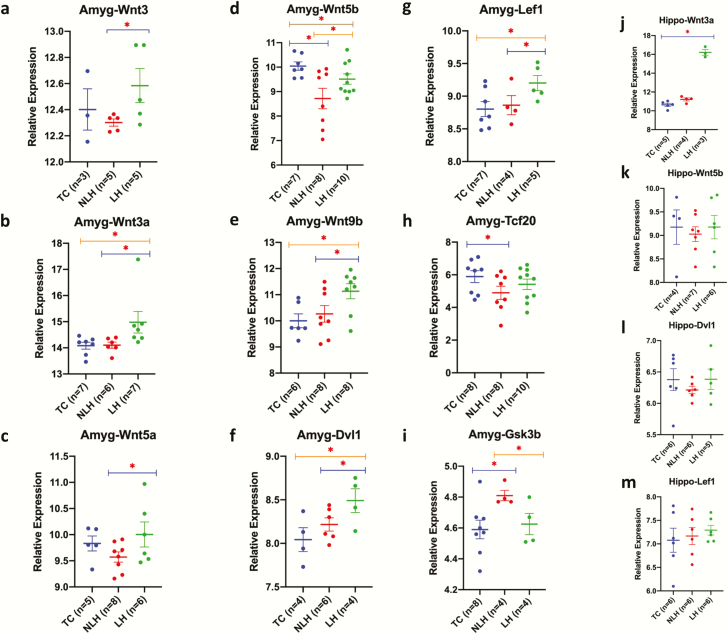
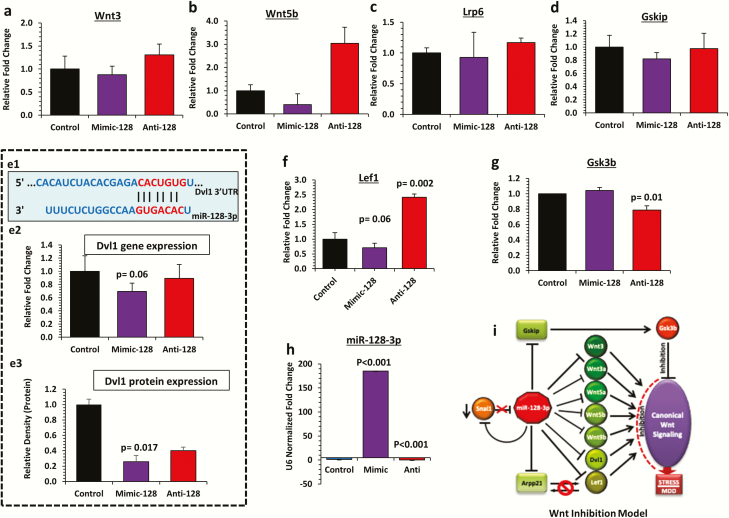
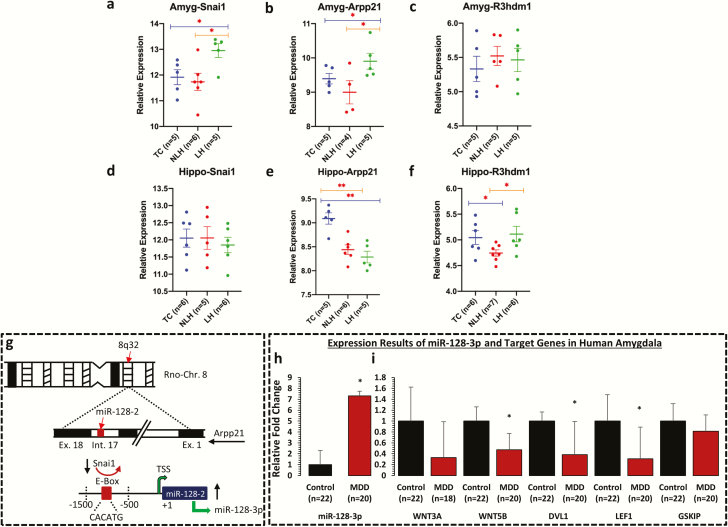
Results: Changes in miRNome identified 17 significantly upregulated and 8 significantly downregulated miRNAs in amygdala of learned helpless (LH) compared with nonlearned helpless rats. Prediction analysis showed that the majority of the upregulated miRNAs had target genes enriched for the Wnt signaling pathway. Among altered miRNAs, upregulated miR-128-3p was identified as a top hit based on statistical significance and magnitude of change in LH rats. Target validation showed significant downregulation of Wnt signaling genes in amygdala of LH rats. A discernable increase in expression of amygdalar miR-128-3p along with significant downregulation of key target genes from Wnt signaling (WNT5B, DVL, and LEF1) was noted in MDD subjects. Overexpression of miR-128-3p in a cellular model lead to a marked decrease in the expression of Dvl1 and Lef1 genes, confirming them as validated targets of miR-128-3p. Additional evidence suggested that the amygdala-specific diminished expression of transcriptional repressor Snai1 could be potentially linked to induced miR-128-2 expression in LH rats. Furthermore, an amygdala-specific posttranscriptional switching mechanism could be active between miR-128-3p and RNA binding protein Arpp21 to gain control over their target genes such as Lef1.

Conclusion: Our study suggests that in amygdala a specific set of miRNAs may play an important role in depression susceptibility, which could potentially be mediated through Wnt signaling.

Keywords: Wnt signaling; amygdala; depression; epigenetics; miRNA; stress.


Figures

Figure 1.
Figure 1.
(a) Schematic diagram showing induction of learned helplessness behavior (LH) in rats. Schematic diagram of the timeline followed as part of the stress paradigm to induce LH behavior in rats. (b-d) Mean escape latencies in nonlearned helpless (NLH) and LH rats compared with tested control (TC) rats. Bar diagrams represent escape latencies in TC, NLH, and LH rats measured on days 2, 8, and 14. Data are the mean ± SEM. Overall group comparisons are as follows: day 2: df = 2,25, F = 61.57; day 8: df = 2,25, F = 47.79; and day 14: df = 2,25, F = 38.99. Individual group comparison showed significantly higher escape latencies for LH rats compared with TC and NLH rats on days 2 (P < .001), 8 (P < .001), and 14 (P < .001). NLH rats did not show any significant difference in escape latency compared with the TC group at any time point (day 2: P = .37; day 8: P = .13; day 14: P = .27). (e) Expression-related changes in miRNA transcriptome based on NLH vs TC group comparison. Hierarchical clustering of miRNAs represents group-wise (NLH vs TC) expression changes plotted with a heat map. Individual samples are represented in each column, whereas each row demonstrates miRNAs. (f) Expression-related changes in miRNA transcriptome based on LH vs TC group comparison. Hierarchical clustering of miRNAs represents group-wise (LH vs TC) expression changes plotted with a heat map. Individual samples are represented in each column, whereas each row demonstrates miRNAs.
Figure 2.
Figure 2.
(a) Expression-related changes in miRNA transcriptome associated with learned helplessness (LH) vs non-learned helplessness (NLH) group comparison. Hierarchical clustering of miRNAs representing group-wise (LH vs NLH) expression changes plotted with a heat map. Individual samples are represented in each column, whereas each row demonstrates miRNAs. (b) Heat map of significantly dysregulated top-ranking miRNAs in LH vs NLH group comparison. The list of significantly altered annotated miRNAs (including both up- and downregulated) from the LH vs the NLH group is presented with a separate composite heat map to show their corresponding expression changes across all 3 groups (NLH vs TC, LH vs TC, and LH vs NLH). (c) An interaction network between has-miR-128-3p and its predicted targets based on Cytoscape diffusion algorithm. Targets were determined using TargetScan’s prediction scheme with stringent selectivity to conserve site context++ scores only. The primary interaction is shown with main stem originating from miR-128-3p at the base and branching out to join the axial nodes (black circle); the edges (red solid line) are bundled to increase visual clarity. Use of diffusion algorithm produces a list of nodes ranked by the heat they accumulated (yellow circle). Theoretically, higher ranking is determined for the nodes, which have many stronger connections. (d) Venn diagram of the overlapping and nonoverlapping class of miRNAs (upregulated) derived from 3 group comparisons. Venn diagram showing significantly upregulated miRNAs either shared or exclusively represented by 2 distinct behavioral phenotypes related to either depression susceptibility or resiliency. (e) Venn diagram of the overlapping and nonoverlapping class of mRNAs (downregulated) derived from 3 group comparisons. A set of significantly downregulated miRNAs is represented on this Venn diagram, showing either distinct or overlapping relationship with depression or resiliency phenotype. (f) Cellular pathways affected by targets of upregulated miRNAs derived from LH vs NLH group comparison. Canonical biological pathways associated with genes that are predicted to be targets of significantly upregulated miRNAs in LH vs NLH rats. (g) Cellular pathways affected by targets of downregulated miRNAs derived from the LH vs the NLH group comparison. Canonical biological pathways associated with genes that are predicted to be targets of significantly downregulated miRNAs in LH vs NLH rats.
Figure 3.
Figure 3.
Amygdala and hippocampus-based expression changes in miRNA targets across 3 comparison groups (nonlearned helplessness [NLH], learned helplessness [LH], and tested control [TC]). (a–i) All data are normalized with Gapdh and presented as the mean ± SEM. Significance level is indicated with an asterisk sign (*P ≤0.05). qPCR-based expression changes in miRNA targets Wnt3, Wnt3a, Wnt5a, Wnt5b, Wnt9b, Dvl1, Lef1, Tcf20, and Gsk3β in LH and NLH groups independently compared with TC. Expression-related significant differences in Wnt3 (P = .033), Wnt3a (P = .042), Wnt5a (P = .045), Wnt5b (P = .044), Wnt9b (P = .031), Dvl1 (P = .047), Lef1 (P = .053), and Gsk3b (P = .026) genes were noted in the LH vs the NLH group. Significant changes in expression were also noted for Wnt5b (P = .007), Tcf20 (P = .045), and Gsk3b (P = .017) genes when the NLH group was compared with the TC group. Group comparison between LH and TC rats identified significant changes in expression of Wnt3a (P = .03), Wnt5b (P = .043), Wnt9b (P = .008), Dvl1 (P = .029), and Lef1 (P = .019) genes. (j–m). All data are normalized with Gapdh and presented as the mean ± SEM. qPCR-based expression change of miRNA targets Wnt3a, Wnt5b, Dvl1, and Lef1 in hippocampus of LH and NLH groups independently compared with TC. Expression-related significant differences were only noted in Wnt3a (P < .005) gene when the LH group was compared with the TC group.
Figure 4.
Figure 4.
Functional validation of miR-128-3p targets in SH-SY5Y cell line and proposed Wnt inhibition model. (a–g) Bar diagram represents the relative expression of Wnt3, Wnt5b, Lrp6, Gskip, Dvl1, Lef1, and Gsk3b transcripts in SH-SY5Y cell line transiently transfected with mimic miR-128-3p overexpression oligo (mimic-128) or anti-miR-128-3p overexpression oligo (anti-128) and compared with control cells. GAPDH was used as a normalizer for target gene expression. Values are represented as mean ± SEM. (e1) Diagram representing predicted target site interaction between rat miR-128-3p seed region and Dvl1 3’ untranslated region (UTR). (e2) Dvl1 gene expression showed significant (P = .06) change when the mimic-128 group was compared with control. (e3) Immunoblot analysis of Dvl1 protein expression in SH-SY5Y cell line miR-128-3p gain (mimic-128) and loss (anti-128) of function mutations. A significant (P = .017) decrease in Dvl1 protein level was noted in the mimic-128 group compared with control. Conversely, a marked increase in Dvl1 protein expression was identified in the anti-128 group compared with control. (f) A significantly (P = .002) higher expression of Lef1 gene was observed in anti-128 transfected cell line compared with the control group. (g) Expression of Gsk3b gene was significantly (P = .01) lower in anti-128 transfected cell line compared with control. (h) Expression level of miR-128-3p in SH-SY5Y cell line individually transfected with miR-128-3p oligo (mimic-128) and miR-128-3p anti-sense oligo (anti-128). Compared with the control group, the mimic-128 transfected cell line showed a significant (P < .001) increase in miR-128-3p expression, whereas significantly (P < .001) reduced miR-128-3p expression was observed in the anti-128 transfected group. (i) The cellular model of canonical Wnt pathway inhibition partially mediated via miR-128-3p overexpression under stress-induced maladaptive changes.
Figure 5.
Figure 5.
mRNA expression profile of Snai1, Arpp21, and R3hdm1 in amygdala and hippocampus of LH, NLH, and TC rats and expression profile of miR-128-3p and its target genes in amygdala of MDD subjects. qPCR-based expression changes in Snai1, Arpp21, and R3hdm1 genes in amygdala and hippocampus of LH and NLH groups independently compared with tested controls (TC). All data are Gapdh normalized and presented as the mean ± SEM. (a–c) mRNA-based expression profile in amygdala demonstrated significant changes in Snai1 gene when the LH group was independently compared with the TC (P = .015) or NLH (P = .011) groups. Group comparison between LH and TC rats identified significant changes in expression of Arpp21 (P = .05). Similarly, Arpp21 demonstrated significant change (P = .02) when LH rats were compared with NLH rats. (d–f) In hippocampus, group comparison between NLH and TC rats identified significant change in expression of Arpp21 (P = .001). Comparison between LH and TC rats also identified significant changes in expression of Arpp21 (P < .005). For R3hdm1 gene, group comparison between NLH and TC demonstrated significant difference in expression (P = .02). Significant change in expression was also noted for R3hdm1 (P = .01) when LH rats were compared with NLH rats. (g) Schematic diagram showing the underlying model of miR-128-3p transcriptional regulation being coordinated by transcriptional repressor Snai1 from rat chromosome 8. This zinc finger family transcriptional repressor binds with E-box (CACATG) motif of rat miR-128-2 coding upstream promoter and can impose a repressed state on miR-128-3p expression via Arpp21 intronic axis on chromosome 8. (h) Representative graph demonstrates the relative transcript abundance of miR-128-3p in amygdala of MDD subjects (n = 20) compared with nonpsychiatric control subjects (n = 22). Data are normalized using U6 gene expression values and represented as ±SEM. Level of significance was determined using independent-sample t test (df = 40, f = 13.47, t = 2.01, P = .04). (i) GAPDH normalized relative expression levels of WNT3A, WNT5B, DVL1, LEF1, and GSKIP analyzed in amygdala of MDD subjects. All data demonstrate the mean ± SEM (all genes were analyzed using 22 control subjects and 20 depressed subjects except WNT3A, control = 22 and MDD = 18). The level of significance was determined using independent-sample t test (WNT3A df = 38, f = 0.83, t = −1.75, P = .86; WNT5B df = 40, f = 0.45, t = −2.73, P = .01; DVL1 df = 40, f = 9.63, t = −2.28, P = .03; LEF1 df = 40, f = 0.57, t = −2.25, P = .03; and GSKIP df = 40, f = 0.10, t = −0.68, P = .49). Significance level is indicated with an asterisk sign (*P ≤0.05, **P ≤0.005).

Comment in

Similar articles

Cited by

References

    1. Andolina D, Di Segni M, Bisicchia E, D’Alessandro F, Cestari V, Ventura A, Concepcion C, Puglisi-Allegra S, Ventura R (2016) Effects of lack of microRNA-34 on the neural circuitry underlying the stress response and anxiety. Neuropharmacology 107:305–316. - PMC - PubMed
    1. Balakathiresan NS, Chandran R, Bhomia M, Jia M, Li H, Maheshwari RK (2014) Serum and amygdala microRNA signatures of posttraumatic stress: fear correlation and biomarker potential. J Psychiatr Res 57:65–73. - PubMed
    1. Belzeaux R, Bergon A, Jeanjean V, Loriod B, Formisano-Tréziny C, Verrier L, Loundou A, Baumstarck-Barrau K, Boyer L, Gall V, Gabert J, Nguyen C, Azorin JM, Naudin J, Ibrahim EC (2012) Responder and nonresponder patients exhibit different peripheral transcriptional signatures during major depressive episode. Transl Psychiatry 2:e185. - PMC - PubMed
    1. Bocchio-Chiavetto L, Maffioletti E, Bettinsoli P, Giovannini C, Bignotti S, Tardito D, Corrada D, Milanesi L, Gennarelli M (2013) Blood microRNA changes in depressed patients during antidepressant treatment. Eur Neuropsychopharmacol 23:602–611. - PubMed
    1. Chou HY, Howng SL, Cheng TS, Hsiao YL, Lieu AS, Loh JK, Hwang SL, Lin CC, Hsu CM, Wang C, Lee CI, Lu PJ, Chou CK, Huang CY, Hong YR (2006) GSKIP is homologous to the Axin GSK3beta interaction domain and functions as a negative regulator of GSK3beta. Biochemistry 45:11379–11389. - PubMed

Publication types