

Dominant gut Prevotella copri in gastrectomised non-obese diabetic Goto-Kakizaki rats improves glucose homeostasis through enhanced FXR signalling
- PMID: 32173762
- PMCID: PMC7228998
- DOI: 10.1007/s00125-020-05122-7
Dominant gut Prevotella copri in gastrectomised non-obese diabetic Goto-Kakizaki rats improves glucose homeostasis through enhanced FXR signalling
Abstract
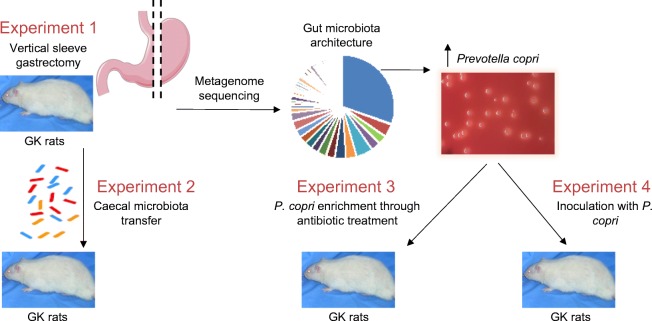
Aims/hypothesis: Drug and surgical-based therapies in type 2 diabetes are associated with altered gut microbiota architecture. Here we investigated the role of the gut microbiome in improved glucose homeostasis following bariatric surgery.
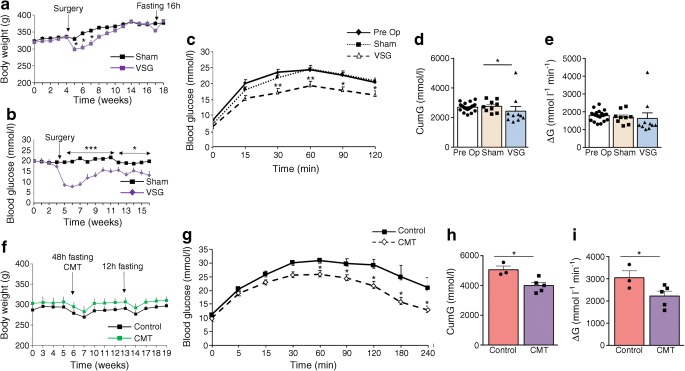
Methods: We carried out gut microbiome analyses in gastrectomised (by vertical sleeve gastrectomy [VSG]) rats of the Goto-Kakizaki (GK) non-obese model of spontaneously occurring type 2 diabetes, followed by physiological studies in the GK rat.
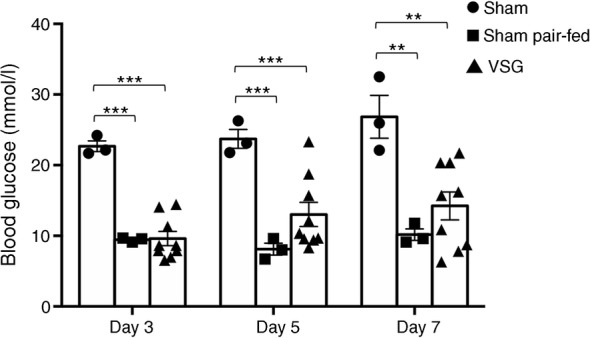
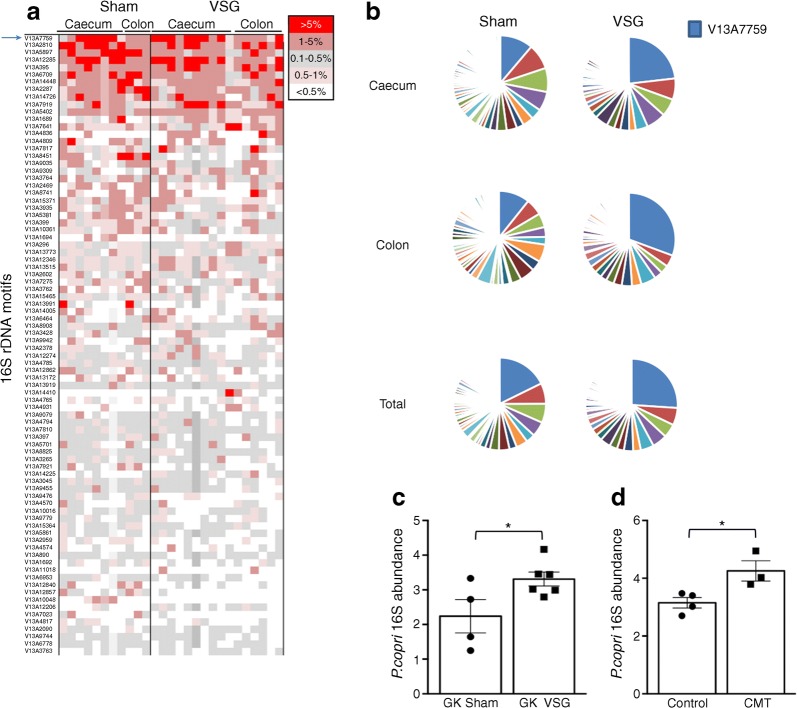
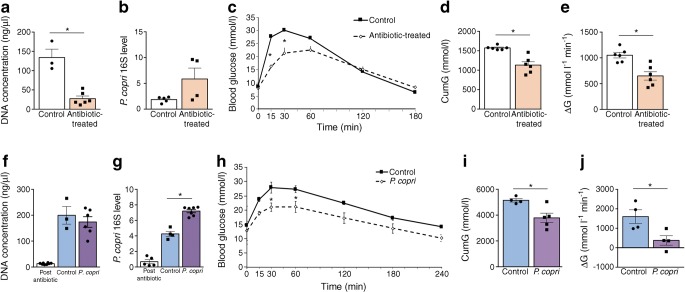
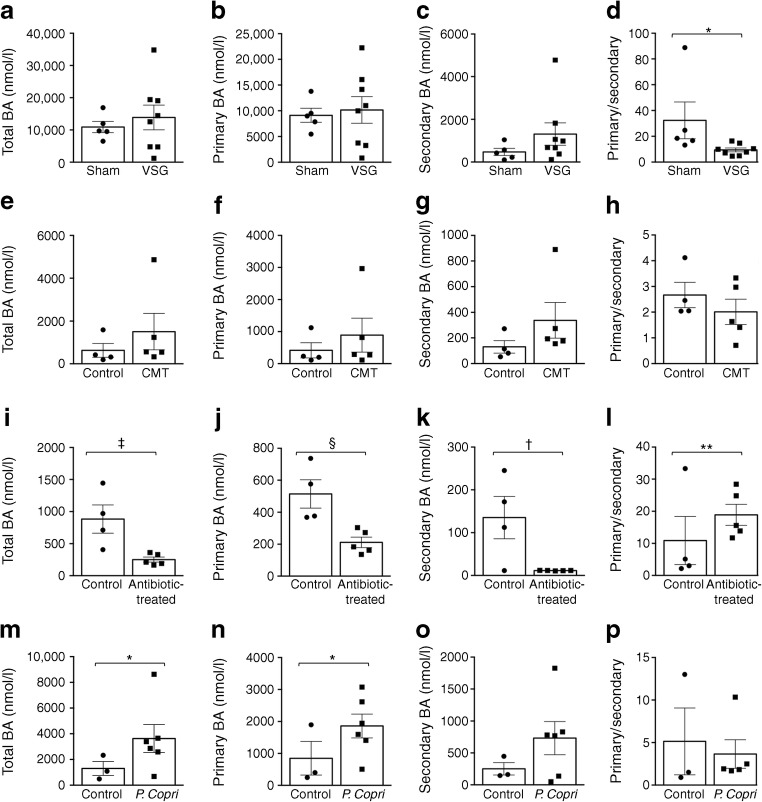
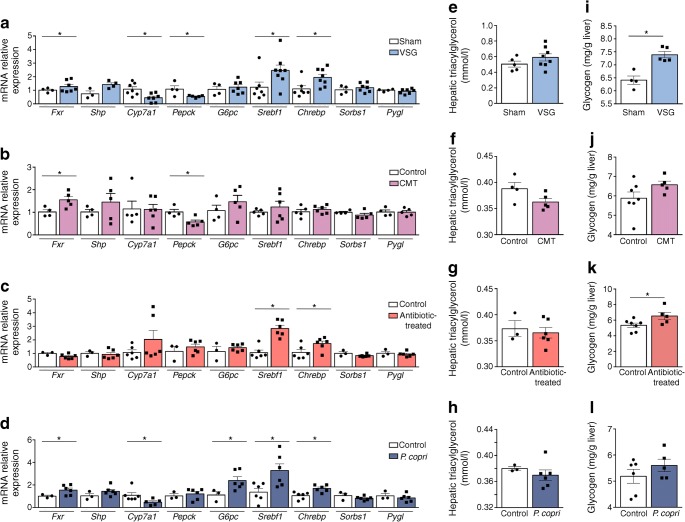
Results: VSG in the GK rat led to permanent improvement of glucose tolerance associated with minor changes in the gut microbiome, mostly characterised by significant enrichment of caecal Prevotella copri. Gut microbiota enrichment with P. copri in GK rats through permissive antibiotic treatment, inoculation of gut microbiota isolated from gastrectomised GK rats, and direct inoculation of P. copri, resulted in significant improvement of glucose tolerance, independent of changes in body weight. Plasma bile acids were increased in GK rats following inoculation with P. copri and P. copri-enriched microbiota from VSG-treated rats; the inoculated GK rats then showed increased liver glycogen and upregulated expression of Fxr (also known as Nr1h4), Srebf1c, Chrebp (also known as Mlxipl) and Il10 and downregulated expression of Cyp7a1.
Conclusions: Our data underline the impact of intestinal P. copri on improved glucose homeostasis through enhanced bile acid metabolism and farnesoid X receptor (FXR) signalling, which may represent a promising opportunity for novel type 2 diabetes therapeutics.
Keywords: 16S rDNA; Bile acids; Goto–Kakizaki rat; Microbiome; Type 2 diabetes.
Figures
Similar articles
-
Type 2 diabetes mitigation in the diabetic Goto-Kakizaki rat by elevated bile acids following a common-bile-duct surgery.Metabolism. 2016 Feb;65(2):78-88. doi: 10.1016/j.metabol.2015.09.014. Epub 2015 Sep 26. Metabolism. 2016. PMID: 26773931
-
Prevotella copri ameliorates cholestasis and liver fibrosis in primary sclerosing cholangitis by enhancing the FXR signalling pathway.Biochim Biophys Acta Mol Basis Dis. 2022 Mar 1;1868(3):166320. doi: 10.1016/j.bbadis.2021.166320. Epub 2021 Dec 10. Biochim Biophys Acta Mol Basis Dis. 2022. PMID: 34896545
-
Effect of sleeve gastrectomy on body weight, food intake, glucose tolerance, and metabolic hormone level in two different rat models: Goto-Kakizaki and diet-induced obese rat.J Surg Res. 2013 Nov;185(1):159-65. doi: 10.1016/j.jss.2013.05.019. Epub 2013 May 28. J Surg Res. 2013. PMID: 23746960
-
Ménage-à-trois of bariatric surgery, bile acids and the gut microbiome.World J Diabetes. 2015 Apr 15;6(3):367-70. doi: 10.4239/wjd.v6.i3.367. World J Diabetes. 2015. PMID: 25897347 Free PMC article. Review.
-
A short review on the features of the non-obese diabetic Goto-Kakizaki rat intestine.Braz J Med Biol Res. 2022 Aug 22;55:e11910. doi: 10.1590/1414-431X2022e11910. eCollection 2022. Braz J Med Biol Res. 2022. PMID: 36000611 Free PMC article. Review.
Cited by
-
Population-level gut microbiome and its associations with environmental factors and metabolic disorders in Southwest China.NPJ Biofilms Microbiomes. 2025 Feb 4;11(1):24. doi: 10.1038/s41522-025-00661-6. NPJ Biofilms Microbiomes. 2025. PMID: 39905038 Free PMC article.
-
New mechanistic insights of anti-obesity by sleeve gastrectomy-altered gut microbiota and lipid metabolism.Front Endocrinol (Lausanne). 2024 Feb 2;15:1338147. doi: 10.3389/fendo.2024.1338147. eCollection 2024. Front Endocrinol (Lausanne). 2024. PMID: 38375198 Free PMC article.
-
Non/Low-Caloric Artificial Sweeteners and Gut Microbiome: From Perturbed Species to Mechanisms.Metabolites. 2024 Oct 11;14(10):544. doi: 10.3390/metabo14100544. Metabolites. 2024. PMID: 39452925 Free PMC article. Review.
-
Entamoeba muris mitigates metabolic consequences of high-fat diet in mice.Gut Microbes. 2024 Jan-Dec;16(1):2409210. doi: 10.1080/19490976.2024.2409210. Epub 2024 Oct 13. Gut Microbes. 2024. PMID: 39396247 Free PMC article.
-
Prevotella and succinate treatments altered gut microbiota, increased laying performance, and suppressed hepatic lipid accumulation in laying hens.J Anim Sci Biotechnol. 2024 Feb 18;15(1):26. doi: 10.1186/s40104-023-00975-5. J Anim Sci Biotechnol. 2024. PMID: 38369510 Free PMC article.
References
Publication types
MeSH terms
Substances
Supplementary concepts
Grants and funding
LinkOut - more resources
Full Text Sources
Medical
Molecular Biology Databases
