

Flow Cytometric Minimal Residual Disease Analysis in Acute Leukemia: Current Status
- PMID: 32174688
- PMCID: PMC7042470
- DOI: 10.1007/s12288-019-01118-5
Flow Cytometric Minimal Residual Disease Analysis in Acute Leukemia: Current Status
Abstract
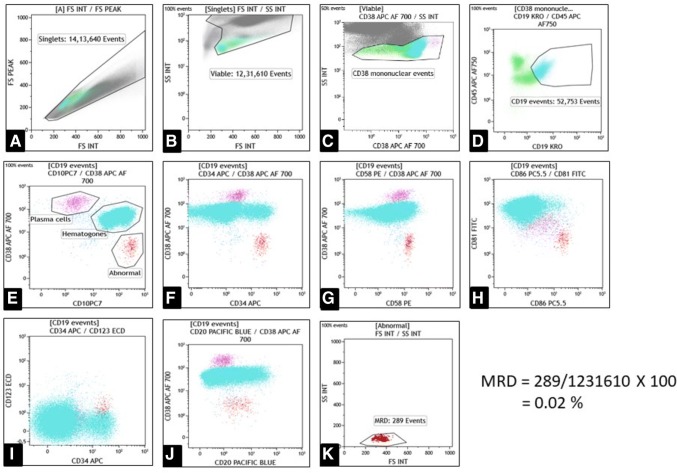
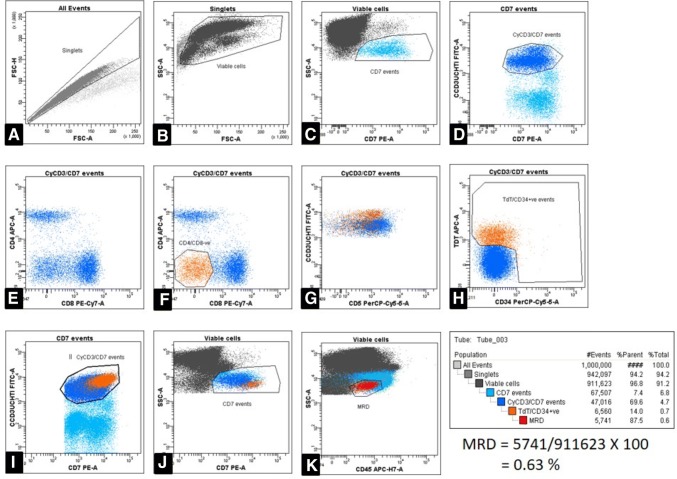
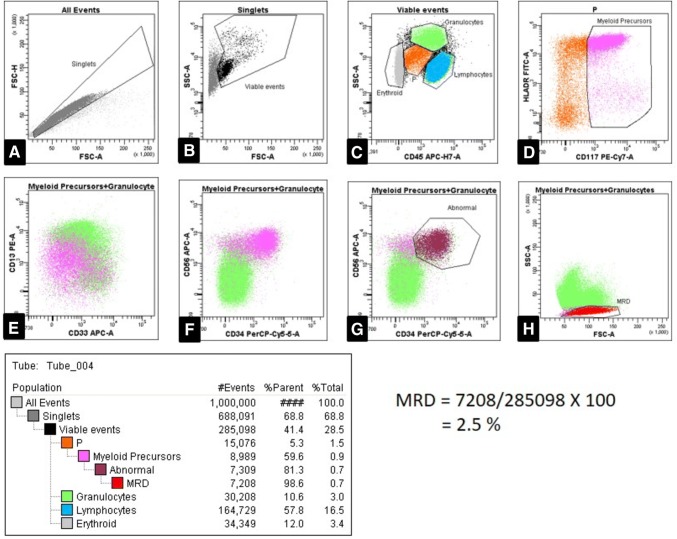
Minimal residual disease (MRD) analysis for patients of acute leukemia has evolved as a significant prognostic factor. Based on the MRD results, the cases are risk-stratified after induction chemotherapy, and an alteration in further management is made to yield maximal therapeutic benefits. The two primary methodologies for MRD detection are multi-parameter flow cytometry (MFC) and polymerase chain reaction. MFC identifies the MRD based on characteristic 'leukemia-associated immunophenotypes' on the residual leukemia cells. MRD analysis by MFC is most frequently done at the post-induction stage of treatment and often can achieve a sensitivity of detecting one leukemic cell in 10,000 normal cells, or even higher at times. This review outlines the technical aspects and provides inputs on standard antibody panels used for MRD detection in B-, T-lineage acute lymphoblastic leukemias, and acute myeloid leukemia.
Keywords: Immunophenotyping; Minimal residual disease (MRD); Multi-parameter flow cytometry (MFC).
© Indian Society of Hematology and Blood Transfusion 2019.
Conflict of interest statement
Conflict of interestThe authors declare that they have no conflict of interest.
Figures
Similar articles
-
The applicability of multiparameter flow cytometry for the detection of minimal residual disease using different-from-normal panels to predict relapse in patients with acute myeloid leukemia after allogeneic transplantation.Int J Lab Hematol. 2019 Oct;41(5):607-614. doi: 10.1111/ijlh.13070. Epub 2019 Jun 4. Int J Lab Hematol. 2019. PMID: 31162830
-
Monitoring of minimal residual disease in acute leukemia by multiparametric flow cytometry.Neoplasma. 2014;61(2):119-27. doi: 10.4149/neo_2014_017. Neoplasma. 2014. PMID: 24299307 Review.
-
Methodological aspects of minimal residual disease assessment by flow cytometry in acute lymphoblastic leukemia: A French multicenter study.Cytometry B Clin Cytom. 2015 Jan;88(1):21-9. doi: 10.1002/cyto.b.21195. Epub 2014 Nov 1. Cytometry B Clin Cytom. 2015. PMID: 25363877 Clinical Trial.
-
Minimal/Measurable Residual Disease Detection in Acute Leukemias by Multiparameter Flow Cytometry.Curr Hematol Malig Rep. 2018 Dec;13(6):455-466. doi: 10.1007/s11899-018-0479-1. Curr Hematol Malig Rep. 2018. PMID: 30446941 Review.
-
Minimal residual disease studies by flow cytometry in acute leukemia.Acta Haematol. 2004;112(1-2):8-15. doi: 10.1159/000077554. Acta Haematol. 2004. PMID: 15178999 Review.
Cited by
-
Correlation Study on HLA-DR and CD117 (c-Kit) Expressions: Its Prognosis and Treatment Response in Acute Myeloid Leukemia Patients.Pharmgenomics Pers Med. 2021 Mar 30;14:381-393. doi: 10.2147/PGPM.S268986. eCollection 2021. Pharmgenomics Pers Med. 2021. PMID: 33833549 Free PMC article.
-
Precision Isolation of Circulating Leukemia Cells in Chronic Myelogenous Leukemia Patients Using a Novel Microfluidic Device and Its Clinical Applications.Cancers (Basel). 2023 Dec 3;15(23):5696. doi: 10.3390/cancers15235696. Cancers (Basel). 2023. PMID: 38067399 Free PMC article.
References
-
- Borowitz MJ, Devidas M, Hunger SP, et al. Clinical significance of minimal residual disease in childhood acute lymphoblastic leukemia and its relationship to other prognostic factors: a Children’s Oncology Group study. Blood. 2008;111:5477–5485. doi: 10.1182/blood-2008-01-132837. - DOI - PMC - PubMed
Publication types
LinkOut - more resources
Full Text Sources