. 2020 Feb 10;16(7):1166-1179.
doi: 10.7150/ijbs.41293. eCollection 2020.

Potential Crosstalk between Liver and Extra-liver Organs in Mouse Models of Acute Liver Injury

Affiliations

Potential Crosstalk between Liver and Extra-liver Organs in Mouse Models of Acute Liver Injury

Yufan Zheng et al. Int J Biol Sci. .

Abstract

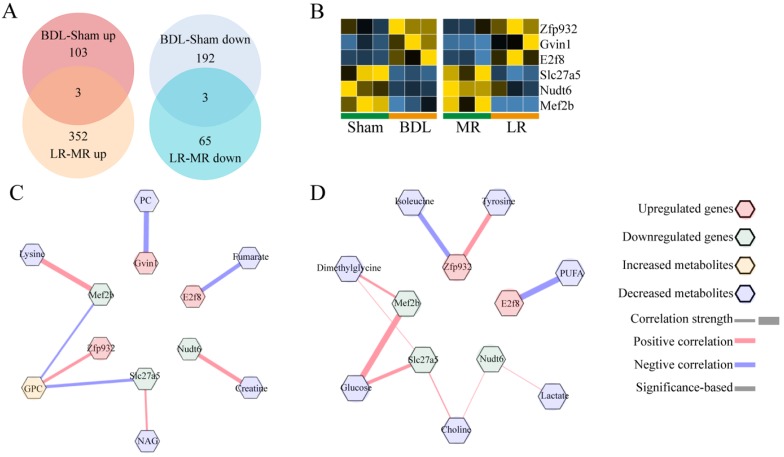
Carbon tetrachloride (CCl4), Concanavalin A (ConA), bile duct ligation (BDL), and liver resection (LR) are four types of commonly used mouse models of acute liver injury. However, these four models belong to different types of liver cell damage while their application situations are often confounded. In addition, the systematic changes of multiple extra-liver organs after acute liver injury and the crosstalk between liver and extra-liver organs remain unclear. Here, we aim to map the morphological, metabolomic and transcriptomic changes systematically after acute liver injury and search for the potential crosstalk between the liver and the extra-liver organs. Significant changes of transcriptome were observed in multiple extra-liver organs after different types of acute liver injury despite dramatic morphological damage only occurred in lung tissues of the ConA/BDL models and spleen tissues in the ConA model. Liver transcriptomic changes initiated the serum metabolomic alterations which correlated to transcriptomic variation in lung, kidney, and brain tissues of BDL and LR models. The potential crosstalk might lead to pulmonary damage and development of hepatorenal syndrome (HRS) and hepatic encephalopathy (HE) during liver injury. Serum derived from acute liver injury mice damaged alveolar epithelial cells and human podocytes in vitro. Our data indicated that different types of acute liver injury led to different transcriptomic changes within extra-liver organs. Integration of serum metabolomics and transcriptomics from multiple tissues can improve our understanding of acute liver injury and its effect on the other organs.

Keywords: acute liver injury; crosstalk; metabolomics; systematic change; transcriptomics.


Conflict of interest statement

Competing Interests: The authors have declared that no competing interest exists.

Figures

Figure 1
Figure 1
Experimental design of this study and the representative tissue section images of multiple organs in the 4 mice models of acute liver injury. (A) Illustration of the experimental design of this study. Liver, heart, lung, kidney, spleen, brain, and serum were collected 3 d after CCl4/oil injection, ConA/NS injection, BDL/Sham surgery, and 2 d after LR/MR. Mice in each treated group and its corresponding control group are from a single cohort of C57BL/6J mice. (B) Representative H&E staining of liver tissue sections from the 4 models of acute liver injury (n=3). Scale bar, 100 μm. (C) Representative H&E staining of heart tissue sections from the 4 models of acute liver injury (n=3). Scale bar, 100 μm. (D) Representative H&E staining of lung tissue sections from the 4 models of acute liver injury (n=3). Scale bar, 100 μm. (E) Representative H&E staining of kidney tissue sections from the 4 models of acute liver injury (n=3). Scale bar, 100 μm. (F) Representative H&E staining of spleen tissue sections from the 4 models of acute liver injury (n=3). Scale bar, 250 μm. (G) Representative H&E staining of brain tissue sections from the 4 models of acute liver injury (n=3). Scale bar, 100 μm. (CCl4, carbon tetrachloride. ConA, concanavalin A. BDL, bile duct ligation. MR, muscle resection. LR, liver resection.)
Figure 2
Figure 2
Tissue-specific transcriptomic profiling in the four mice models of acute liver injury. (A) Tissue-specific transcriptome heatmaps of the 4 mice models of acute liver injury. Rows reflect normalized relative expression of mRNAs (0-1). (B) The number of genes with significant change in expression (Foldchange>2 and P-value<0.05) in each organ from the 4 models of liver injury. (CCl4, carbon tetrachloride. NS, normal saline. ConA, concanavalin A. BDL, bile duct ligation. MR, muscle resection. LR, liver resection.)
Figure 3
Figure 3
The serum NMR metabolome in the four acute liver injury mice models. (A) Serum metabolome heatmaps of the 4 models of acute liver injury. Significance was indicated on the right side of each heatmap. (B) Correlation heatmap between the 4 models. Correlation coefficient rho is shown as red (positive) or blue (negative). Pearson coefficient is marked in the figure. Correlations between metabolites in CCl4 (C), ConA (D), BDL (E), and LR (F) models are shown. Pearson coefficient with an absolute value greater than 0.75 was displayed. Each correlation was shown as a line across metabolites. The width of the line indicated the correlation strength. Positive correlation was shown as red lines and negative correlation as blue lines. (G) The ratio of SFA/UFA in BDL/Sham and LR/MR models. *P < 0.05, **P<0.01, ***P<0.001, ****P<0.0001 by unpaired T test (Two-sided). (CCl4, carbon tetrachloride. NS, normal saline. ConA, concanavalin A. BDL, bile duct ligation. MR, muscle resection. LR, liver resection. 3-HB, 3-hydroxybutytrate. SFA, saturated fatty acid. UFA, unsaturated fatty acid. MUFA, monounsaturated fatty acid. PUFA, polyunsaturated fatty acid. GPC, glycerophosphorylcholine. PC, phosphorylcholine. TMAO, trimetlylamine oxide. NAG, N-acetylated glycoproteins. OAG, O-acetylated glycoproteins.)
Figure 4
Figure 4
Potential crosstalk between liver transcriptome and serum metabolome. The biological process based-network for genes changed in liver tissues and metabolites changed in serum revealed the effect of primary acute liver injury on the secondary changes in serum metabolites. (A) Potential liver genes-serum metabolites crosstalk network for BDL group. (B) Potential liver genes-serum metabolites crosstalk network for LR group. (3-HB, 3-hydroxybutytrate. SFA, saturated fatty acid. UFA, unsaturated fatty acid. MUFA, monounsaturated fatty acid. PUFA, polyunsaturated fatty acid. GPC, glycerophosphorylcholine. PC, phosphorylcholine. TMAO, trimetlylamine oxide. NAG, N-acetylated glycoproteins. OAG, O-acetylated glycoproteins.)
Figure 5
Figure 5
The potential mechanism of pulmonary damage after BDL-induced acute liver injury. (A) Representative H&E staining of lung tissue sections from the BDL mice. Scar bar on the left, 1 mm. Scar bar on the right, 100 μm. (B) Inpiratory and expiratory resistance in BDL mice. (C) Pulmonary compliance in BDL mice. GSEA for pulmonary transcriptome showed ECM receptor interaction (D) and WNT signaling pathway (E) were upregulated. Correlation heatmaps showed correlations between metabolites changed in BDL serum and genes enriched in ECM receptor interaction (F) and WNT signaling pathway (G) indicated the potential crosstalk between serum metabolites and pulmonary transcriptome after BDL-induced liver injury. Correlations with an absolute value greater than 0.9 were colored in heatmap. (H) Viability of MLE-12 cells treated with serum derived from BDL and Sham mice. (I) Apoptotic cells detection by flow cytometry. Left, representative flow cytometry images. Right, statistic histogram images of died cells. (J) Itgb1 expression of MLE-12 cells treated with serum derived from BDL and Sham mice detected by QPCR. (3-HB, 3-hydroxybutytrate. SFA, saturated fatty acid. UFA, unsaturated fatty acid. MUFA, monounsaturated fatty acid. PUFA, polyunsaturated fatty acid. GPC, glycerophosphorylcholine. PC, phosphorylcholine. TMAO, trimetlylamine oxide. NAG, N-acetylated glycoproteins.)
Figure 6
Figure 6
The effects of BDL and LR on the renal transcriptomics. (A-D) Renal function testing through serum biochemical testing. (A) SUN in Sham and BDL mice. (B) SCre in Sham and BDL mice. (C) SUN in MR and LR mice. (D) SCre in MR and LR mice. (E) Venn plots for up-regulated and down-regulated genes in renal transcriptome of BDL and LR models. (F) Heatmaps for co-changed genes in renal transcriptome of BDL and LR models. (G) Kegg pathway enrichment for co-upregulated genes in renal transcriptome of BDL and LR models. GSEA plots in renal transcriptome of LR showed focal adhesion (H) and ECM receptor interaction (I) were upregulated. (J) Quantitative-PCR validation of expression changes of Esm1, Hic and Itgb7 in LR models. (K) Quantitative-PCR validation of expression changes of Caps2 and Mup3 in LR models. (L) Correlation between co-changed genes in renal transcriptome and serum changed metabolites in BDL models. (M) Correlation between co-changed genes in renal transcriptome and serum changed metabolites in LR models. Pearson coefficient with an absolute value greater than 0.95 was displayed. Up-regulated genes were shown as red terms and down-regulated genes were shown as green terms. Increased metabolites were shown as yellow terms and decreased metabolites were shown as blue terms. Each correlation was displayed as a line across genes and metabolites. The width of the line indicated the correlation strength. Positive correlation was shown as red lines and negative correlation was shown as blue lines. (N) Viability of human podocytes treated with serum derived from LR and MR mice. (O) Apoptotic cells detection by flow cytometry. Left, representative flow cytometry images. Right, statistic histogram images of early apoptotic cells, late apoptotic cells, and died cells. (P) MYO1F, TNXB, ITGAL, and SNCA expression of human podocytes treated with serum derived from LR and MR mice detected by QPCR. (SUN, serum urea nitrogen. SCre, serum creatinine. CCl4, carbon tetrachloride. NS, normal saline. ConA, concanavalin A. BDL, bile duct ligation. MR, muscle resection. LR, liver resection. 3-HB, 3-hydroxybutytrate. SFA, saturated fatty acid. UFA, unsaturated fatty acid. MUFA, monounsaturated fatty acid. PUFA, polyunsaturated fatty acid. GPC, glycerophosphorylcholine. PC, phosphorylcholine. TMAO, trimetlylamine oxide. NAG, N-acetylated glycoproteins. OAG, O-acetylated glycoproteins.)
Figure 7
Figure 7
The effects of BDL and LR on the brain transcriptomics. (A) Venn plots for changed genes in brain transcriptome of BDL and LR models. (B) Heatmaps for co-changed genes in renal transcriptome of BDL and LR models. (C) Correlation between co-changed genes in brain transcriptome and changed serum metabolites in BDL models. (D) Correlation between co-changed genes in brain transcriptome and changed serum metabolites in LR models. Pearson coefficient with an absolute value greater than 0.95 was displayed. Up-regulated genes were shown as red terms and down-regulated genes were shown as green terms. Increased metabolites were shown as yellow terms and decreased metabolites were shown as blue terms. Each correlation was displayed as a line across genes and metabolites. The width of the line indicated the correlation strength. Positive correlation was shown as red lines and negative correlation was shown as blue lines.

Similar articles

Cited by

References

    1. Trefts E, Gannon M, Wasserman DH. The liver. Curr Biol. 2017;27:R1147–r51. - PMC - PubMed
    1. Juza RM, Pauli EM. Clinical and surgical anatomy of the liver: a review for clinicians. Clin Anat. 2014;27:764–9. - PubMed
    1. Hu C, Li L. Improvement of mesenchymal stromal cells and their derivatives for treating acute liver failure. Journal of Molecular Medicine. 2019;97:1065–84. - PubMed
    1. Bernal W, Auzinger G, Dhawan A, Wendon J. Acute liver failure. Lancet. 2010;376:190–201. - PubMed
    1. Thawley V. Acute Liver Injury and Failure. Veterinary Clinics of North America: Small Animal Practice. 2017;47:617–30. - PubMed

Publication types