

A Novel Microglia-Specific Transcriptional Signature Correlates With Behavioral Deficits in Neuropsychiatric Lupus
- PMID: 32174913
- PMCID: PMC7055359
- DOI: 10.3389/fimmu.2020.00230
A Novel Microglia-Specific Transcriptional Signature Correlates With Behavioral Deficits in Neuropsychiatric Lupus
Abstract
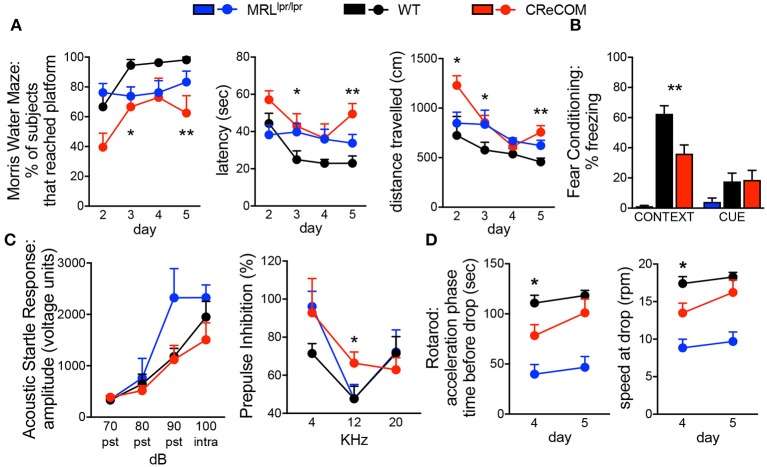
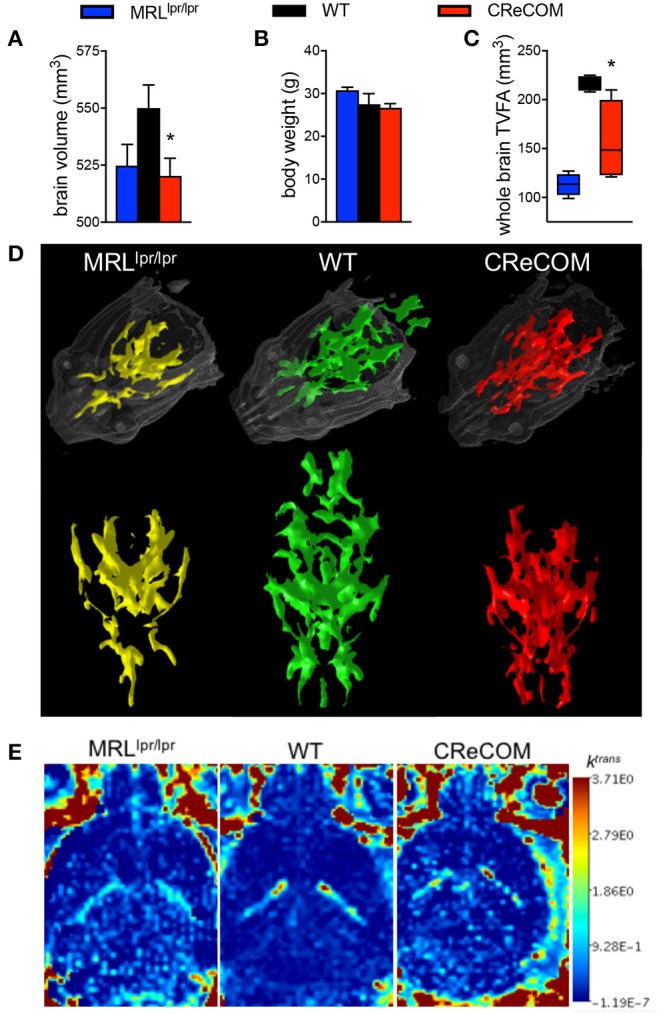
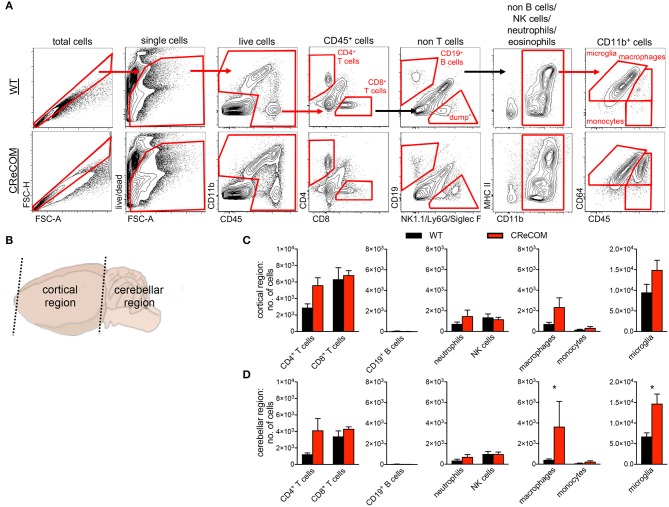
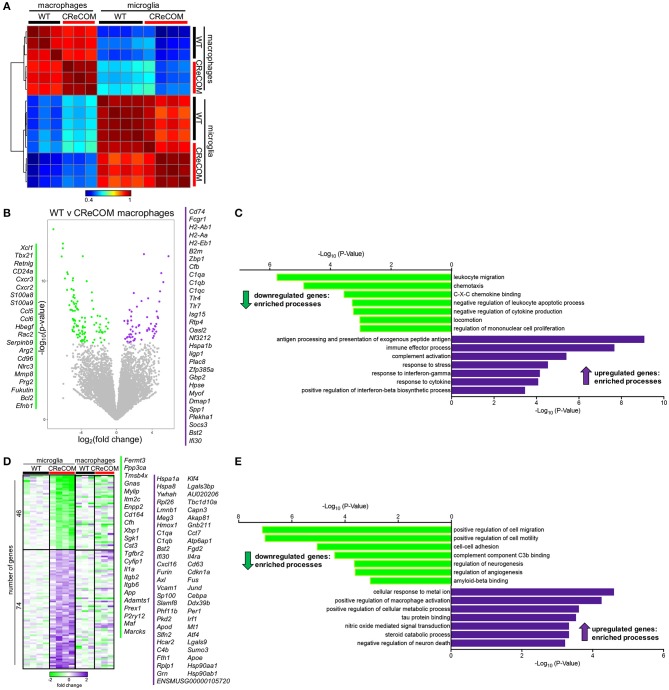
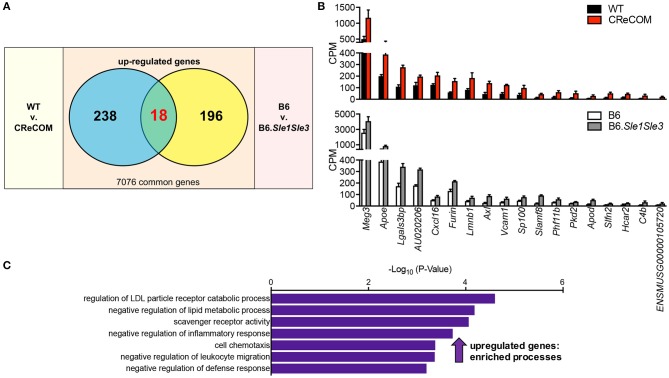
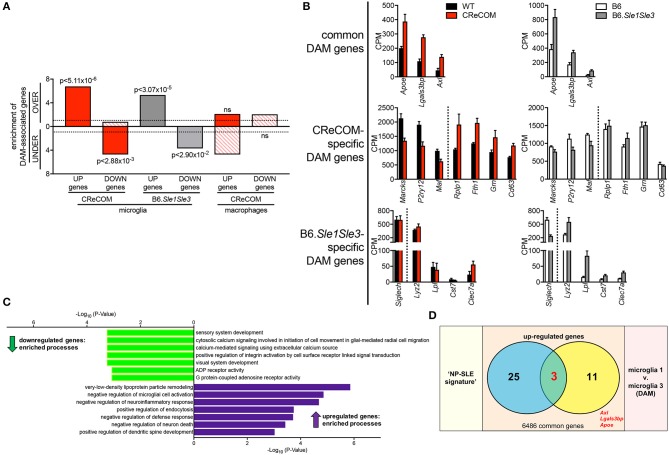
Neuropsychiatric symptoms of systemic lupus erythematosus (NP-SLE) affect over one-half of SLE patients, yet underlying mechanisms remain largely unknown. We demonstrate that SLE-prone mice (CReCOM) develop NP-SLE, including behavioral deficits prior to systemic autoimmunity, reduced brain volumes, decreased vascular integrity, and brain-infiltrating leukocytes. NP-SLE microglia exhibit numerical expansion, increased synaptic uptake, and a more metabolically active phenotype. Microglia from multiple SLE-prone models express a "NP-SLE signature" unrelated to type I interferon. Rather, the signature is associated with lipid metabolism, scavenger receptor activity and downregulation of inflammatory and chemotaxis processes, suggesting a more regulatory, anti-inflammatory profile. NP-SLE microglia also express genes associated with disease-associated microglia (DAM), a subset of microglia thought to be instrumental in neurodegenerative diseases. Further, expression of "NP-SLE" and "DAM" signatures correlate with the severity of behavioral deficits in young SLE-prone mice prior to overt systemic disease. Our data are the first to demonstrate the predictive value of our newly identified microglia-specific "NP-SLE" and "DAM" signatures as a surrogate for NP-SLE clinical outcomes and suggests that microglia-intrinsic defects precede contributions from systemic SLE for neuropsychiatric manifestations.
Keywords: DAM; NP-SLE; SLE; behavior; interferon; lupus; microglia.
Copyright © 2020 Makinde, Winter, Procissi, Mike, Stock, Kando, Gadhvi, Droho, Bloomfield, Dominguez, Mayr, Lavine, Putterman and Cuda.
Figures

Similar articles
-
Hippocampal damage in mouse and human forms of systemic autoimmune disease.Hippocampus. 2004;14(5):649-61. doi: 10.1002/hipo.10205. Hippocampus. 2004. PMID: 15301441 Free PMC article.
-
Unique primed status of microglia under the systemic autoimmune condition of lupus-prone mice.Arthritis Res Ther. 2019 Dec 30;21(1):303. doi: 10.1186/s13075-019-2067-8. Arthritis Res Ther. 2019. PMID: 31888754 Free PMC article.
-
Neuropsychiatric Systemic Lupus Erythematosus Is Dependent on Sphingosine-1-Phosphate Signaling.Front Immunol. 2018 Sep 26;9:2189. doi: 10.3389/fimmu.2018.02189. eCollection 2018. Front Immunol. 2018. PMID: 30319641 Free PMC article.
-
The MRL/lpr mouse strain as a model for neuropsychiatric systemic lupus erythematosus.J Biomed Biotechnol. 2011;2011:207504. doi: 10.1155/2011/207504. Epub 2011 Feb 10. J Biomed Biotechnol. 2011. PMID: 21331367 Free PMC article. Review.
-
Neuropsychiatric systemic lupus erythematosus and cognitive dysfunction: the MRL-lpr mouse strain as a model.Autoimmun Rev. 2014 Sep;13(9):963-73. doi: 10.1016/j.autrev.2014.08.015. Epub 2014 Aug 23. Autoimmun Rev. 2014. PMID: 25183233 Review.
Cited by
-
Centrally Acting Angiotensin-Converting Enzyme Inhibitor Suppresses Type I Interferon Responses and Decreases Inflammation in the Periphery and the CNS in Lupus-Prone Mice.Front Immunol. 2020 Sep 15;11:573677. doi: 10.3389/fimmu.2020.573677. eCollection 2020. Front Immunol. 2020. PMID: 33042154 Free PMC article.
-
The roles of microglia and astrocytes in phagocytosis and myelination: Insights from the cuprizone model of multiple sclerosis.Glia. 2022 Jul;70(7):1215-1250. doi: 10.1002/glia.24148. Epub 2022 Feb 2. Glia. 2022. PMID: 35107839 Free PMC article. Review.
-
Lupus autoantibodies initiate neuroinflammation sustained by continuous HMGB1:RAGE signaling and reversed by increased LAIR-1 expression.Nat Immunol. 2024 Apr;25(4):671-681. doi: 10.1038/s41590-024-01772-6. Epub 2024 Mar 6. Nat Immunol. 2024. PMID: 38448779 Free PMC article.
-
Mitochondrial impairment and repair in the pathogenesis of systemic lupus erythematosus.Front Immunol. 2022 Jul 25;13:929520. doi: 10.3389/fimmu.2022.929520. eCollection 2022. Front Immunol. 2022. PMID: 35958572 Free PMC article. Review.
-
Retinal microglia express more MHC class I and promote greater T-cell-driven inflammation than brain microglia.Front Immunol. 2024 May 10;15:1399989. doi: 10.3389/fimmu.2024.1399989. eCollection 2024. Front Immunol. 2024. PMID: 38799448 Free PMC article.
References
Publication types
MeSH terms
Grants and funding
LinkOut - more resources
Full Text Sources
Medical
Molecular Biology Databases
Miscellaneous