. 2020 Feb 26:11:139.
doi: 10.3389/fpls.2020.00139. eCollection 2020.

Characterization of the bZIP Transcription Factor Family in Pepper (Capsicum annuum L.): CabZIP25 Positively Modulates the Salt Tolerance

Affiliations

Characterization of the bZIP Transcription Factor Family in Pepper (Capsicum annuum L.): CabZIP25 Positively Modulates the Salt Tolerance

Wen-Xian Gai et al. Front Plant Sci. .

Abstract

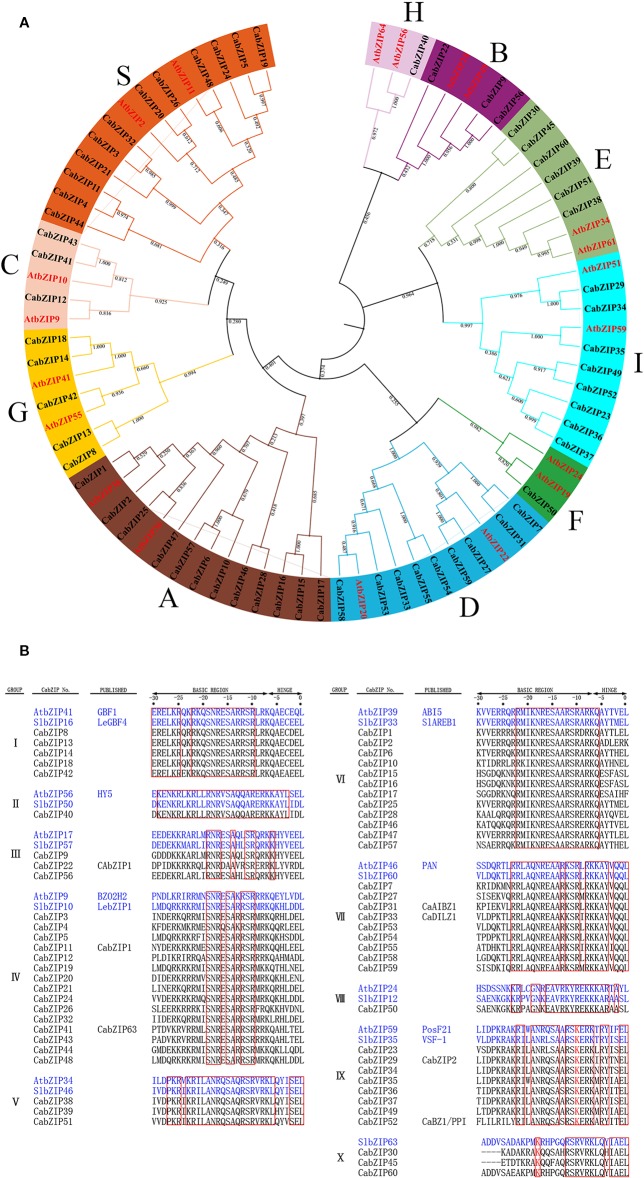
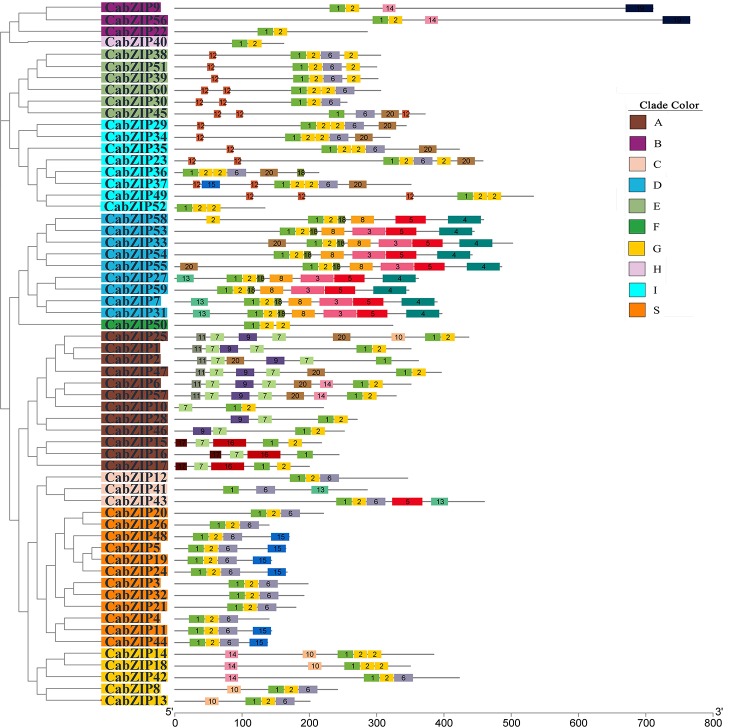
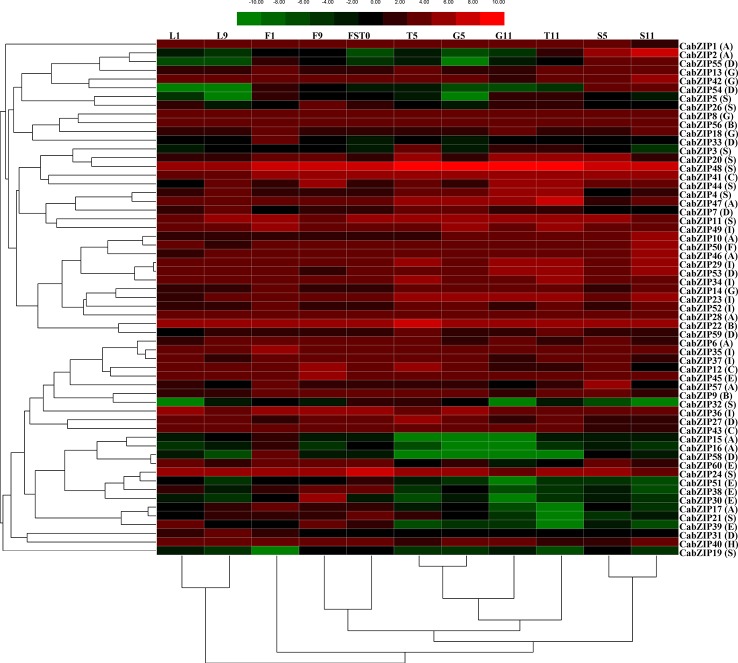
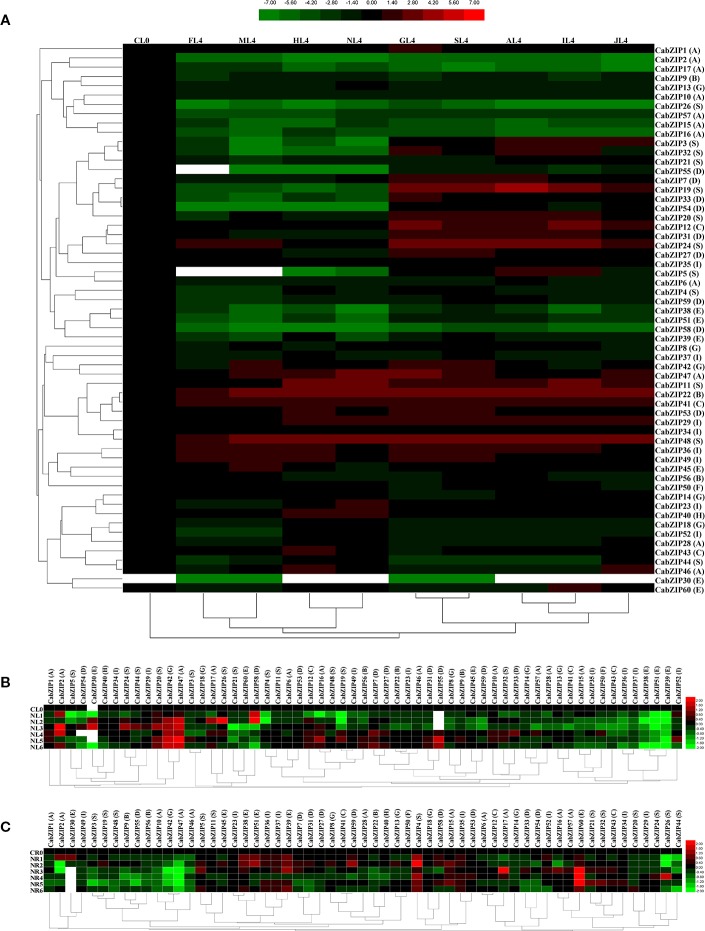
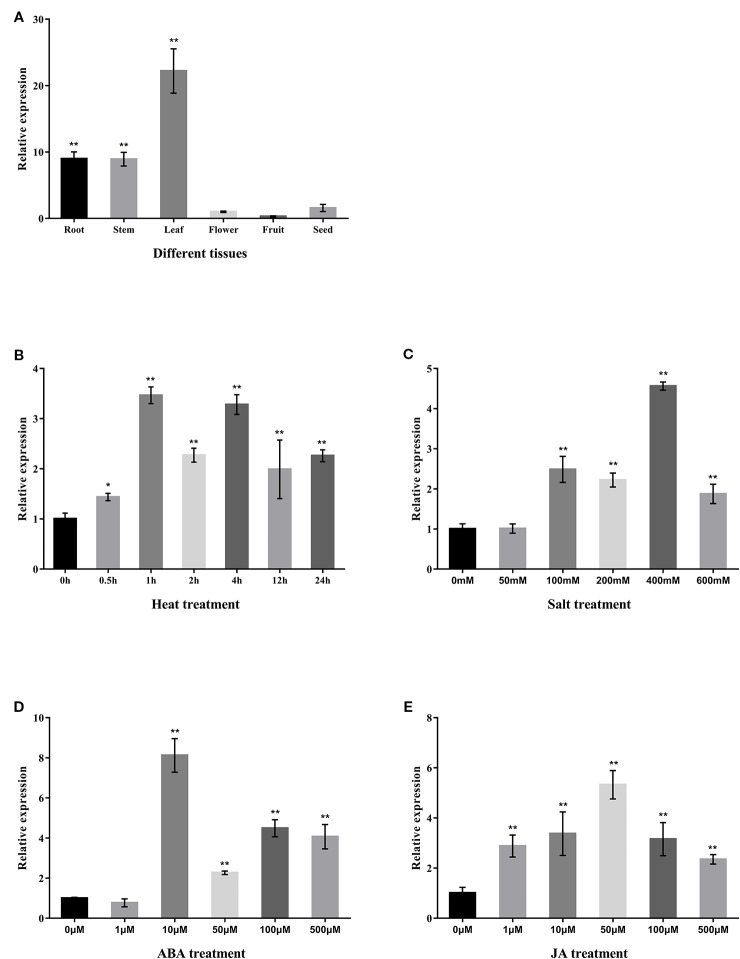
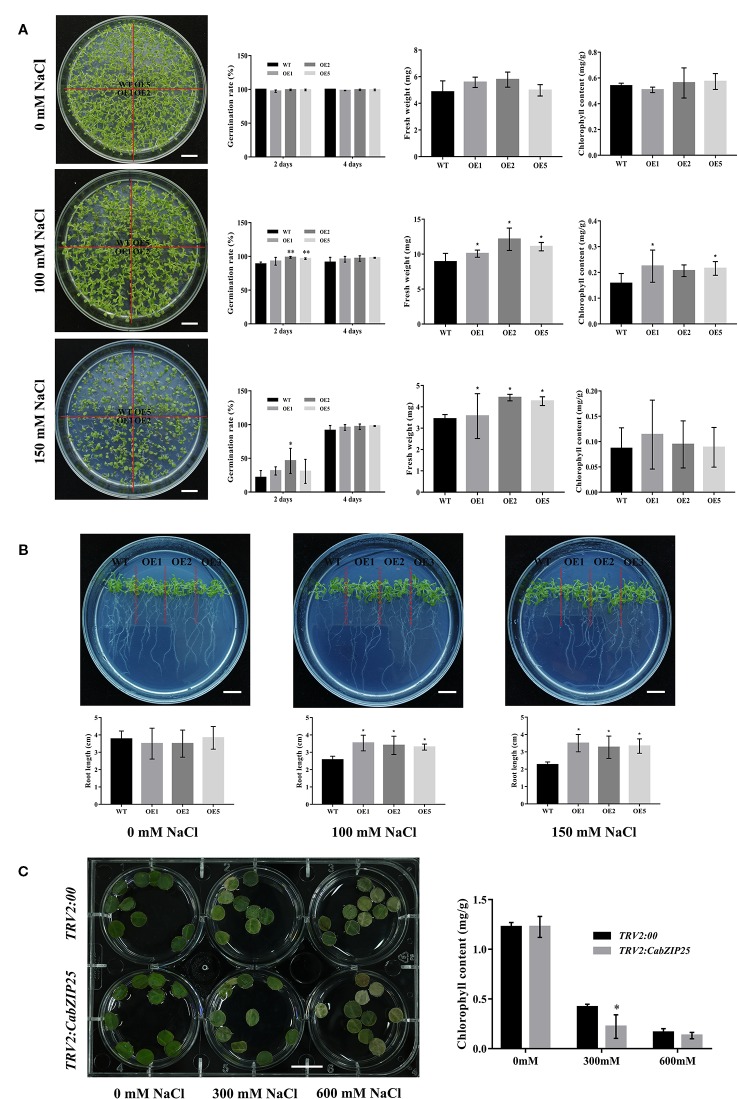
The basic leucine zipper (bZIP) proteins compose a family of transcription factors (TFs), which play a crucial role in plant growth, development, and abiotic and biotic stress responses. However, no comprehensive analysis of bZIP family has been reported in pepper (Capsicum annuum L.). In this study, we identified and characterized 60 bZIP TF-encoding genes from two pepper genomes. These genes were divided into 10 groups based on their phylogenetic relationships with bZIP genes from Arabidopsis. Six introns/exons structural patterns within the basic and hinge regions and the conserved motifs were identified among all the pepper bZIP proteins, on the basis of which, we classify them into different subfamilies. Based on the transcriptomic data of Zunla-1 genome, expression analyses of 59 pepper bZIP genes (not including CabZIP25 of CM334 genome), indicated that the pepper bZIP genes were differentially expressed in the pepper tissues and developmental stages, and many of the pepper bZIP genes might be involved in responses to various abiotic stresses and phytohormones. Further, gene expression analysis, using quantitative real-time PCR (qRT-PCR), showed that the CabZIP25 gene was expressed at relatively higher levels in vegetative tissues, and was strongly induced by abiotic stresses and phytohormones. In comparing with wild type Arabidopsis, germination rate, fresh weight, chlorophyll content, and root lengths increased in the CabZIP25-overexpressing Arabidopsis under salt stress. Additionally, CabZIP25-silenced pepper showed lower chlorophyll content than the control plants under salt stress. These results suggested that CabZIP25 improved salt tolerance in plants. Taken together, our results provide new opportunities for the functional characterization of bZIP TFs in pepper.

Keywords: CabZIP family; CabZIP25; Pepper Genome Databases; abiotic stress; pepper (Capsicum annuum L.); salt tolerance.


Figures

Figure 1
Figure 1
Phylogenetic relationship of pepper and Arabidopsis bZIP proteins and alignment of basic and hinge regions of the CabZIP proteins. (A) The protein sequences of the bZIPs, 60 from pepper (CabZIPs) and 20 from Arabidopsis (AtbZIPs, red color), were aligned by MUSCLE at MEGA-X and the phylogenetic tree was constructed by NJ method. The proteins were clustered into 10 groups, which were assigned a different color. (B) Alignment of basic and hinge regions of 60 CabZIP proteins. The CabZIP proteins are classified into 10 groups. Conserved amino acids are boxed in red. Two already characterized plant bZIP proteins in Arabidopsis and tomato are shown as references. The first Leu of the Leu zipper is regarded as 0. The different amino acid residue K belonging to group X are colored at -18 positions.
Figure 2
Figure 2
Distribution of the conserved motifs identified in 60 CabZIP proteins. The protein structures of CabZIPs based on the predicted conserved motifs by MEME are given corresponding to the phylogenetic tree of the CabZIP proteins. The phylogenetic relationship and grouping are exactly the same as in Figure 1 . Each motif is represented by colored box with numbers 1 to 20. The details of conserved motifs are listed in Supplementary Table S3 and another sketch map of conserved motifs is shown in Supplementary Table S4 .
Figure 3
Figure 3
Expression patterns of 59 CabZIP genes differentially expressed in six tissues. The image summarized the organ-specific expression profiles of 59 CabZIPs in pepper. The expression levels are normalized using log2. The color scale representing expression values is shown at the top. Green indicates low expression values, black indicates intermediate expression values and red indicates high expression values. Genes and the tissues of different developmental stages are clustered according to their expression profiles. Group numbers were labeled after each gene name. The L1 and L9 denote leaf collected at 2 and 60 days after emergence, respectively. The F1 and F9 denotes floral bud collected at smallest and biggest size, respectively. The FST0 denotes fruit collected on 3 days after flowering (DAF). The T5 and T11 denotes placenta collected on 30 and 60 DAF, respectively. The S5 and S11 denotes seed collected on 30 and 60 DAF, respectively. The G5 and G11 denotes pericarp collected on 30 and 60 DAF, respectively.
Figure 4
Figure 4
Patterns of 59 CabZIP genes differentially expressed during abiotic stress and phytohormone treatments. (A) Expression patterns of CabZIP genes in leaf at 6 h post treatment. CL0, FL4, ML4, HL4, NL4, GL4, SL4, AL4, IL4, and JL4 represents the control, cold, mannitol, heat, salt, GA3, SA, ABA, IAA, and JA treatment, respectively. (B, C) Expression patterns of CabZIP genes in leaf (B) or root (C) under salt stress. CL0/CR0, NL1/NR1, NL2/NR2, NL3/NR3, NL4/NR4, NL5/NR5, and NL6/NR6 represents the expression levels of CabZIP genes in leaf/root at 0, 0.5, 1, 3, 6, 12, and 24 h post treatment, respectively. Log2 (treated/control) ratio values represents the fold change of the gene expression. The color scale is shown at the top (A) or right (B, C). Green indicates low expression values; black indicates intermediate expression values and red indicates high expression values. The empty values were indicated as white. Group numbers are labeled after each gene name. See Supplementary Table S5 for detailed transcriptome data.
Figure 5
Figure 5
CabZIP25 expression patterns (A) in different pepper tissues, under (B) heat stress induction at 45°C, (C) NaCl root-immersing, (D) ABA spraying, and (E) JA spraying. The relative expression levels of CabZIP25 are normalized to that of CaUBI3. Error bars represent SDs for three replicates, and each replicate contains six pepper seedlings. Data are shown as means ± SD. The asterisks on the bars indicate significant differences from the CabZIP25 expression in flower (A) or control treatments (BE). *P < 0.05, **P< 0.01 by Student's t-test.
Figure 6
Figure 6
Function analysis of CabZIP25 under salt stress. (A) Phenotypic analysis, seed germination rate, fresh weight, and chlorophyll content of Arabidopsis treated with different concentrations of NaCl for 10 days. (B) The phenotype and length of Arabidopsis roots at 10 days after different concentrations of NaCl. (C) The phenotype and chlorophyll content of leaf discs from TRV2: 00 or TRV2: CabZIP25 plants. Error bars represent SDs for three replicates. Data are shown as means ± SD. *P < 0.05, **P < 0.01 by Student's t-test. Bars = 1 cm.

References

    1. Allakhverdiev S. I., Kreslavski V. D., Klimov V. V., Los D. A., Carpentier R., Mohanty P. (2008). Heat stress: an overview of molecular responses in photosynthesis. Photosynth. Res. 98, 541–550. 10.1007/s11120-008-9331-0 - DOI - PubMed
    1. Alves M., Dadalto S., Gonçalves A., De Souza G., Barros V., Fietto L. (2013). Plant bZIP transcription factors responsive to pathogens: a review. Int. J. Mol. Sci. 14, 7815–7828. 10.3390/ijms14047815 - DOI - PMC - PubMed
    1. Baloglu M. C., Eldem V., Hajyzadeh M., Unver T. (2014). Genome-wide analysis of the bZIP transcription factors in cucumber. PloS One 9, e96014. 10.1371/journal.pone.0096014 - DOI - PMC - PubMed
    1. Bastias A., Yanez M., Osorio S., Arbona V., Gomez-Cadenas A., Fernie A. R., et al. (2014). The transcription factor AREB1 regulates primary metabolic pathways in tomato fruits. J. Exp. Bot. 65, 2351–2363. 10.1093/jxb/eru114 - DOI - PMC - PubMed
    1. Beachy R. N., Yin Y., Lamb C., Dai S., Zhu Q. (1997). RF2a, a bZIP transcriptional activator of the phloem-specific rice tungro bacilliform virus promoter, functions in vascular development. EMBO J. 16, 5247–5259. 10.1093/emboj/16.17.5247 - DOI - PMC - PubMed