

Single-Nucleotide Polymorphisms (SNP) Mining and Their Effect on the Tridimensional Protein Structure Prediction in a Set of Immunity-Related Expressed Sequence Tags (EST) in Atlantic Salmon (Salmo salar)
- PMID: 32174954
- PMCID: PMC7056891
- DOI: 10.3389/fgene.2019.01406
Single-Nucleotide Polymorphisms (SNP) Mining and Their Effect on the Tridimensional Protein Structure Prediction in a Set of Immunity-Related Expressed Sequence Tags (EST) in Atlantic Salmon (Salmo salar)
Abstract
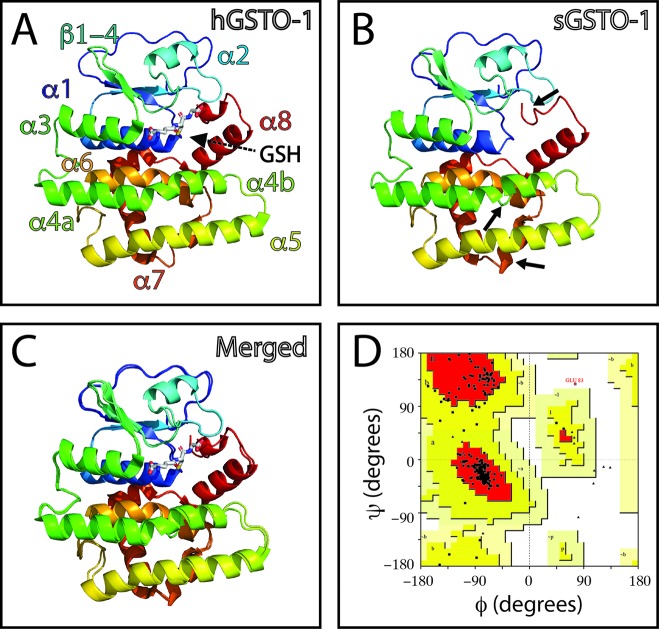
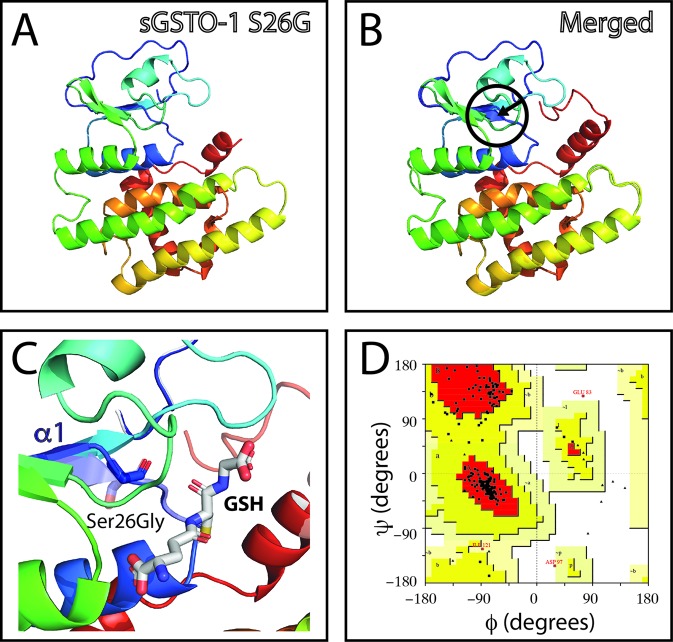
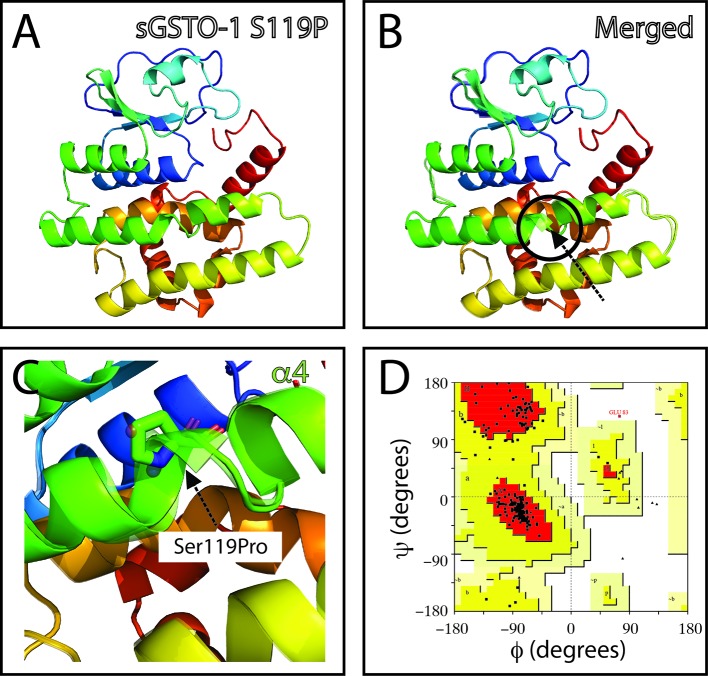
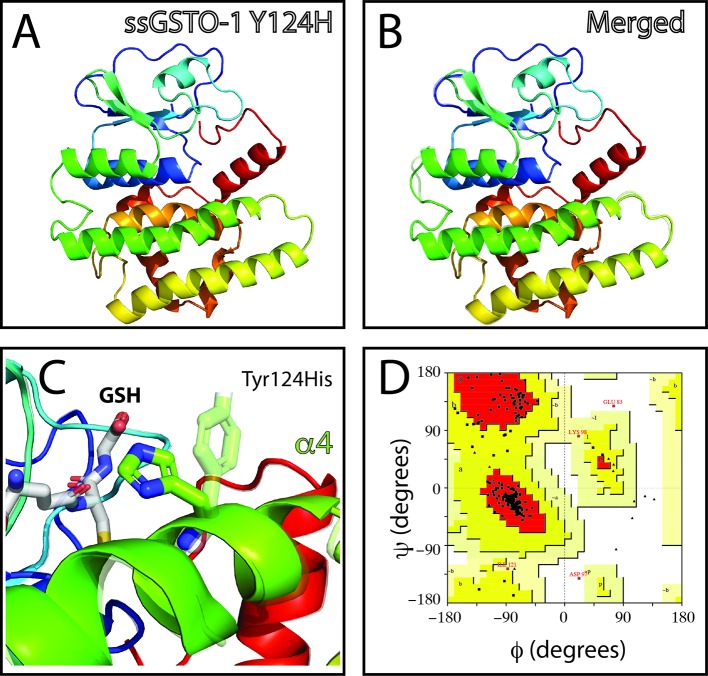
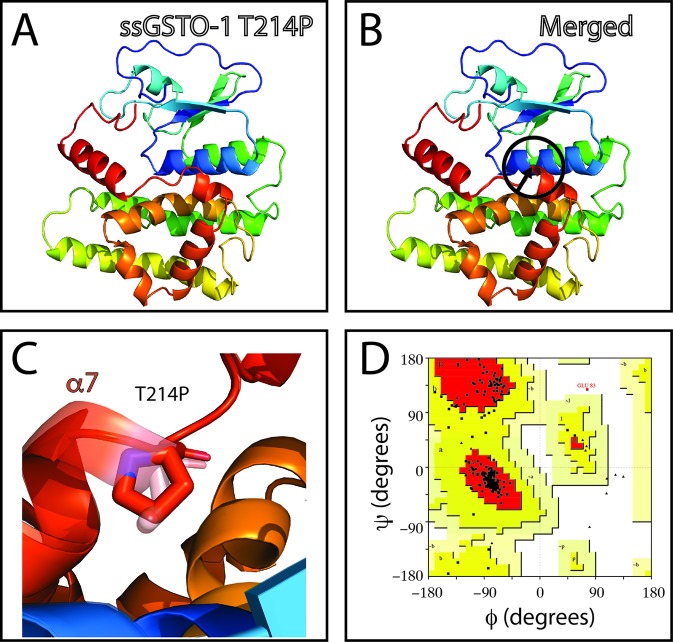
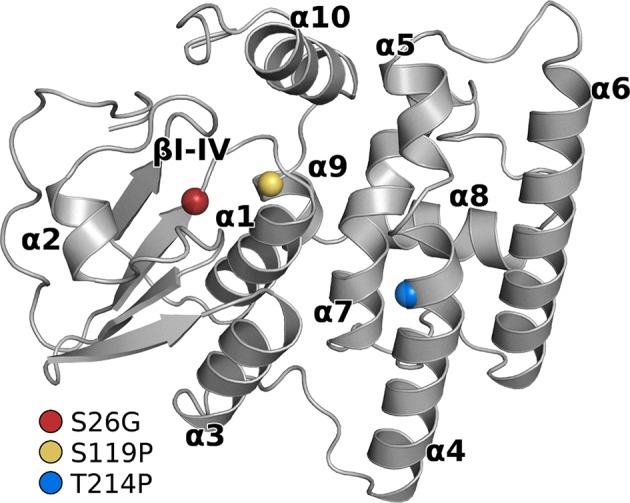
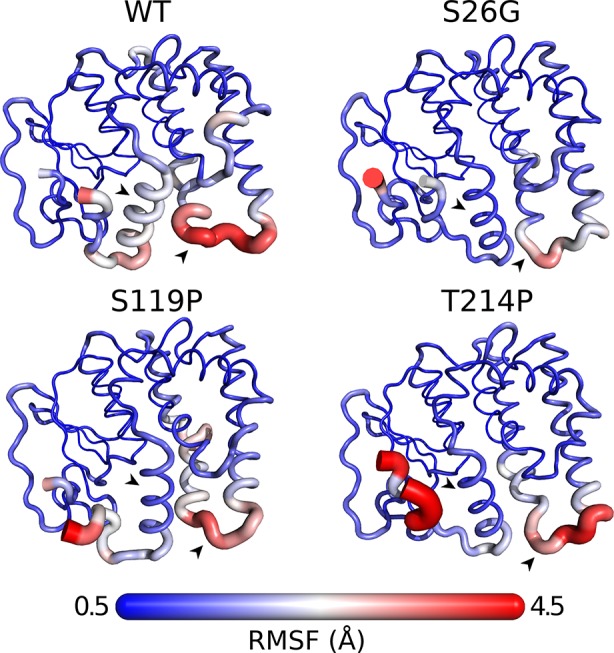
Single-nucleotide polymorphisms (SNPs) are single genetic code variations considered one of the most common forms of nucleotide modifications. Such SNPs can be located in genes associated to immune response and, therefore, they may have direct implications over the phenotype of susceptibility to infections affecting the productive sector. In this study, a set of immune-related genes (cc motif chemokine 19 precursor [ccl19], integrin β2 (itβ2, also named cd18), glutathione transferase omega-1 [gsto-1], heat shock 70 KDa protein [hsp70], major histocompatibility complex class I [mhc-I]) were analyzed to identify SNPs by data mining. These genes were chosen based on their previously reported expression on infectious pancreatic necrosis virus (IPNV)-infected Atlantic salmon phenotype. The available EST sequences for these genes were obtained from the Unigene database. Twenty-eight SNPs were found in the genes evaluated and identified most of them as transition base changes. The effect of the SNPs located on the 5'-untranslated region (UTR) or 3'-UTR upon transcription factor binding sites and alternative splicing regulatory motifs was assessed and ranked with a low-medium predicted FASTSNP score risk. Synonymous SNPs were found on itβ2 (c.2275G > A), gsto-1 (c.558G > A), and hsp70 (c.1950C > T) with low FASTSNP predicted score risk. The difference in the relative synonymous codon usage (RSCU) value between the variant codons and the wild-type codon (ΔRSCU) showed one negative (hsp70 c.1950C > T) and two positive ΔRSCU values (itβ2 c.2275G > A; gsto-1 c.558G > A), suggesting that these synonymous SNPs (sSNPs) may be associated to differences in the local rate of elongation. Nonsynonymous SNPs (nsSNPs) in the gsto-1 translatable gene region were ranked, using SIFT and POLYPHEN web-tools, with the second highest (c.205A > G; c484T > C) and the highest (c.499T > C; c.769A > C) predicted score risk possible. Using homology modeling to predict the effect of these nonsynonymous SNPs, the most relevant nucleotide changes for gsto-1 were observed for the nsSNPs c.205A > G, c484T > C, and c.769A > C. Molecular dynamics was assessed to analyze if these GSTO-1 variants have significant differences in their conformational dynamics, suggesting these SNPs could have allosteric effects modulating its catalysis. Altogether, these results suggest that candidate SNPs identified may play a crucial potential role in the immune response of Atlantic salmon.
Keywords: 3D protein structure; Salmo salar; homology modeling; immune response; molecular dynamics simulation; nonsynonymous SNP; single-nucleotide polymorphism; synonymous SNP.
Copyright © 2020 Vallejos-Vidal, Reyes-Cerpa, Rivas-Pardo, Maisey, Yáñez, Valenzuela, Cea, Castro-Fernandez, Tort, Sandino, Imarai and Reyes-López.
Figures
Similar articles
-
Novel polymorphisms in UTR and coding region of inducible heat shock protein 70.1 gene in tropically adapted Indian zebu cattle (Bos indicus) and riverine buffalo (Bubalus bubalis).Gene. 2013 Sep 25;527(2):606-15. doi: 10.1016/j.gene.2013.05.078. Epub 2013 Jun 19. Gene. 2013. PMID: 23792016
-
Genetic association of KCNJ10 rs1130183 with seizure susceptibility and computational analysis of deleterious non-synonymous SNPs of KCNJ10 gene.Gene. 2014 Feb 25;536(2):247-53. doi: 10.1016/j.gene.2013.12.026. Epub 2013 Dec 27. Gene. 2014. PMID: 24378235
-
Targeted SNP discovery in Atlantic salmon (Salmo salar) genes using a 3'UTR-primed SNP detection approach.BMC Genomics. 2010 Dec 15;11:706. doi: 10.1186/1471-2164-11-706. BMC Genomics. 2010. PMID: 21159188 Free PMC article.
-
Prioritization of candidate SNPs in colon cancer using bioinformatics tools: an alternative approach for a cancer biologist.Interdiscip Sci. 2010 Dec;2(4):320-46. doi: 10.1007/s12539-010-0003-3. Epub 2010 Dec 12. Interdiscip Sci. 2010. PMID: 21153778 Review.
-
The Effects of Single Nucleotide Polymorphisms in Cancer RNAi Therapies.Cancers (Basel). 2020 Oct 25;12(11):3119. doi: 10.3390/cancers12113119. Cancers (Basel). 2020. PMID: 33113880 Free PMC article. Review.
Cited by
-
Carvacrol, Thymol, and Garlic Essential Oil Promote Skin Innate Immunity in Gilthead Seabream (Sparus aurata) Through the Multifactorial Modulation of the Secretory Pathway and Enhancement of Mucus Protective Capacity.Front Immunol. 2021 Mar 12;12:633621. doi: 10.3389/fimmu.2021.633621. eCollection 2021. Front Immunol. 2021. PMID: 33777020 Free PMC article.
-
Potential determinants of low circulating glucagon-like peptide 2 concentrations in Zambian children with non-responsive stunting.Exp Physiol. 2023 Apr;108(4):568-580. doi: 10.1113/EP090492. Epub 2023 Feb 6. Exp Physiol. 2023. PMID: 36744850 Free PMC article.
-
Evaluating the association of rs6983267 polymorphism of the CCAT2 gene with thyroid cancer susceptibility in the Iranian Azeri population.Mol Biol Res Commun. 2023;12(3):127-131. doi: 10.22099/mbrc.2023.47622.1839. Mol Biol Res Commun. 2023. PMID: 37525664 Free PMC article.
-
Exploring the impact of deleterious missense nonsynonymous single nucleotide polymorphisms in the DRD4 gene using computational approaches.Sci Rep. 2025 Jan 24;15(1):3150. doi: 10.1038/s41598-025-86916-w. Sci Rep. 2025. PMID: 39856236 Free PMC article.
-
Impact of highly deleterious non-synonymous polymorphisms on GRIN2A protein's structure and function.PLoS One. 2023 Jun 15;18(6):e0286917. doi: 10.1371/journal.pone.0286917. eCollection 2023. PLoS One. 2023. PMID: 37319252 Free PMC article.
References
-
- Ali Mohamoud H. S., Manwar Hussain M. R., El-Harouni A. A., Shaik N. A., Qasmi Z. U., Merican A. F., et al. (2014). First comprehensive in silico analysis of the functional and structural consequences of SNPs in human GalNAc-T1 gene. Comput. Math. Methods Med. 2014, 904052. 10.1155/2014/904052 - DOI - PMC - PubMed
LinkOut - more resources
Full Text Sources
Research Materials
Miscellaneous