

Microvascular Mimetics for the Study of Leukocyte-Endothelial Interactions
- PMID: 32175026
- PMCID: PMC7048879
- DOI: 10.1007/s12195-020-00611-6
Microvascular Mimetics for the Study of Leukocyte-Endothelial Interactions
Abstract
Introduction: The pathophysiological increase in microvascular permeability plays a well-known role in the onset and progression of diseases like sepsis and atherosclerosis. However, how interactions between neutrophils and the endothelium alter vessel permeability is often debated.
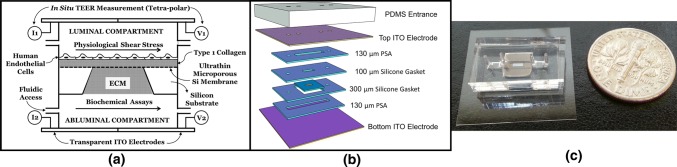
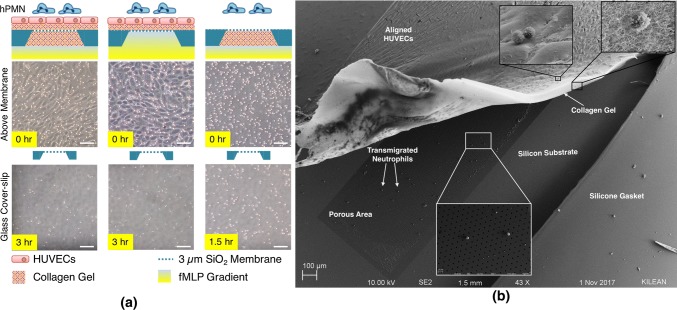
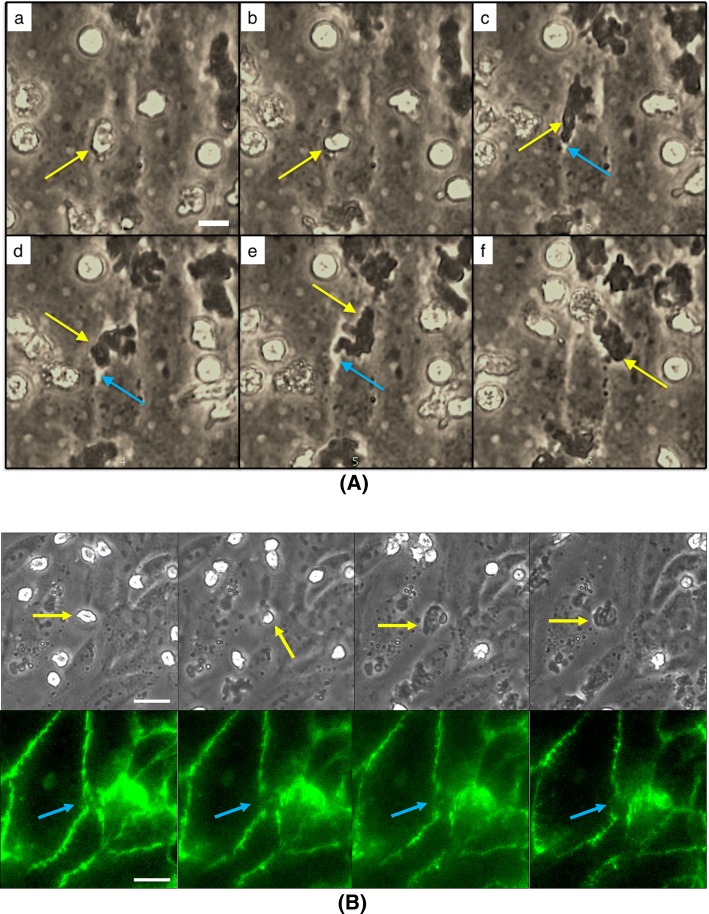
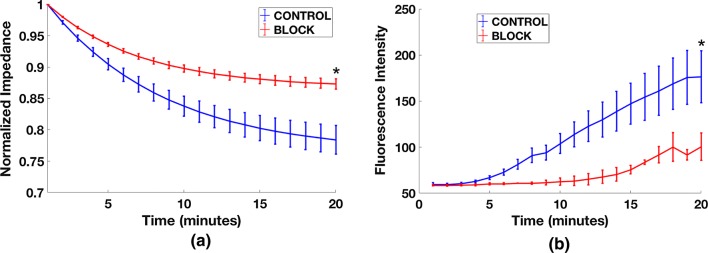
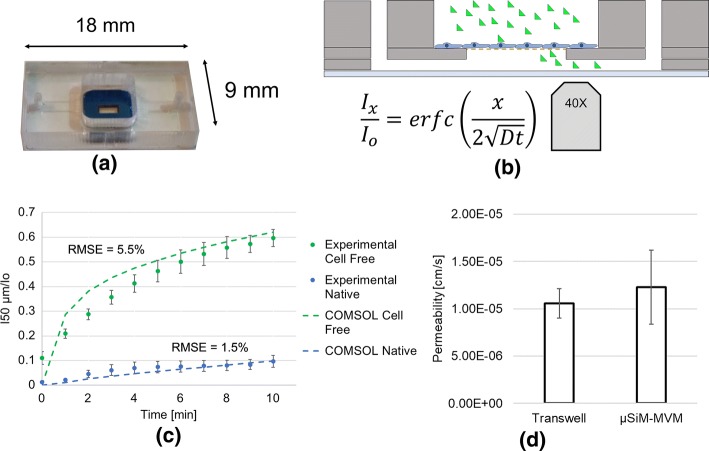
Methods: In this study, we introduce a microfluidic, silicon-membrane enabled vascular mimetic (μSiM-MVM) for investigating the role of neutrophils in inflammation-associated microvascular permeability. In utilizing optically transparent silicon nanomembrane technology, we build on previous microvascular models by enabling in situ observations of neutrophil-endothelium interactions. To evaluate the effects of neutrophil transmigration on microvascular model permeability, we established and validated electrical (transendothelial electrical resistance and impedance) and small molecule permeability assays that allow for the in situ quantification of temporal changes in endothelium junctional integrity.
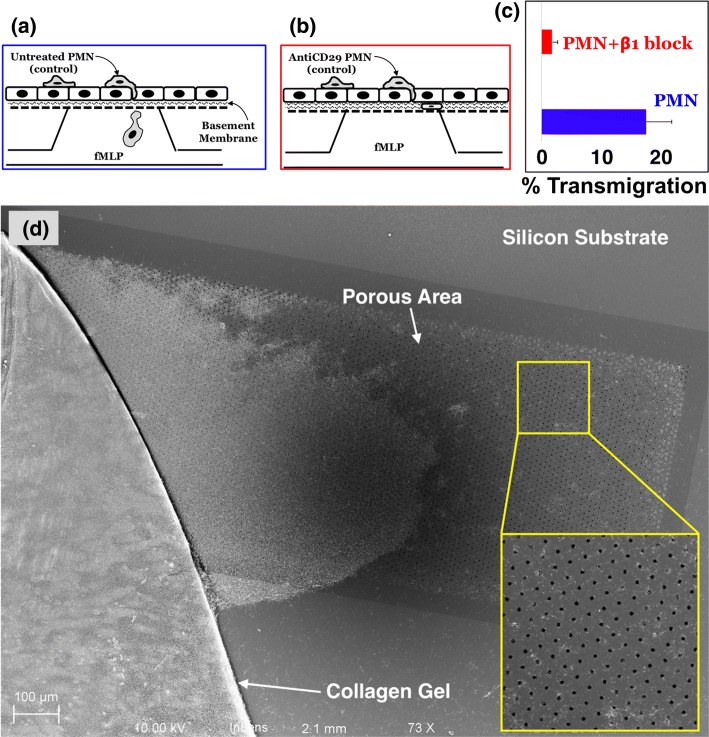
Results: Analysis of neutrophil-expressed β1 integrins revealed a prominent role of neutrophil transmigration and basement membrane interactions in increased microvascular permeability. By utilizing blocking antibodies specific to the β1 subunit, we found that the observed increase in microvascular permeability due to neutrophil transmigration is constrained when neutrophil-basement membrane interactions are blocked. Having demonstrated the value of in situ measurements of small molecule permeability, we then developed and validated a quantitative framework that can be used to interpret barrier permeability for comparisons to conventional Transwell™ values.
Conclusions: Overall, our results demonstrate the potential of the μSiM-MVM in elucidating mechanisms involved in the pathogenesis of inflammatory disease, and provide evidence for a role for neutrophils in inflammation-associated endothelial barrier disruption.
Keywords: Endothelial permeability; Microfluidics; Neutrophil transendothelial migration; Silicon nanomembranes; Transendothelial electrical resistance.
© Biomedical Engineering Society 2020.
Figures

Similar articles
-
Endothelial cell apicobasal polarity coordinates distinct responses to luminally versus abluminally delivered TNF-α in a microvascular mimetic.Integr Biol (Camb). 2020 Nov 18;12(11):275-289. doi: 10.1093/intbio/zyaa022. Integr Biol (Camb). 2020. PMID: 33164044 Free PMC article.
-
Focal adhesion kinase in neutrophil-induced microvascular hyperpermeability.Microcirculation. 2005 Mar;12(2):223-32. doi: 10.1080/10739680590905251. Microcirculation. 2005. PMID: 15824042
-
Protein kinase C-delta inhibition protects blood-brain barrier from sepsis-induced vascular damage.J Neuroinflammation. 2018 Nov 6;15(1):309. doi: 10.1186/s12974-018-1342-y. J Neuroinflammation. 2018. PMID: 30400800 Free PMC article.
-
Neutrophil transendothelial migration and alteration in vascular permeability: focus on neutrophil-derived azurocidin.Curr Opin Hematol. 2003 Jan;10(1):25-30. doi: 10.1097/00062752-200301000-00005. Curr Opin Hematol. 2003. PMID: 12483108 Review.
-
Neutrophil transendothelial migration hotspots - mechanisms and implications.J Cell Sci. 2021 Apr 1;134(7):jcs255653. doi: 10.1242/jcs.255653. J Cell Sci. 2021. PMID: 33795378 Review.
Cited by
-
Reply to "A Letter Concerning a Role for Blood-Brain Barrier Dysfunction in Delirium following Noncardiac Surgery in Older Adults".Ann Neurol. 2024 Feb;95(2):411-413. doi: 10.1002/ana.26834. Epub 2023 Dec 5. Ann Neurol. 2024. PMID: 37994239 Free PMC article. No abstract available.
-
Fluid flow impacts endothelial-monocyte interactions in a model of vascular inflammatory fibrosis.Sci Rep. 2025 Jan 25;15(1):3227. doi: 10.1038/s41598-025-85987-z. Sci Rep. 2025. PMID: 39863621 Free PMC article.
-
Use of the MicroSiM (µSiM) Barrier Tissue Platform for Modeling the Blood-Brain Barrier.J Vis Exp. 2024 Jan 12;(203):10.3791/65258. doi: 10.3791/65258. J Vis Exp. 2024. PMID: 38284519 Free PMC article.
-
The Modular µSiM Reconfigured: Integration of Microfluidic Capabilities to Study In Vitro Barrier Tissue Models under Flow.Adv Healthc Mater. 2022 Nov;11(21):e2200802. doi: 10.1002/adhm.202200802. Epub 2022 Aug 21. Adv Healthc Mater. 2022. PMID: 35953453 Free PMC article.
-
A photonic biosensor-integrated tissue chip platform for real-time sensing of lung epithelial inflammatory markers.Lab Chip. 2023 Jan 17;23(2):239-250. doi: 10.1039/d2lc00864e. Lab Chip. 2023. PMID: 36594179 Free PMC article.
References
-
- Agrawal AA, Nehilla BJ, Reisig KV, Gaborski TR, Fang DZ, Striemer CC, Fauchet PM, McGrath JL. Porous nanocrystalline silicon membranes as highly permeable and molecularly thin substrates for cell culture. Biomaterials. 2010;31:5408–5417. - PubMed
-
- Booth R, Kim H. Characterization of a microfluidic in vitro model of the blood-brain barrier (mubbb) Lab. Chip. 2012;12:1784–1792. - PubMed
Grants and funding
LinkOut - more resources
Full Text Sources
