

Fully Dried Two-Dimensional Paper Network for Enzymatically Enhanced Detection of Nucleic Acid Amplicons
- PMID: 32175514
- PMCID: PMC7066650
- DOI: 10.1021/acsomega.0c00115
Fully Dried Two-Dimensional Paper Network for Enzymatically Enhanced Detection of Nucleic Acid Amplicons
Abstract
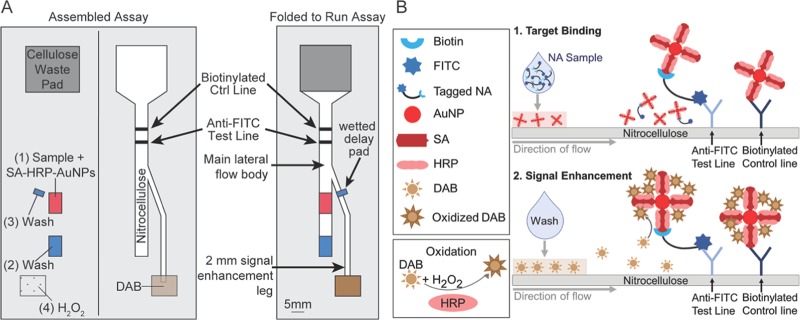
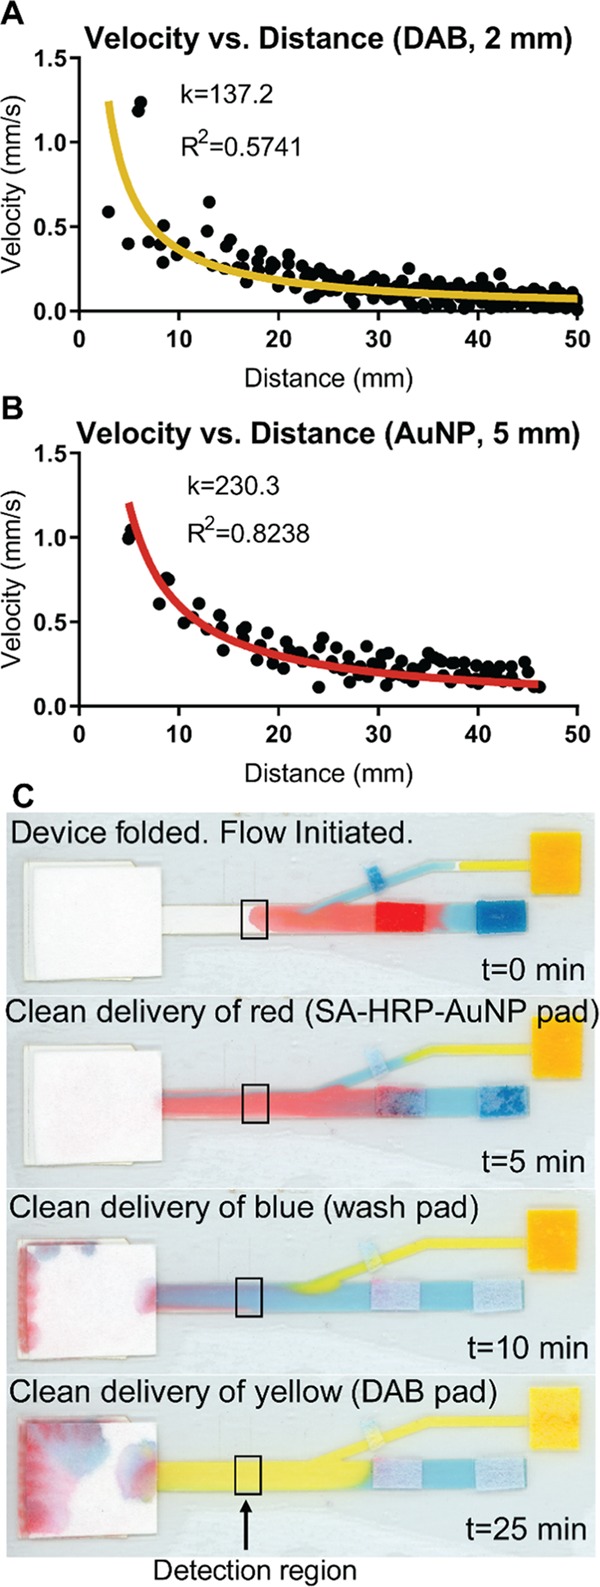
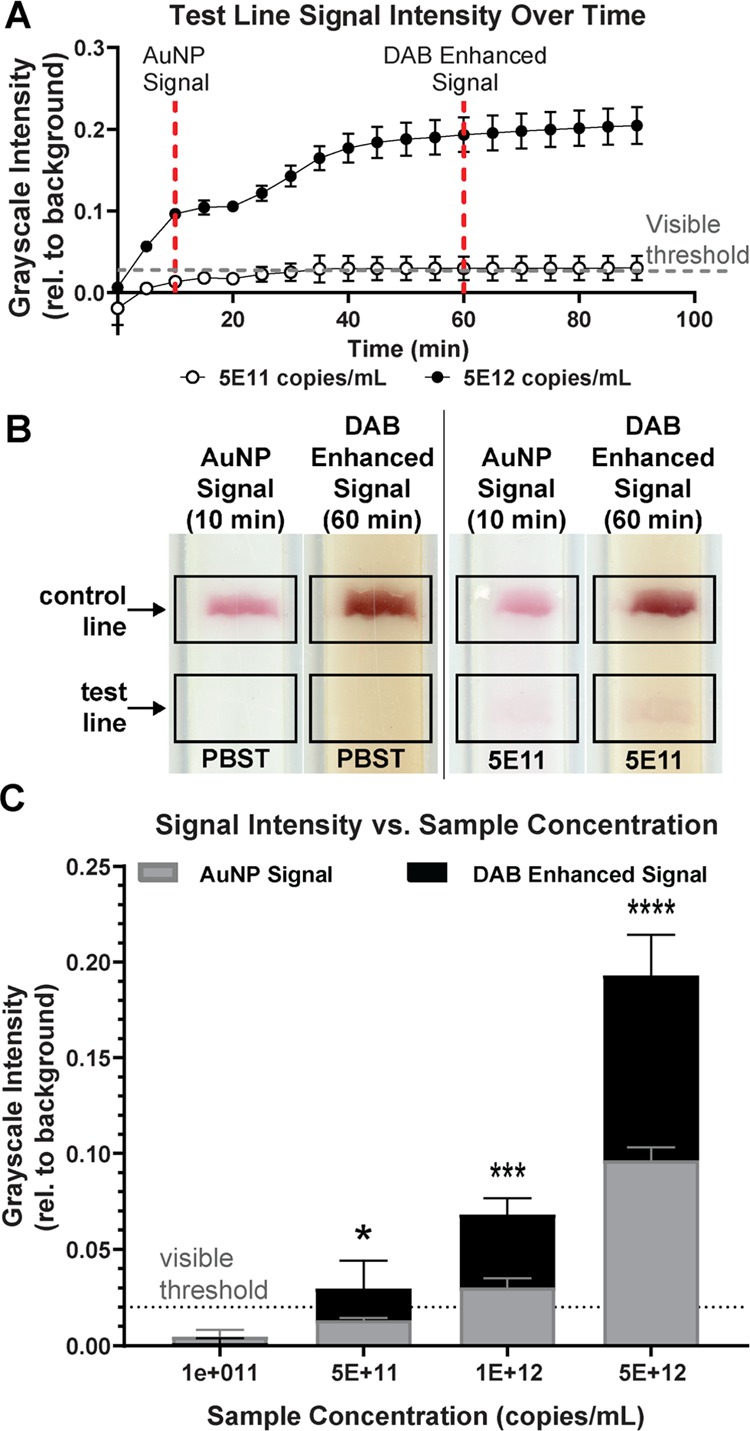
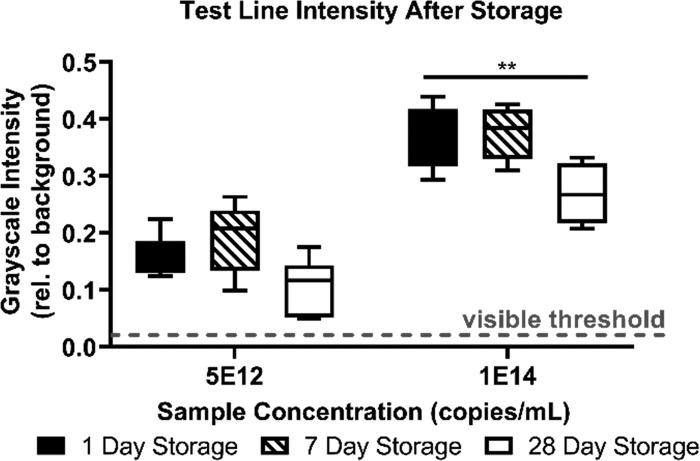
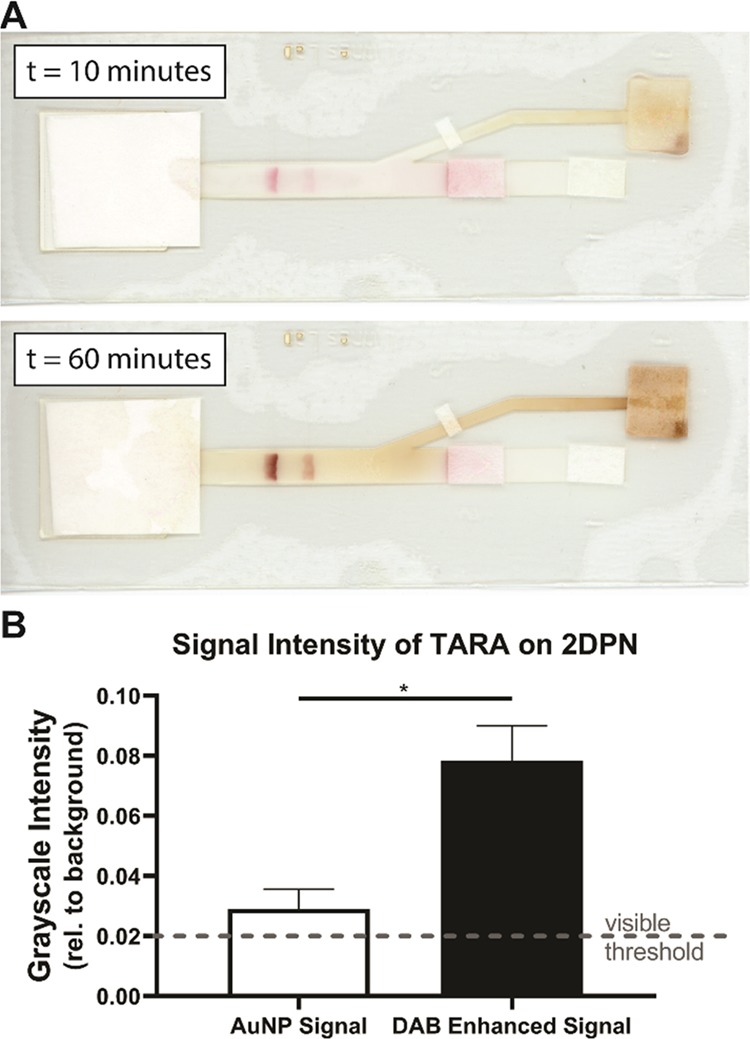
Two-dimensional paper networks (2DPNs) have enabled the use of paper-based platforms to perform multistep immunoassays for detection of pathogenic diseases at the point-of-care. To date, however, detection has required the user to provide multiple signal enhancement solutions and been limited to protein targets. We solve these challenges by using mathematical equations to guide the device design of a novel 2DPN, which leverages multiple fluidic inputs to apply fully dried solutions of hydrogen peroxide, diaminobenzidine, and horseradish peroxidase signal enhancement reagents to enhance the limit-of-detection of numerous nucleic acid products. Upon rehydration in our unique 2DPN design, the dried signal enhancement solution reduces the limit-of-detection (LOD) of the device to 5 × 10¹¹ nucleic acid copies/mL without increasing false positive detection. Our easy-to-use device retains activity after 28 days of dry storage and produces reliable signal enhancement 40 min after sample application. The fully integrated device demonstrated versatility in its ability to detect double-stranded and single-stranded DNA samples, as well as peptide nucleic acids.
Copyright © 2020 American Chemical Society.
Conflict of interest statement
The authors declare the following competing financial interest(s): Dr. HyunDae D. Cho is CEO and President of CrossLife Technologies, which holds a patent for the TARA assay we used in this publication.
Figures
Similar articles
-
A fully disposable and integrated paper-based device for nucleic acid extraction, amplification and detection.Lab Chip. 2017 Mar 29;17(7):1270-1279. doi: 10.1039/c6lc01586g. Lab Chip. 2017. PMID: 28271104
-
Chemical signal amplification in two-dimensional paper networks.Sens Actuators B Chem. 2010 Aug 6;149(1):325-328. doi: 10.1016/j.snb.2010.06.024. Sens Actuators B Chem. 2010. PMID: 20706615 Free PMC article.
-
NAIL: Nucleic Acid detection using Isotachophoresis and Loop-mediated isothermal amplification.Lab Chip. 2015 Apr 7;15(7):1697-707. doi: 10.1039/c4lc01479k. Lab Chip. 2015. PMID: 25666345
-
Highly Sensitive Two-Dimensional Paper Network Incorporating Biotin-Streptavidin for the Detection of Malaria.Anal Chem. 2016 Mar 1;88(5):2553-7. doi: 10.1021/acs.analchem.5b03999. Epub 2016 Feb 16. Anal Chem. 2016. PMID: 26824718 Free PMC article.
-
Shaping up field-deployable nucleic acid testing using microfluidic paper-based analytical devices.Anal Bioanal Chem. 2019 Jul;411(19):4401-4414. doi: 10.1007/s00216-019-01595-7. Epub 2019 Feb 1. Anal Bioanal Chem. 2019. PMID: 30707267 Review.
Cited by
-
Post-Assay Chemical Enhancement for Highly Sensitive Lateral Flow Immunoassays: A Critical Review.Biosensors (Basel). 2023 Sep 1;13(9):866. doi: 10.3390/bios13090866. Biosensors (Basel). 2023. PMID: 37754100 Free PMC article. Review.
-
COVID-19: A systematic review and update on prevention, diagnosis, and treatment.MedComm (2020). 2022 Feb 17;3(1):e115. doi: 10.1002/mco2.115. eCollection 2022 Mar. MedComm (2020). 2022. PMID: 35281790 Free PMC article. Review.
-
Multiplexed paper-based assay for personalized antimicrobial susceptibility profiling of Carbapenem-resistant Enterobacterales performed in a rechargeable coffee mug.Sci Rep. 2022 Jul 14;12(1):11990. doi: 10.1038/s41598-022-16275-3. Sci Rep. 2022. PMID: 35835831 Free PMC article.
-
Detecting the Coronavirus (COVID-19).ACS Sens. 2020 Aug 28;5(8):2283-2296. doi: 10.1021/acssensors.0c01153. Epub 2020 Jul 17. ACS Sens. 2020. PMID: 32627534 Free PMC article. Review.
-
Point-of-care diagnostics: recent developments in a pandemic age.Lab Chip. 2021 Nov 25;21(23):4517-4548. doi: 10.1039/d1lc00627d. Lab Chip. 2021. PMID: 34778896 Free PMC article. Review.
References
-
- Laboratory Diagnosis of Viral Infections. In Fenner’s Veterinary Virology; MacLachlan N. J.; Dubovi E. J., Eds.; Elsevier, 2011; pp 101–123.
-
- Ko J.-H.; Müller M. A.; Seok H.; Park G. E.; Lee J. Y.; Cho S. Y.; Ha Y. E.; Baek J. Y.; Kim S. H.; Kang J.-M.; et al. Suggested New Breakpoints of Anti-MERS-CoV Antibody ELISA Titers: Performance Analysis of Serologic Tests. Eur. J. Clin. Microbiol. Infect. Dis. 2017, 36, 2179–2186. 10.1007/s10096-017-3043-3. - DOI - PMC - PubMed
-
- Fu E.; Liang T.; Spicar-Mihalic P.; Houghtaling J.; Ramachandran S.; Yager P. Two-Dimensional Paper Network Format That Enables Simple Multistep Assays for Use in Low-Resource Settings in the Context of Malaria Antigen Detection. Anal. Chem. 2012, 84, 4574–4579. 10.1021/ac300689s. - DOI - PMC - PubMed
LinkOut - more resources
Full Text Sources
