Review
. 2020 Jun 24;120(12):5082-5106.
doi: 10.1021/acs.chemrev.9b00556. Epub 2020 Mar 16.

Reduction of Substrates by Nitrogenases

Affiliations
Review

Reduction of Substrates by Nitrogenases

Lance C Seefeldt et al. Chem Rev. .

Abstract

Nitrogenase is the enzyme that catalyzes biological N2 reduction to NH3. This enzyme achieves an impressive rate enhancement over the uncatalyzed reaction. Given the high demand for N2 fixation to support food and chemical production and the heavy reliance of the industrial Haber-Bosch nitrogen fixation reaction on fossil fuels, there is a strong need to elucidate how nitrogenase achieves this difficult reaction under benign conditions as a means of informing the design of next generation synthetic catalysts. This Review summarizes recent progress in addressing how nitrogenase catalyzes the reduction of an array of substrates. New insights into the mechanism of N2 and proton reduction are first considered. This is followed by a summary of recent gains in understanding the reduction of a number of other nitrogenous compounds not considered to be physiological substrates. Progress in understanding the reduction of a wide range of C-based substrates, including CO and CO2, is also discussed, and remaining challenges in understanding nitrogenase substrate reduction are considered.


Conflict of interest statement

The authors declare no competing financial interest.

Figures

Figure 1.
Figure 1.
General nitrogenase architecture. Schematic of nitrogenase structures showing the electron delivery Fe protein component and the catalytic MFe protein component (M = Mo, V, Fe). MoFe protein is an α2β2, and VFe and FeFe proteins are α2β2γ2 heterohexamers. Adapted with permission from ref . Copyright 2018 American Chemical Society.
Figure 2.
Figure 2.
Structures of the FeMo-cofactor of Mo-nitrogenase,,,, FeV-cofactor of V-nitrogenase,, and proposed structure of the FeFe-cofactor of Fe-nitrogenase. View is looking down on the Fe2, 3, 6, 7 face as indicated by the Fe atom numbering on FeMo-cofactor. Not shown are the cysteine coordinating Fe1, and the histidine and the R-homocitrate tail that ligate the Mo, V, or Fe are shown in blue.
Figure 3.
Figure 3.
Simplified 8[e/H+] kinetic scheme for nitrogen reduction. In the Lowe–Thorneley En notation, n = number of [e/H+] added to FeMo-co; in parentheses, the stoichiometry of H/N bound to FeMo-co. The re/oa equilibrium is highlighted in red, and the intermediates in red boxes have been freeze trapped for spectroscopic study.
Figure 4.
Figure 4.
Propargyl alcohol reduction intermediate with hyperfine couplings indicated. Reproduced with permission from ref . Copyright 2004 American Chemical Society.
Figure 5.
Figure 5.
Schematic of re/oa equilibrium. In the indicated equilibrium, the binding and activation of N2 is mechanistically coupled to the re of H2, as described in the text. Adapted with permission from ref . Copyright 2016 American Chemical Society.
Figure 6.
Figure 6.
Time courses of four EPR detected states during −50 °C cryoannealing of WT low P(N2) ~ 0.05 atm turnover in H2O. The data colors correspond to those in the kinetic scheme (top) and the lines correspond to fits to that scheme. Stretched exponential exp(−(t/τ)m) parameters of the first two fast steps are τ1 = 43 min, m1 = 0.79 and τ2 = 6 min, m2 = 0.8, and the third slow step fitted as exponential with τ3 = 330 min. Reproduced with permission from . Copyright 2016 American Chemical Society.
Figure 7.
Figure 7.
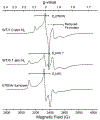
X-band EPR spectra of WT nitrogenase turnover samples trapped under 1 atm of N2 (with stirring to facilitate transfer of H2 formed during turnover into the headspace), and under low P(N2) in H2O buffer (without stirring) shown in comparison with spectrum of E4(4H) state trapped during turnover of α−70Val→Ile MoFe protein of the same concentration. Reproduced with permission from ref . Copyright 2016 American Chemical Society.
Figure 8.
Figure 8.
Cartoon version of suggested catalytic pathway for re/oa activation of FeMo-co for N2 reduction. Reproduced with permission from ref . Copyright 2017 American Chemical Society.
Figure 9.
Figure 9.
Schematic representation of photolysis conversion of [Fe-H-Fe] hydride bridge of E2(2H)/1b into isomer E2(2H)/1c with either a hydride bridge between a different pair of Fe ions or an Fe-H terminal hydride. Adapted with permission from ref . Copyright 2018 American Chemical Society
Figure 10.
Figure 10.
Energetics of formation of E4(2N2H) from the enzymatic reactants and its decomposition into two individual two-electron, two-proton processes, each involving the hydrolysis of 2ATP per electron: the formation of E4(2N2H) and of H2, which are coupled through displaces and releases H2 formed by re from E4(4H). Adapted with permission from . Copyright 2018 National Academy of Sciences.
Figure 11.
Figure 11.
35 GHz 1H stochastic-field modulation detected (stochastic CW) ENDOR spectra of E4(4H) in 70Val→Ile/α−195His→Gln MoFe protein, acquired at g = 1.991 and 1.964 (black) and summed simulations (red). The signal with ν0(1H) ± ~3 MHz, with both positive and negative features, represents transient responses from weakly coupled, more distant protons. Reproduced with permission ref . Copyright 2019 American Chemical Society.
Figure 12.
Figure 12.
Cartoon of the 2,3,6,7 face of the ground state isomer of E4(4H), denoted E4(4H)(a) as found by BS-DFT computation. Reproduced with permission from ref . Copyright 2019 American Chemical Society.
Figure 13.
Figure 13.
Reactions of the E4 state. N2 binds through re with rate constant kre to the right. H2 evolves through HP with rate constant kHP to the left. Reproduced with permission 153. Copyright 2018 American Chemical Society.
Figure 14.
Figure 14.
Ratio of H2 evolved to N2 reduced as a function of partial pressure N2 for all three nitrogenase isozymes. The fits to this data for each enzyme produce the value of its parameter ρ = kre/kHP Reproduced with permission from ref . Copyright 2019 American Chemical Society.
Figure 15.
Figure 15.
FeV-cofactor structure proposed by X-ray structure (X = NH) and theoretical calculations (X = OH).
Figure 16.
Figure 16.
Proposed N2 reduction pathways with M representing the active site FeMo-cofactor. A distal reduction pathway (D) and an alternating reduction pathway (A) are displayed with plausible key intermediates. The hybrid-A pathway is indicated by a dashed arrow.
Figure 17.
Figure 17.
Q-band CW EPR spectrum of α−70Val→Ala/α−195His→Gln MoFe protein in the resting state and trapped during turnover with 14N2H4 as substrate. Kramers intermediate I and non-Kramers intermediate, H, are noted in the turnover spectrum. Reproduced with permission from ref . Copyright 2012 Authors. Published by PNAS.
Figure 18.
Figure 18.
X-band EPR spectra of α−70Ala/α−195Gln MoFe protein turnover samples prepared with N2H4 (black), NO2 (red), and NH2OH (green) substrates. Reproduced with permission 193. Copyright 2014 American Chemical Society.
Figure 19.
Figure 19.
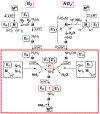
Comparison of the proposed reduction pathways of N2 (left) and nitrite (right) by nitrogenase (M represents FeMo-cofactor). An intermediate, labeled En on N2 pathway and Em′ on nitrite pathway, has accumulated n or m [e/H+]. (Boxed Region) Convergence of pathways for nitrite and N2 reduction by nitrogenase, as discussed in the text. Within this region, boxed reactions of E1 show the most direct routes by which N2H4 and NH2OH join their respective pathways. Reproduced with permission from ref . Copyright 2014 American Chemical Society.
Figure 20.
Figure 20.
Schematic representation of chemical structure of SEPR1 species at E2 state, highlighting the ferracycle formed by C2H4 binding to Fe6 as proposed in literature. The 4Fe4S face represents the same orientation as in Figure 2.
Figure 21.
Figure 21.
X-band EPR spectra of α−96Leu MoFe protein under nonturnover conditions in the absence (top trace) and presence (bottom trace) of acetylene. Reproduced with permission from ref . Copyright 2001 American Chemical Society.
Figure 22.
Figure 22.
Comparison of the acetylene location at the FeMo-cofactor. The acetylene location at the FeMo-cofactor is compared between X-ray (A) and DFT optimized structures (B). The interatomic distances are shown with red lines. Reproduced with permission 215. Copyright 2017 Elsevier, Ltd.
Figure 23.
Figure 23.
Schematic structures of CO complexes as proposed based on (A) EPR/ENDOR,,,– (B) IR-monitored photolysis, and (C) X-ray crystallography of Mo-nitrogenase and EPR comparison of Mo- and V-nitrogenases. The presence of a bound carbonate in the VFe-co was revealed later by X-ray crystallography.
Figure 24.
Figure 24.
Possible CO2 reduction pathways. CO2 activation at one FeS face of the E2 state of FeMo-co is shown. The E2 state is proposed to contain a single Fe-hydride and a proton bound to a sulfide shown bound to one face of FeMo-co. Reduction to formate (blue pathways) can go by either direct hydride transfer or an associative pathway. A pathway to formation of CO and CH4 is shown in the green. Adapted with permission from ref . Copyright 2016 American Chemical Society.
Figure 25.
Figure 25.
Computed free energy diagram for CO2 reduction and H2 formation occurring at the E2 state of FeMo-cofactor. Reproduced with permission 253. Copyright 2016 American Chemical Society.
Figure 26.
Figure 26.
Simplified schematic representation of conversion of Se-modified FeMo-cofactor by CO, highlighting the migration of Se2− to S3A and S5A position from the Se2B position.
Chart 1.
Chart 1.
Key Constraints on the Nitrogenase Mechanism
Scheme 1.
Scheme 1.. Kinetic Scheme for the Decay of Freeze-Trapped E4(2N2H) Derived from Figure 3a
Reproduced with permission from ref . Copyright 2015 American Chemical Society. akr and kb are the second-order rate constants for re and its reverse; kd and kd′ are the rate constants for the irreversible decay of E4(4H) and E2(2H), respectively.

Similar articles

Cited by

References

    1. Smil V Enriching the Earth: Fritz Haber, Carl Bosch, and the Transformation of World Food Production; MIT Press: Cambridge, MA, 2004.
    1. Erisman JW; Galloway JN; Dise NB; Sutton MA; Bleeker A; Grizzetti B; Leach AM; de Vries W Nitrogen: Too Much of a Vital Resource; Science Brief; WWF Nederland, 2015.
    1. Chen JG; Crooks RM; Seefeldt LC; Bren KL; Bullock RM; Darensbourg MY; Holland PL; Hoffman B; Janik MJ; Jones AK; et al. Beyond Fossil Fuel–Driven Nitrogen Transformations. Science 2018, 360, No. eaar6611. - PMC - PubMed
    1. Dawson CJ; Hilton J Fertiliser Availability in a Resource-Limited World: Production and Recycling of Nitrogen and Phosphorus. Food Policy 2011, 36, S14–S22.
    1. Erisman JW; Galloway JN; Seitzinger S; Bleeker A; Dise NB; Petrescu AMR; Leach AM; de Vries W Consequences of Human Modification of the Global Nitrogen Cycle. Philos. Trans. R. Soc., B 2013, 368, 20130116. - PMC - PubMed

Publication types