. 2021 Mar;26(2):e12889.
doi: 10.1111/adb.12889. Epub 2020 Mar 16.

Microglia depletion and alcohol: Transcriptome and behavioral profiles

Affiliations

Microglia depletion and alcohol: Transcriptome and behavioral profiles

Anna S Warden et al. Addict Biol. 2021 Mar.

Abstract

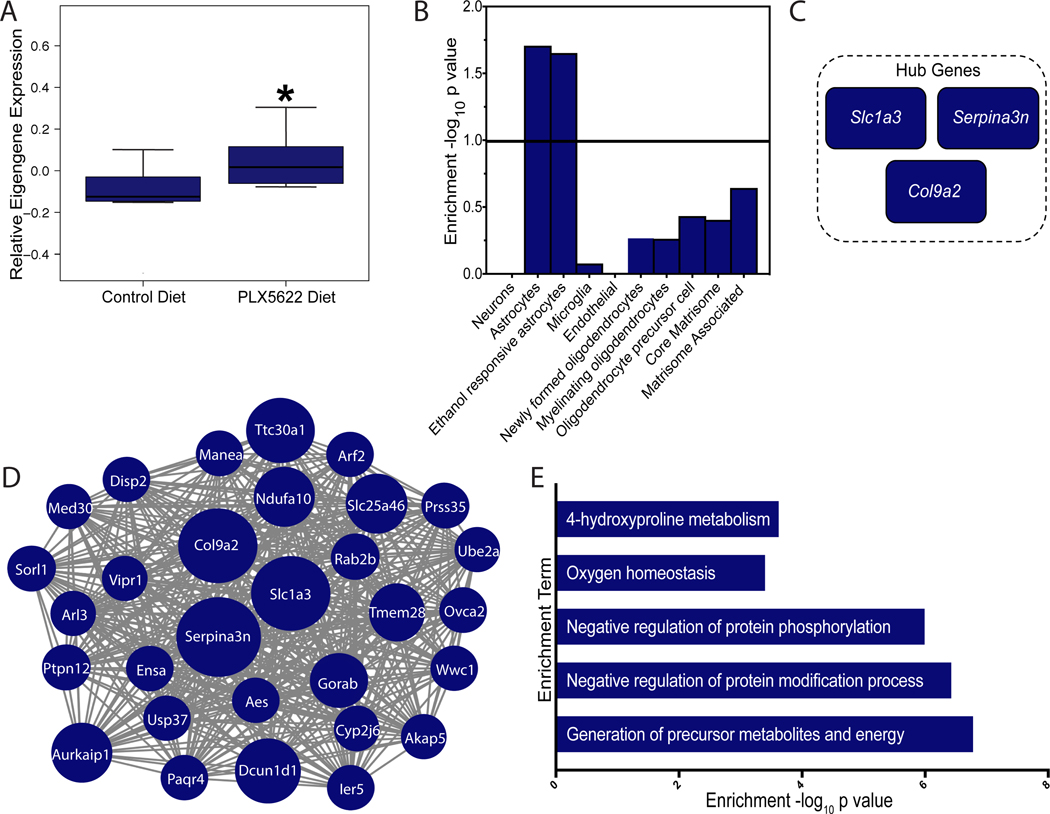
Alcohol abuse induces changes in microglia morphology and immune function, but whether microglia initiate or simply amplify the harmful effects of alcohol exposure is still a matter of debate. Here, we determine microglia function in acute and voluntary drinking behaviors using a colony-stimulating factor 1 receptor inhibitor (PLX5622). We show that microglia depletion does not alter the sedative or hypnotic effects of acute intoxication. Microglia depletion also does not change the escalation or maintenance of chronic voluntary alcohol consumption. Transcriptomic analysis revealed that although many immune genes have been implicated in alcohol abuse, downregulation of microglia genes does not necessitate changes in alcohol intake. Instead, microglia depletion and chronic alcohol result in compensatory upregulation of alcohol-responsive, reactive astrocyte genes, indicating astrocytes may play a role in regulation of these alcohol behaviors. Taken together, our behavioral and transcriptional data indicate that microglia are not the primary effector cell responsible for regulation of acute and voluntary alcohol behaviors. Because microglia depletion did not regulate acute or voluntary alcohol behaviors, we hypothesized that these doses were insufficient to activate microglia and recruit them to an effector phenotype. Therefore, we used a model of repeated immune activation using polyinosinic:polycytidylic acid (poly(I:C)) to activate microglia. Microglia depletion blocked poly(I:C)-induced escalations in alcohol intake, indicating microglia regulate drinking behaviors with sufficient immune activation. By testing the functional role of microglia in alcohol behaviors, we provide insight into when microglia are causal and when they are consequential for the transition from alcohol use to dependence.

Keywords: PLX5622; alcohol; astrocytes; microglia; neuroimmune; transcriptome.


Conflict of interest statement

CONFLICT OF INTEREST

The authors report no biomedical financial interests or potential conflicts of interest.

Figures

FIGURE 1
FIGURE 1
Microglia do not regulate alcohol-induced sedation or motor incoordination. Male C57BL/6J mice were placed on either control diet or PLX5622 diet for 21 days prior to behavioral testing to achieve >95% microglia depletion and then maintained on either diet for the remainder of behavioral testing. A, Ethanol-induced loss of righting reflex (LORR) in microglia-intact versus microglia-depleted mice. B, Ethanol-induced latency to LORR in microglia-intact versus microglia-depleted mice. C, Gaboxadol-induced LORR in microglia-intact versus microglia-depleted mice. D, Gaboxadol-induced latency to LORR in microglia-intact versus microglia-depleted mice. E, Ethanol-induced motor incoordination in microglia-intact versus microglia-depleted mice. F, Diazepam-induced motor incoordination in microglia-intact versus microglia-depleted mice. Values represent mean ± SEM, n = 10/group. LORR data were analyzed by Welch t test. Motor incoordination data were analyzed by repeated measures two-way ANOVA. EtOH, ethanol; LORR, loss of righting reflex.
FIGURE 2
FIGURE 2
Microglia do not regulate escalation nor maintenance of alcohol intake. A, Male C57BL/6J mice were on PLX5622 diet for 21 days prior to beginning drinking to achieve >95% microglia depletion and then maintained on PLX5622 diet for 44 days while undergoing an every-other-day two-bottle choice (2BC) procedure. B, EtOH consumption (g/kg/24 h); C, EtOH preference; D, total fluid intake (g/kg/24 h). E, Male C57BL/6J mice were allowed to escalate and establish a drinking baseline on an every-other-day 2BC procedure for 22 days, and then mice started either PLX5622 diet or control diet while continuing every-other-day 2BC for 14 days. Microglia were repopulated while mice continued every-other-day 2BC for 6 days. F, EtOH consumption (g/kg/24 h); G, EtOH preference; H, total fluid intake (g/kg/24 h). Values represent mean ± SEM, n = 10/group. Data were analyzed by repeated measures two-way ANOVA. EtOH, ethanol; 2BC, two-bottle choice.
FIGURE 3
FIGURE 3
Gene coexpression module associated with microglia depletion signature after chronic alcohol intake. A, Module 8 (M8) relative eigengene expression values between treatments. B, Enrichment (y-axis) for the cell-type specific genes (x-axis) belonging to the coexpression module. C, M8 hub genes, genes most strongly correlated with the module eigengene value. D, Visualization of the top 30 connections for M8. Size of the circle represents magnitude of log2 fold change. E, Relevant gene ontology categories enriched in M8.
FIGURE 4
FIGURE 4
Gene coexpression module associated with neuronal gene expression changes after microglia depletion and chronic alcohol intake. A, Module 17 (M17) relative eigengene expression values between treatments. B, Enrichment (y-axis) for the cell-type specific genes (x-axis) belonging to the coexpression module. C, M17 hub gene, gene most strongly correlated with the module eigengene value. D, Visualization of the top 30 connections for M17. Size of the circle represents magnitude of log2 fold change. E, Relevant gene ontology categories enriched in M17.
FIGURE 5
FIGURE 5
Gene coexpression module associated with compensatory reactive astrocytes after microglia depletion and chronic alcohol intake. A, Module 22 (M22) relative eigengene expression values between treatments. B, Enrichment (y-axis) for the cell-type specific genes (x-axis) belonging to the coexpression module. C, M22 hub genes, genes most strongly correlated with the module eigengene value. D, Visualization of the top 30 connections for M22. Size of the circle represents magnitude of log2 fold change. E, Relevant gene ontology categories enriched in M22.
FIGURE 6
FIGURE 6
Microglia depletion prevents poly(I:C)–induced escalations in alcohol intake. A, Male C57BL/6J mice were on PLX5622 diet for 21 days prior to beginning drinking to achieve >95% depletion and then maintained on PLX5622 diet for 44 days while undergoing an every-other-day two-bottle choice procedure with poly(I:C) injections every 4 days. B, EtOH consumption (g/kg/24 h); C, EtOH preference; D, total fluid intake (g/kg/24 h). E, Representative images of effect of microglia depletion on IBA1 staining (20×, scale bar = 50 μm). F, Quantification of microglia depletion. G, Effect of PLX5622 diet and poly(I:C) on body weight. Values represent mean ± SEM, drinking data: n = 10/group, immunohistochemistry: n = 3/group, body weight: n = 10/group. Drinking data were analyzed by repeated measures two-way ANOVA with Bonferroni post hoc testing (*P < 0.05, **P < 0.0021). Immunohistochemical data were analyzed by Welch t test (*P < 0.05, **P < 0.01, ***P < 0.001). Body weight data were analyzed by repeated measures two-way ANOVA and Bonferroni post hoc tests (*P < 0.05, **P < 0.01, ***P < 0.001). EtOH, ethanol.
FIGURE 7
FIGURE 7
PLX5622 diet depletes other peripheral macrophage and monocyte populations. C57BL/6J male mice were on either control diet or PLX5622 diet for 21 days to deplete microglia. Spleen, blood, and liver were collected from both groups. A, Representative flow cytometry plots of total CD45+, live, and myeloid (CD11c+ and/or CD11b+) cells that are macrophages (CD64+F4/80+) (top) or monocytes (CSF1R+CD11b+) from the spleens of control diet– and PLX5622 diet–treated mice. B, Representative flow cytometry plots of total CD45+, live, and myeloid (CD11c+ and/or CD11b+) cells that are macrophages (CD64+F4/80+) (top) or monocytes (CSF1R+CD11b+) from the blood of control diet– and PLX5622 diet–treated mice. C, Representative flow cytometry plots of total CD45+, live, and myeloid (CD11c+ and/or CD11b+) cells that are macrophages (CD64+F4/80+) (top) or monocytes (CSF1R+CD11b+Gr1lo) from the livers of control diet– and PLX5622 diet–treated mice. D-I, Graphs show mean ± SEM of accumulative data (n = 3/group). Graphs show the frequency of myeloid cells that are CD64+F4/80+ macrophages from the (D) spleens, (E) blood, and (F) livers of the indicated treatment groups. Graphs show the frequency of myeloid cells that are CSF1R+CD11b+Gr1lo monocytes from the (G) spleens, (H) blood, and (I) livers of the indicated treatment groups. Data were analyzed by Welch t test (*P < 0.05, **P < 0.01, ***P < 0.001).

References

    1. Li Q, Barres BA. Microglia and macrophages in brain homeostasis and disease. Nat Rev Immunol. 2018;18(4):225–242. - PubMed
    1. Paolicelli RC, Ferretti MT. Function and dysfunction of microglia dur-ing brain development: consequences for synapses and neural cir-cuits. Front Synaptic Neurosci. 2017;9:9. - PMC - PubMed
    1. Parkhurst CN, Yang G, Ninan I, et al. Microglia promote learning-dependent synapse formation through brain-derived neurotrophic factor. Cell. 2013;155(7):1596–1609. - PMC - PubMed
    1. Ayata P, Badimon A, Strasburger HJ, et al. Epigenetic regulation of brain region-specific microglia clearance activity. Nat Neurosci. 2018; 21(8):1049–1060. - PMC - PubMed
    1. Henriques JF, Portugal CC, Canedo T, Relvas JB, Summavielle T, Socodato R. Microglia and alcohol meet at the crossroads: microglia as critical modulators of alcohol neurotoxicity. Toxicol Lett. 2018;283:21–31. - PubMed

Publication types

MeSH terms