. 2020 Mar 12;21(6):1939.
doi: 10.3390/ijms21061939.

Cold Atmospheric Plasma and Silymarin Nanoemulsion Activate Autophagy in Human Melanoma Cells

Affiliations

Cold Atmospheric Plasma and Silymarin Nanoemulsion Activate Autophagy in Human Melanoma Cells

Manish Adhikari et al. Int J Mol Sci. .

Abstract

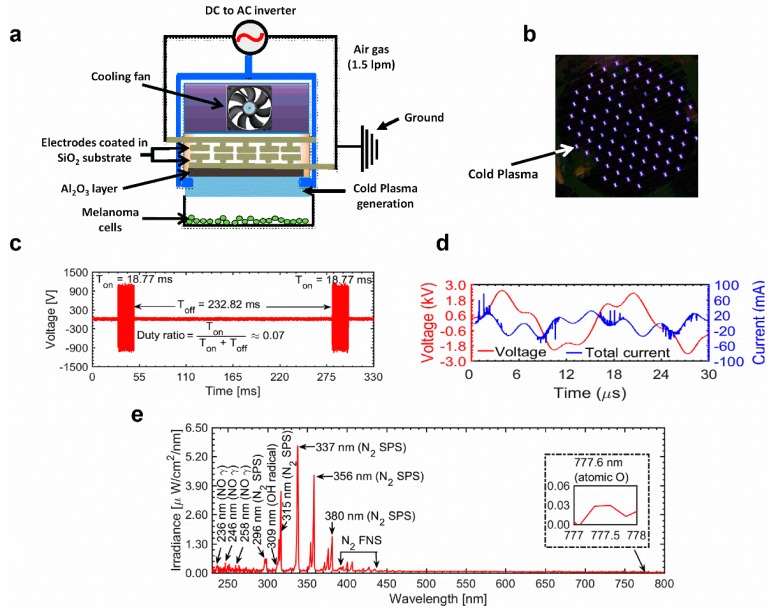
Background: Autophagy is reported as a survival or death-promoting pathway that is highly debatable in different kinds of cancer. Here, we examined the co-effect of cold atmospheric plasma (CAP) and silymarin nanoemulsion (SN) treatment on G-361 human melanoma cells via autophagy induction.

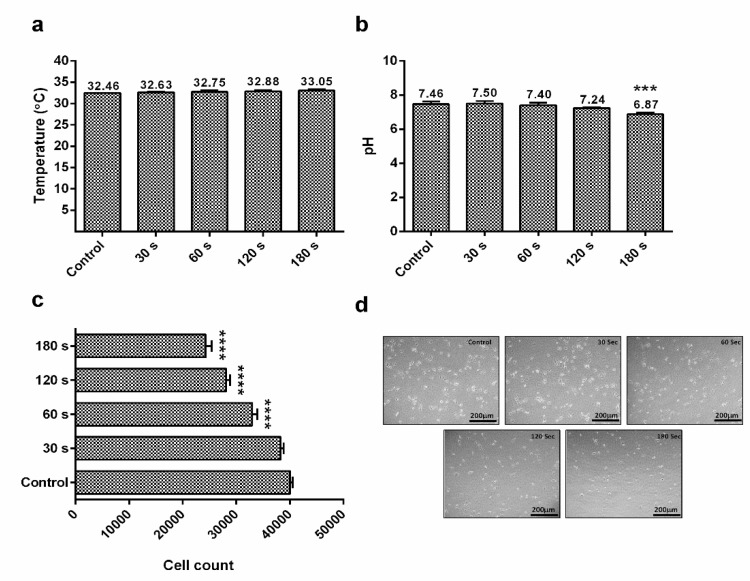
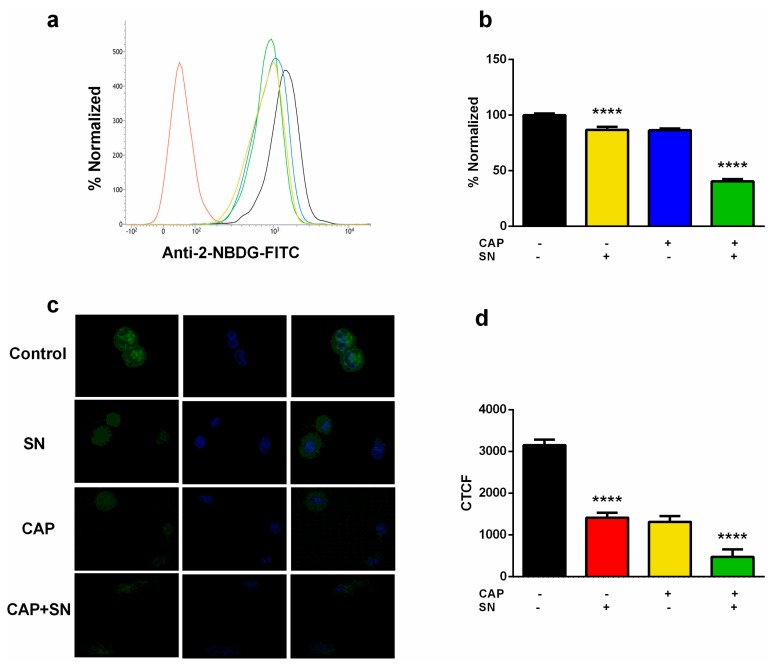
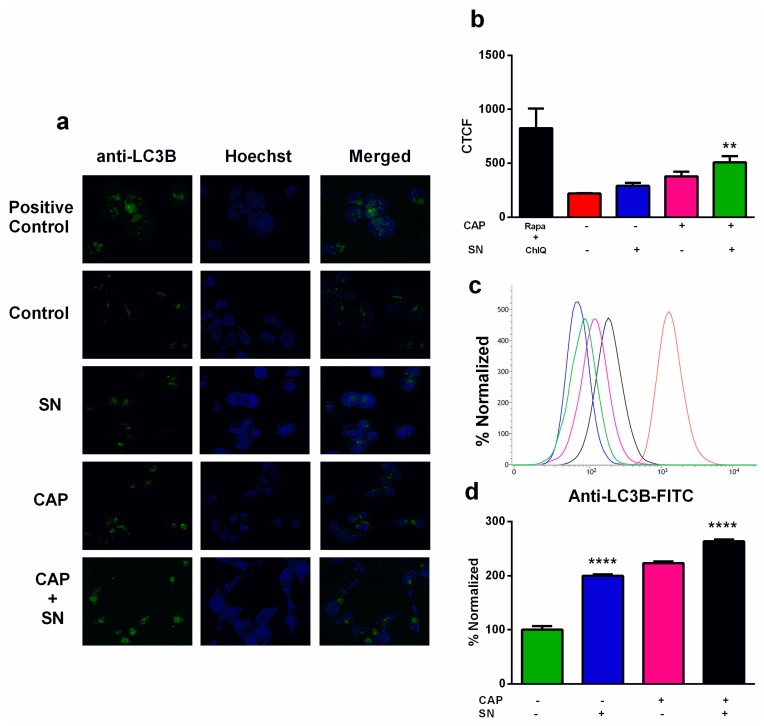
Methods: The temperature and pH of the media, along with the cell number, were evaluated. The intracellular glucose level and PI3K/mTOR and EGFR downstream pathways were assessed. Autophagy-related genes, related transcriptional factors, and autophagy induction were estimated using confocal microscopy, flow cytometry, and ELISA.

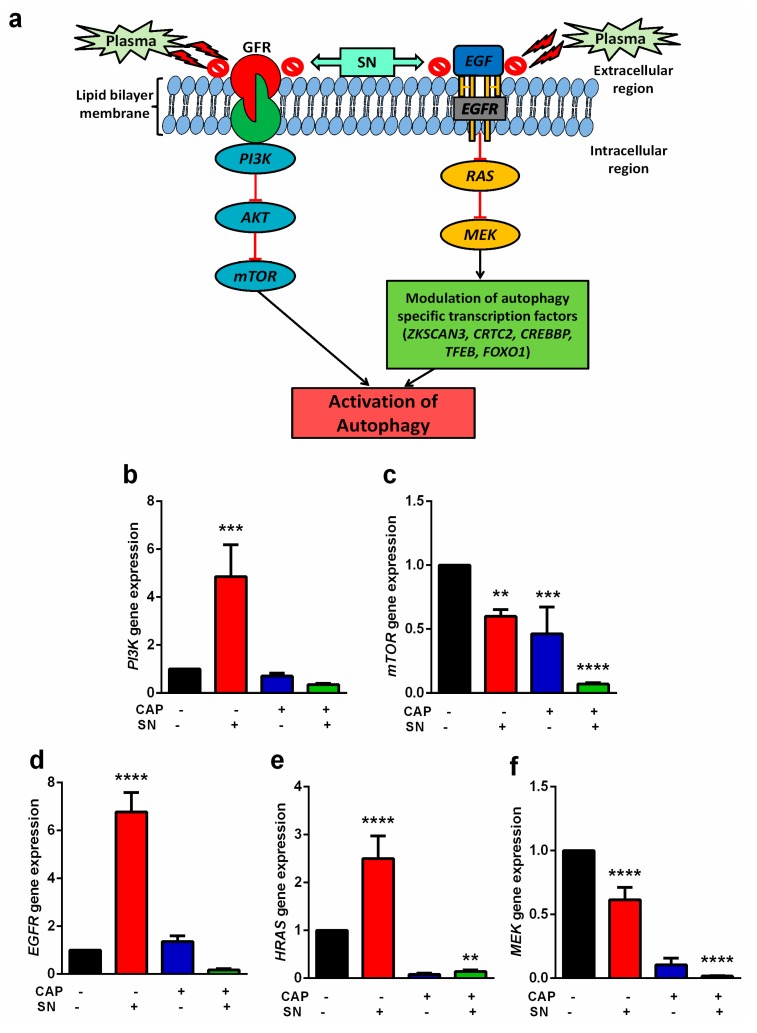
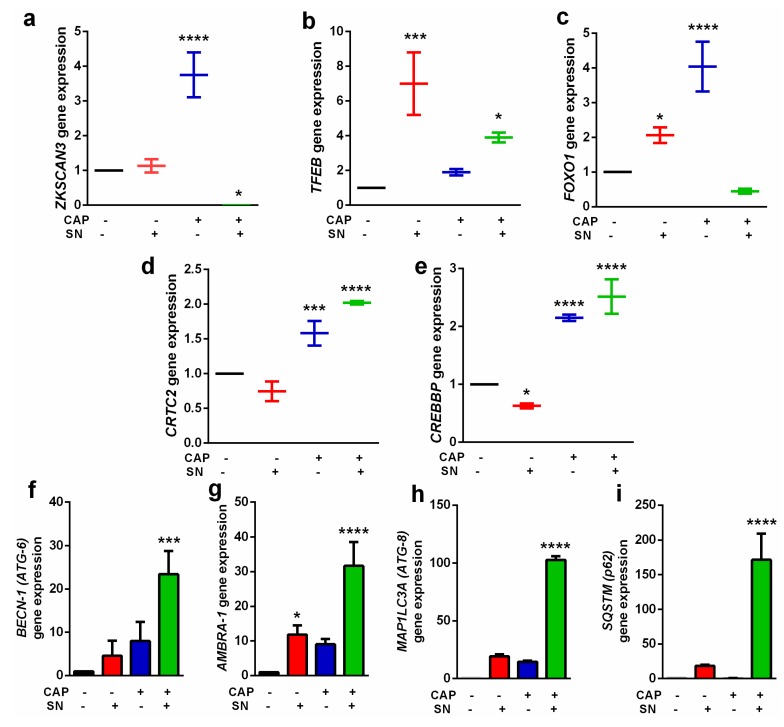
Results: CAP treatment increased the temperature and pH of the media, while its combination with SN resulted in a decrease in intracellular ATP with the downregulation of PI3K/AKT/mTOR survival and RAS/MEK transcriptional pathways. Co-treatment blocked downstream paths of survival pathways and reduced PI3K (2 times), mTOR (10 times), EGFR (5 times), HRAS (5 times), and MEK (10 times). CAP and SN co-treated treatment modulates transcriptional factor expressions (ZKSCAN3, TFEB, FOXO1, CRTC2, and CREBBP) and specific genes (BECN-1, AMBRA-1, MAP1LC3A, and SQSTM) related to autophagy induction.

Conclusion: CAP and SN together activate autophagy in G-361 cells by activating PI3K/mTOR and EGFR pathways, expressing autophagy-related transcription factors and genes.

Keywords: PI3K/mTOR pathway; autophagy; cold atmospheric plasma; silymarin nanoemulsion.


Conflict of interest statement

The authors declare no conflict of interest.

Figures

Figure 1
Figure 1
(a) Schematic diagram of the non-thermal cold atmospheric plasma (CAP) micro-dielectric barrier discharge (μ-DBD) plasma source with a distance of 2 mm from cell culture media. (b) Photograph of the μ-DBD plasma device showing plasma discharge using air as the feeder gas. (c) The μ-DBD device on time (Ton) and off-time (Toff). (d) Voltage and current waveforms for one cycle of the Ton period of the μ-DBD air CAP device. (e) Optical emission spectrum (OES) composition of the air μ-DBD CAP source between 200 nm and 800 nm.
Figure 2
Figure 2
(a) Estimation of temperature within cell media (RPMI-1640) after the exposure of air CAP at different time intervals; (b) effect of different CAP doses on the pH level of cell media; (c) assessment of the G-361 human melanoma cell count using a hemocytometer counter after the exposure of CAP at different time intervals; (d) microscopic evaluation of G-361 human melanoma cells at different CAP doses (scale bar = 200 μm). Data are the mean ± SE of three experiments. Statistical analysis was performed using a one-way ANOVA test followed by Dunnett’s test for comparisons. Each asterisk represents statistical differences between the treatment and control (*** p < 0.001 and **** p < 0.0001).
Figure 3
Figure 3
Estimation of intracellular glucose (ATP level) using fluorescent glucose analog 2-NBDG (a) employing flow cytometry in a bar graph; (b) calculated values in terms of the bar graph; (c) images were taken using confocal microscopy (intensity of green color represents the presence of glucose and blue indicates the nucleus); (d) captured images were expressed terms of Corrected Total Cell Fluorescence (CTCF) in a bar graph form. Data are the mean ± SE of three experiments. Statistical analysis was performed using a one-way ANOVA test followed by Dunnett’s test for comparisons. Each asterisk represents statistical differences between the treatment and control (**** p < 0.0001).
Figure 4
Figure 4
(a) Illustration of the CAP and silymarin nanoemulsion (SN)-mediated hypothesis about the blockage of PI3K/AKT/mTOR and RAS/MEK pathways for the activation of autophagy. Gene analysis of the GFR-mediated downstream expression of the (b) PI3K gene and (c) mTOR gene, and gene analysis of the Epidermal Growth factor (EGF)-mediated downstream expression of the (d) EGFR gene, (e) HRAS gene, and (f) MEK gene. Data are the mean ± SE of three experiments. Statistical analysis was performed using a one-way ANOVA test followed by Dunnett’s test for comparisons. Each asterisk represents statistical differences between the treatment and control (** p < 0.01, *** p < 0.001, and **** p < 0.0001).
Figure 5
Figure 5
Gene expression levels of autophagy-related transcriptional factors: (a) ZKSCAN3 gene; (b) TFEB gene; (c) FOXO1 gene; (d) CRTC2 gene; and (e) CREBBP gene. Expression of various gene levels directly responsible for autophagy: (f) BECN-1 (ATG-6); (g) AMBRA-1; (h) MAP1LC3A (ATG-8); and (i) SQSTM (p62). Data are the mean ± SE of three experiments. Statistical analysis was performed using a one-way ANOVA test followed by Dunnett’s test for comparisons. Each asterisk represents statistical differences between the treatment and control (* p < 0.05, *** p < 0.001, and **** p < 0.0001).
Figure 6
Figure 6
Interpretation of autophagic flux using a kit (Cyto ID® autophagy detection kit) (a) by confocal microscopy (green dots represent autophagic sites within G-361 cells and blue stains signify nuclei); (b) autophagy image intensities were expressed in terms of CTCF values using bar graphs; (c) flow cytometry evaluation of autophagy determination using anti-LC3B FITC-labeled dye; (d) FITC expression for autophagy was expressed in terms of a bar graph. Data are the mean ± SE of three experiments. Statistical analysis was performed using a one-way ANOVA test followed by Dunnett’s test for comparisons. Each asterisk represents statistical differences between the treatment and control (** p < 0.01 and **** p < 0.0001).

References

    1. Yamaguchi Y., Hearing V.J. Melanocytes and their Diseases. Cold Spring Harb. Perspect. Med. 2014;4 doi: 10.1101/cshperspect.a017046. - DOI - PMC - PubMed
    1. Ascierto P.A., Kirkwood J.M., Grob J.J., Simeone E., Grimaldi A.M., Maio M., Palmieri G., Testori A., Marincola F.M., Mozzillo N. The Role of BRAF V600 Mutation in Melanoma. J. Transl. Med. 2012;10:85. doi: 10.1186/1479-5876-10-85. - DOI - PMC - PubMed
    1. Ndoye A., Weeraratna A.T. Autophagy—An Emerging Target for Melanoma Therapy. F1000Res. 2016;5 doi: 10.12688/f1000research.8347.1. - DOI - PMC - PubMed
    1. Lugowska I., Teterycz P., Rutkowski P. Immunotherapy of Melanoma. Contemp. Oncol. (Pozn) 2018;22:61–67. doi: 10.5114/wo.2018.73889. - DOI - PMC - PubMed
    1. Chakraborty R., Wieland C.N., Comfere N.I. Molecular Targeted Therapies in Metastatic Melanoma. Pharmgenomics Pers. Med. 2013;6:49–56. - PMC - PubMed