. 2020 Apr;19(8):870-883.
doi: 10.1080/15384101.2020.1731052. Epub 2020 Mar 16.

LncRNA LEF1-AS1 silencing diminishes EZH2 expression to delay hepatocellular carcinoma development by impairing CEBPB-interaction with CDCA7

Affiliations

LncRNA LEF1-AS1 silencing diminishes EZH2 expression to delay hepatocellular carcinoma development by impairing CEBPB-interaction with CDCA7

Jun Gao et al. Cell Cycle. 2020 Apr.

Abstract

Hepatocellular carcinoma (HCC) is recognized for its high mortality rate worldwide. Based on intensive studies, long non-coding RNA (lncRNA) expression exerts significant effects on tumor suppression. Herein, we investigated the molecular mechanism of lymphoid enhancer-binding factor-1 antisense RNA 1 (LEF1-AS1) in HCC cells. Microarray-based gene expression analysis was adopted to predict and verify the differentially expressed genes in HCC, which predicted cell division cycle-associated 7 (CDCA7) and LEF1-AS1 to be highly expressed in HCC. The expression of LEF1-AS1, CDCA7, CCAAT/enhancer-binding protein beta (CEBPB) and enhancer of zeste homolog 2 (EZH2) was determined by means of reverse transcription quantitative polymerase chain reaction (RT-qPCR) and western blot analysis. LncMap was used to predict the lncRNA-transcription factor-gene interaction in HCC. ChIP, RIP assay and dual luciferase reporter gene assay were employed to verify the relationship between the transcription factor and gene. Silencing of LEF1-AS1 could downregulate CDCA7 expression through CEBPB. Overexpression of LEF1-AS1, EZH2 and CDCA7 promoted proliferation and invasion in HCC cells. LEF1-AS1 promoted CDCA7 expression to further upregulate EZH2. Tumor formation in nude mice was assessed to verify the experimental results. Silencing of LEF1-AS1 inhibited the growth of tumors in vivo. Collectively, silencing LEF1-AS1 inhibited the proliferation and invasion of HCC cells by down-regulating EZH2 through the CEBPB-CDCA7 signaling pathway, which provides scientific evidence for the treatment of HCC.Abbreviations: HCC: Hepatocellular carcinoma; lncRNA: long non-coding RNA; LEF1-AS1: lymphoid enhancer-binding factor-1 antisense RNA 1; EZH2: enhancer of zeste homolog 2; CDCA7: cell division cycle-associated 7; GEO: Gene Expression Omnibus; NC: negative control; oe: overexpressed; RT-qPCR: reverse transcription quantitative polymerase chain reaction; PBS: phosphate buffered saline; HRP: horseradish peroxidase; OD: optical density; RIP: Radioimmunoprecipitation; ChIP: Chromatin immunoprecipitation; WT: wild type.

Keywords: CDCA7; CEBPB; EZH2; LEF1-AS1; hepatocellular carcinoma; invasion; proliferation; transcription factor.


Figures

Figure 1.
Figure 1.
HCC tissues show higher expression of CDCA7 and LEF1-AS1, which might be involved in the HCC progression. (a) Expression of lncRNA LEF1-AS1 in HCC in Starbase database. The X axis represents the gene expression, and the Y axis represents grouping information. (b) Expression of CDCA7 in HCC microarray GSE45267. (c) Expression of CDCA7 in HCC in Starbase database. The X axis represents the gene expression, and the Y axis represents grouping information. (d) the Kaplan Meier survival analysis of CDCA7 gene for the difference of survival rate between high expression group and low expression group. The X axis represents the observation time, and the Y axis represents the survival rate. (e) The expression of the CDCA7 gene in various solid tumors; blue indicates the gene expression in the normal tissue and red indicates the gene expression in the tumor tissue. (f) Expression of LEF1-AS1 and CDCA7 as determined by RT-qPCR in liver samples in comparison to the adjacent normal tissues of 80 patients with HCC. (g) LEF1-AS1 expression in HCC determined by in situ hybridization (400 ×). (h), CDCA7 expression in HCC determined by immunohistochemistry (400 ×). The data were analyzed by means of the paired t test. *p < 0.05.
Figure 2.
Figure 2.
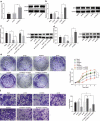
LEF1-AS1 and CDCA7 are highly expressed in HCC cells and promote cell proliferation and invasion. (a) LEF1-AS1 and CDCA7 expression in HepG2 cells as determined by RT-qPCR and Western blot analysis, normalized to GAPDH. (b) Knockdown effect of LEF1-AS1 and CDCA7 determined by RT-qPCR and Western blot analysis respectively, normalized to GAPDH. (c and d) Cell proliferation and colony formation assays after silencing LEF1-AS1 and CDCA7, respectively. (e and f) Cell invasion ability determined by Transwell assay after silencing LEF1-AS1 and CDCA7, respectively (200 ×). *p < 0.05. The t-test was adopted for data analysis between the two groups, one-way ANOVA was adopted for data analysis among multiple groups, and two-way ANOVA was adopted for data analysis at different time points. The experiment was repeated three times independently.
Figure 3.
Figure 3.
LEF1-AS1 recruits CEBPB to upregulate CDCA7 expression and HCC cell proliferation and invasion. (a) The enrichment of LEF1-AS1 by CEBPB or IgG verified by RIP assay. (b) the transfection efficiency of CEBPB determined by RT-qPCR and Western blot analysis, normalized to GAPDH. HCC cells were treated with sh-CEBPB or oe-CEBPB in the presence of sh-LEF1-AS1. (c) The mRNA and protein expression levels of CDCA7 determined by RT-qPCR and Western blot analysis, normalized to GAPDH. (d) Prediction of the binding sites between CEBPB and CDCA7 through microarray-based gene expression analysis. (e) CEBPB enrichment in the CDCA7 promoter region as determined by ChIP assay. (f) The fluorescence intensity of CEBPB in the CDCA7 promoter region as determined by dual luciferase reporter gene assay. (g) The cell proliferation determined by MTT and colony formation assays. (h) Cell invasion determined by Transwell assay (200 ×). *p < 0.05. The t-test was adopted for data analysis between the two groups, one-way ANOVA was adopted for data analysis among multiple groups, and two-way ANOVA was adopted for data analysis at different time points. The experiment was repeated three times independently.
Figure 4.
Figure 4.
LEF1-AS1 silencing blocks cell proliferation and invasion by down-regulating EZH2 through the CEBPB-CDCA7 signaling pathway. (a) CDCA7 expression in cells after overexpression of CDCA7 by RT-qPCR and Western blot analysis. (b) EZH2 expression in cells with silenced and overexpressed CDCA7 as determined by RT-qPCR and Western blot analysis. HCC cells were treated with sh-CDCA7 or oe-CDCA7 in the presence of sh-LEF1-AS1. (c) EZH2 expression in cells determined by RT-PCR and Western blot analysis. (d) EZH2 expression in cells with silenced or overexpressed EZH2 determined by RT-qPCR and Western blot analysis. (e) The cell proliferation determined by MTT and colony formation assays. (f) Cell invasion determined by Transwell assay (200 ×). *p < 0.05. Relative expression of CDCA7 and EZH2 was normalized to GAPDH. One-way ANOVA was adopted for data analysis among multiple groups, and two-way ANOVA was adopted for data analysis at different time points. The experiment was repeated three times independently.
Figure 5.
Figure 5.
Tumorigenesis of human HCC cells is inhibited by LEF1-AS1 silencing through mediation of the CEBPB/CDCA7/EZH2 axis. (a) Growth curve of tumors that developed in nude mice injected subcutaneously with HepG2 cells bearing sh-NC or sh-LEF1-AS1. (b) Representative micrographs and tumor weight. (c) Relative expression of LEF1-AS1 determined by RT-qPCR. (d) HE staining of the pathological changes of tumors (200 ×). (e) Immunohistochemistry of CDCA7 and EZH2 expression in tumors (400 ×). *p < 0.05. In panel a, two-way ANOVA was adopted for data analysis. In panel b and c, unpaired t test was adopted for data analysis. The cell experiment was conducted 3 times independently.
Figure 6.
Figure 6.
A schematic diagram depicting the regulatory mechanism underlying LEF1-AS1 as an oncogene in HCC. LEF1-AS1 and CDCA7 in HCC are highly expressed. LEF1-AS1 can promote the expression of CDCA7 by recruiting CEBPB, and increase the expression of EZH2 to facilitate cell proliferation and invasion, and ultimately facilitate the progression of HCC.

Similar articles

Cited by

References

    1. Schulze K, Imbeaud S, Letouze E, et al. Exome sequencing of hepatocellular carcinomas identifies new mutational signatures and potential therapeutic targets. Nat Genet. 2015. May;47(5):505–511. PubMed PMID: 25822088. - PMC - PubMed
    1. Sherman M. Hepatocellular carcinoma: epidemiology, surveillance, and diagnosis. Semin Liver Dis. 2010. February;30(1):3–16. PubMed PMID: 20175029. - PubMed
    1. Zimonjic DB, Popescu NC. Role of DLC1 tumor suppressor gene and MYC oncogene in pathogenesis of human hepatocellular carcinoma: potential prospects for combined targeted therapeutics (review). Int J Oncol. 2012. August;41(2):393–406. PubMed PMID: 22580498. - PMC - PubMed
    1. Zhang R, Xia LQ, Lu WW, et al. LncRNAs and cancer. Oncol Lett. 2016. August;12(2):1233–1239. PubMed PMID: 27446422. - PMC - PubMed
    1. Liu H, Li J, Koirala P, et al. Long non-coding RNAs as prognostic markers in human breast cancer. Oncotarget. 2016. April 12;7(15):20584–20596. PubMed PMID: 26942882. - PMC - PubMed

Publication types

MeSH terms