Comparative Study
. 2020 Mar 16;17(1):23.
doi: 10.1186/s12987-020-00185-5.

In vitro and numerical simulation of blood removal from cerebrospinal fluid: comparison of lumbar drain to Neurapheresis therapy

Affiliations
Comparative Study

In vitro and numerical simulation of blood removal from cerebrospinal fluid: comparison of lumbar drain to Neurapheresis therapy

Mohammadreza Khani et al. Fluids Barriers CNS. .

Abstract

Background: Blood removal from cerebrospinal fluid (CSF) in post-subarachnoid hemorrhage patients may reduce the risk of related secondary brain injury. We formulated a computational fluid dynamics (CFD) model to investigate the impact of a dual-lumen catheter-based CSF filtration system, called Neurapheresis™ therapy, on blood removal from CSF compared to lumbar drain.

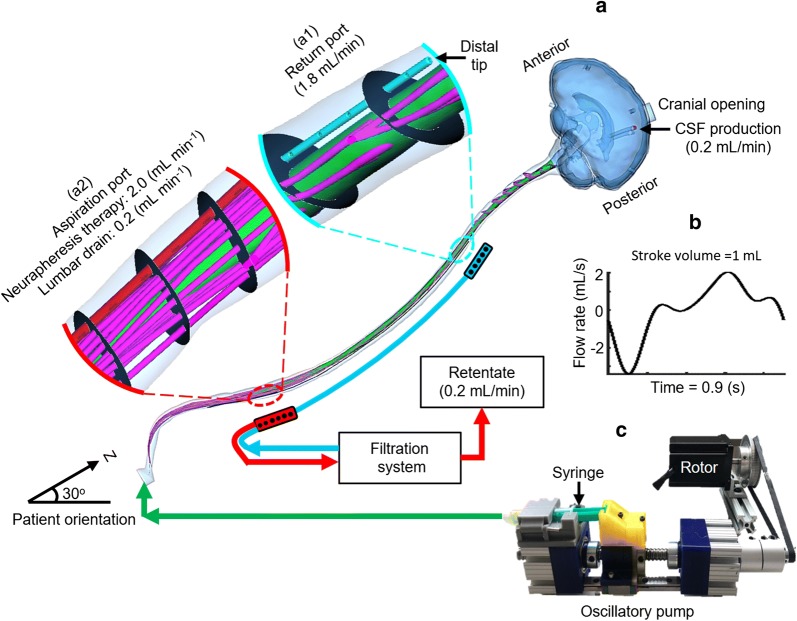
Methods: A subject-specific multiphase CFD model of CSF system-wide solute transport was constructed based on MRI measurements. The Neurapheresis catheter geometry was added to the model within the spinal subarachnoid space (SAS). Neurapheresis flow aspiration and return rate was 2.0 and 1.8 mL/min, versus 0.2 mL/min drainage for lumbar drain. Blood was modeled as a bulk fluid phase within CSF with a 10% initial tracer concentration and identical viscosity and density as CSF. Subject-specific oscillatory CSF flow was applied at the model inlet. The dura and spinal cord geometry were considered to be stationary. Spatial-temporal tracer concentration was quantified based on time-average steady-streaming velocities throughout the domain under Neurapheresis therapy and lumbar drain. To help verify CFD results, an optically clear in vitro CSF model was constructed with fluorescein used as a blood surrogate. Quantitative comparison of numerical and in vitro results was performed by linear regression of spatial-temporal tracer concentration over 24-h.

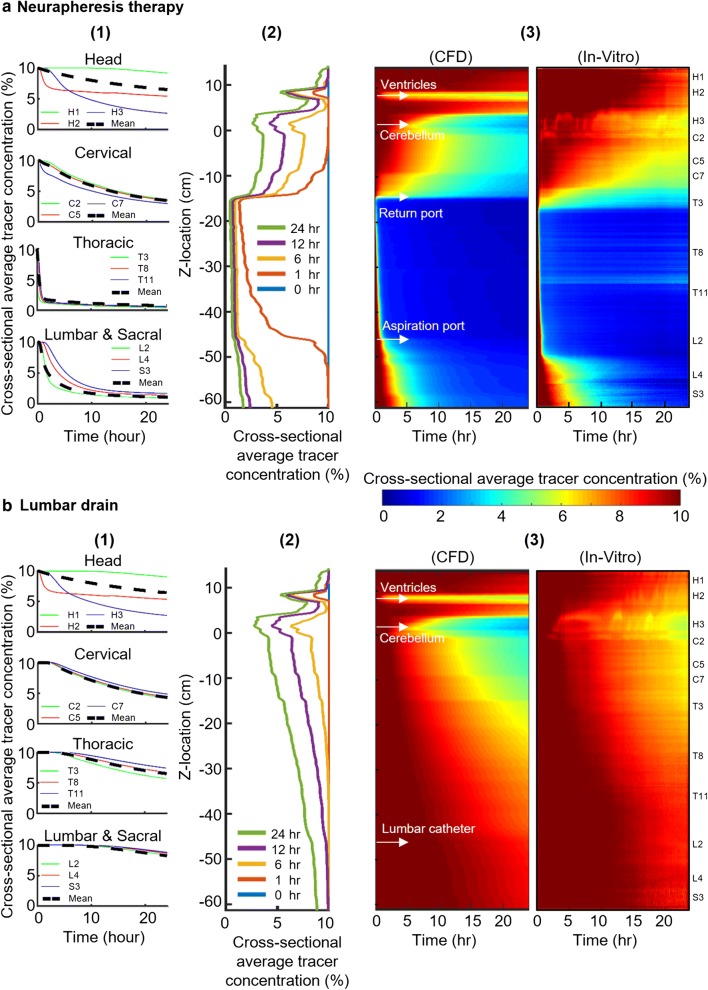
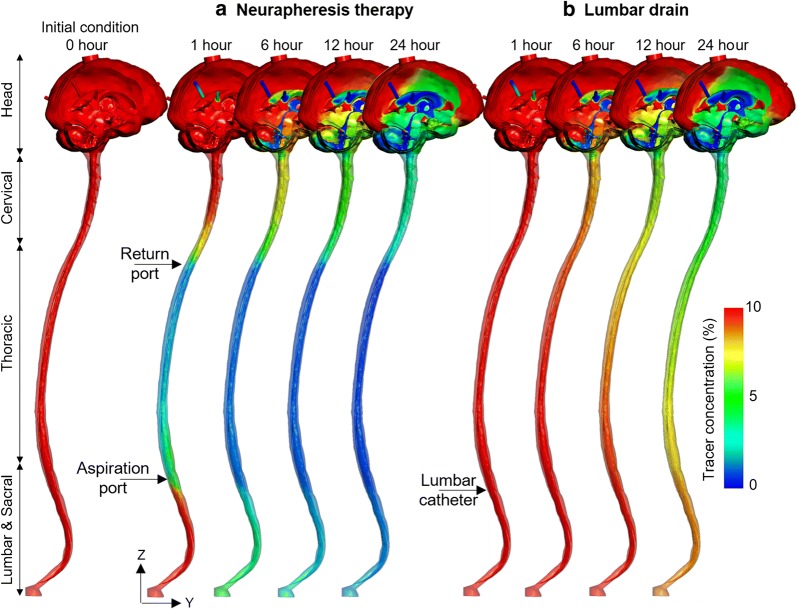
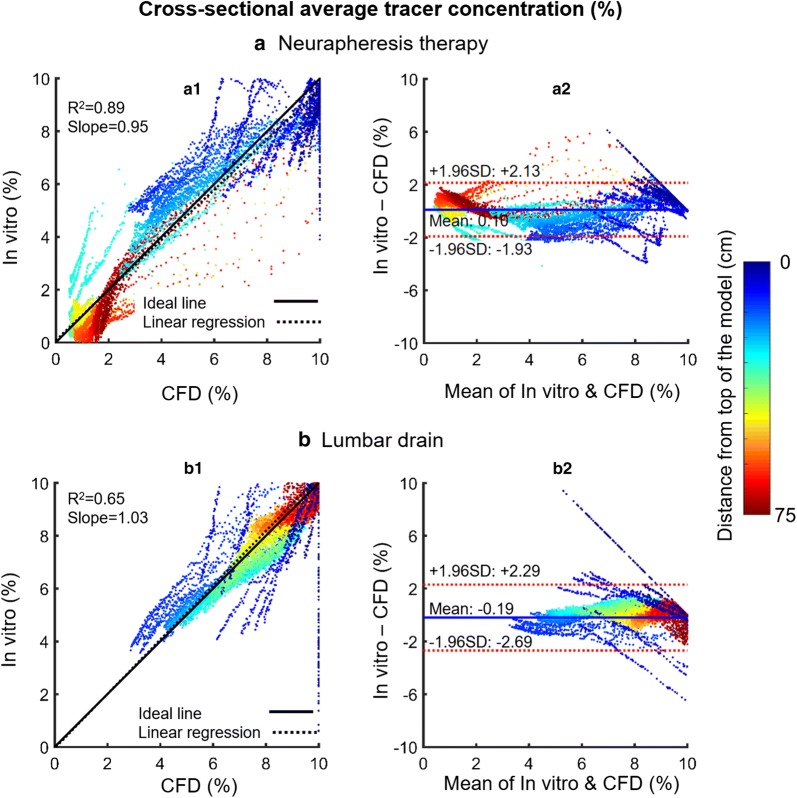
Results: After 24-h, tracer concentration was reduced to 4.9% under Neurapheresis therapy compared to 6.5% under lumbar drain. Tracer clearance was most rapid between the catheter aspiration and return ports. Neurapheresis therapy was found to have a greater impact on steady-streaming compared to lumbar drain. Steady-streaming in the cranial SAS was ~ 50× smaller than in the spinal SAS for both cases. CFD results were strongly correlated with the in vitro spatial-temporal tracer concentration under Neurapheresis therapy (R2 = 0.89 with + 2.13% and - 1.93% tracer concentration confidence interval).

Conclusion: A subject-specific CFD model of CSF system-wide solute transport was used to investigate the impact of Neurapheresis therapy on tracer removal from CSF compared to lumbar drain over a 24-h period. Neurapheresis therapy was found to substantially increase tracer clearance compared to lumbar drain. The multiphase CFD results were verified by in vitro fluorescein tracer experiments.

Keywords: Cerebrospinal fluid filtration; Computational fluid dynamics; In-vitro model; Multiphase simulation; Neurapheresis therapy; Subarachnoid hemorrhage.


Conflict of interest statement

BAM has received research funding from Biogen Inc., KBR Wyle, Alcyone Lifesciences Inc., Minnetronix Inc., and Voyager Therapeutics.

Figures

Fig. 1
Fig. 1
Overview of in vitro and numerical model based on subject specific MRI measurements. a T2-weighted MR image of the entire CSF space for the human analyzed to acquire subject-specific anatomy and natural CSF pulsations. b An in vitro bench-top model of the human CSF filled spaces was generated from MRI images, (b1–2) in vitro model spinal canal including nerve roots and cauda equina. c computational model of the human central nervous system (c1) magnification of the cranial SAS consisting of lateral ventricles, foramen Monro (left and right), third ventricle, aqueduct of Sylvius, 4th ventricle, foramen Luschka, cisterna magna, pre-pontine and pontine cistern, trigeminal cistern, quadrigeminal cistern, Sylvian cisterns (left and right), and cortical subarachnoid space. (c2) Volumetric and surface mesh visualization with prism layers near the wall
Fig. 2
Fig. 2
Schematic of the Neurapheresis system and study protocol. a Three-dimensional CFD model of the SAS with flow boundary conditions and magnified view of the Neurapheresis catheter return and aspiration ports. b Oscillatory pump to induce CSF pulsations to match the CSF flow field acquired by phase contrast-MRI
Fig. 3
Fig. 3
Hydrodynamic and geometric characterization of the computational domain in relation to distance from the foramen magnum (FM). a Hydraulic diameter (Left axis) and Womersley number (right axis), b mean velocity of CSF, c cross-sectional area, d cross-sectional perimeter of the subarachnoid space, and e Reynolds number
Fig. 4
Fig. 4
Quantification of steady-streaming velocities. Steady-streaming within the spinal SAS increases with Neurapheresis therapy compared to lumbar drain. a Coronal view of cyclic mean z-velocity profiles, Uz-mean, in the cranial SAS is nearly identical for Neurapheresis therapy and lumbar drain. b Sagittal view of cyclic mean z-velocity profiles, Uz-mean, simulated by CFD for lumbar drain (left) and Neurapheresis therapy (right). c Steady-streaming velocity magnitude, Uss, and d non-dimensional fraction of flow rate amplitude, Qss
Fig. 5
Fig. 5
Cross-sectional average tracer concentration over 24-h. a Neurapheresis therapy and b lumbar drain. (a1) Cross-sectional average tracer concentration plotted with respect to time at specific axial locations under Neurapheresis therapy. (a2) Cross-sectional average tracer concentration along the neuroaxis for different time points, t = 0, 1, 6, 12, and 24 h under Neurapheresis therapy. (a3) spatial temporal plot for cross-sectional average tracer concentration for CFD and in vitro under Neurapheresis therapy along the model for 24-h. (b1) Cross-sectional average tracer concentration plotted with respect to time at specific axial locations under lumbar drain. (b2) Average tracer concentration along the neuroaxis for different time points, t = 0, 1, 6, 12, and 24 h under lumbar drain. (b3) spatial temporal plot for cross-sectional average tracer concentration for CFD and in vitro under lumbar drain along the model for 24-h
Fig. 6
Fig. 6
CFD results for 2D tracer concentration profiles versus time under Neurapheresis therapy and lumbar drain. a Visualization of tracer concentration at 0, 1, 6, 12, and 24 h under Neurapheresis therapy, and b visualization of tracer concentration at 1, 6, 12, and 24 h under lumbar drain
Fig. 7
Fig. 7
Correlation and Bland–Altman plots for agreement of in vitro and numerical simulation results for spatial–temporal cross-sectional average tracer concentration over 24-h. a Neurapheresis therapy and b lumbar drain. The linear regression is shown in black dashed line (left subplots, a1 and b1) and the limit of agreement (95% confidence intervals) lines are shown in dashed lines (right subplots, a2 and b2)

Similar articles

Cited by

References

    1. Wright BL, Lai JT, Sinclair AJ. Cerebrospinal fluid and lumbar puncture: a practical review. J Neurol. 2012;259(8):1530–1545. doi: 10.1007/s00415-012-6413-x. - DOI - PubMed
    1. Del Bigio MR. Ependymal cells: biology and pathology. Acta Neuropathol. 2010;119(1):55–73. doi: 10.1007/s00401-009-0624-y. - DOI - PubMed
    1. Sakka L, Coll G, Chazal J. Anatomy and physiology of cerebrospinal fluid. Eur Ann Otorhinolaryngol Head Neck Dis. 2011;128(6):309–316. doi: 10.1016/j.anorl.2011.03.002. - DOI - PubMed
    1. Brodbelt A, Stoodley M. CSF pathways: a review. Br J Neurosurg. 2007;21(5):510–520. doi: 10.1080/02688690701447420. - DOI - PubMed
    1. Engelhardt B, Coisne C. Fluids and barriers of the CNS establish immune privilege by confining immune surveillance to a two-walled castle moat surrounding the CNS castle. Fluids Barriers CNS. 2011;8(1):4. doi: 10.1186/2045-8118-8-4. - DOI - PMC - PubMed

Publication types