. 2020 Jul;159(1):306-319.e12.
doi: 10.1053/j.gastro.2020.03.018. Epub 2020 Mar 14.

Combination of PD-1 Inhibitor and OX40 Agonist Induces Tumor Rejection and Immune Memory in Mouse Models of Pancreatic Cancer

Affiliations

Combination of PD-1 Inhibitor and OX40 Agonist Induces Tumor Rejection and Immune Memory in Mouse Models of Pancreatic Cancer

Ying Ma et al. Gastroenterology. 2020 Jul.

Abstract

Background & aims: Advanced pancreatic ductal adenocarcinoma (PDAC) is resistant to therapy, including immune checkpoint inhibitors. We evaluated the effects of a neutralizing antibody against programmed cell death 1 (PD-1) and an agonist of OX40 (provides a survival signal to activated T cells) in mice with pancreatic tumors.

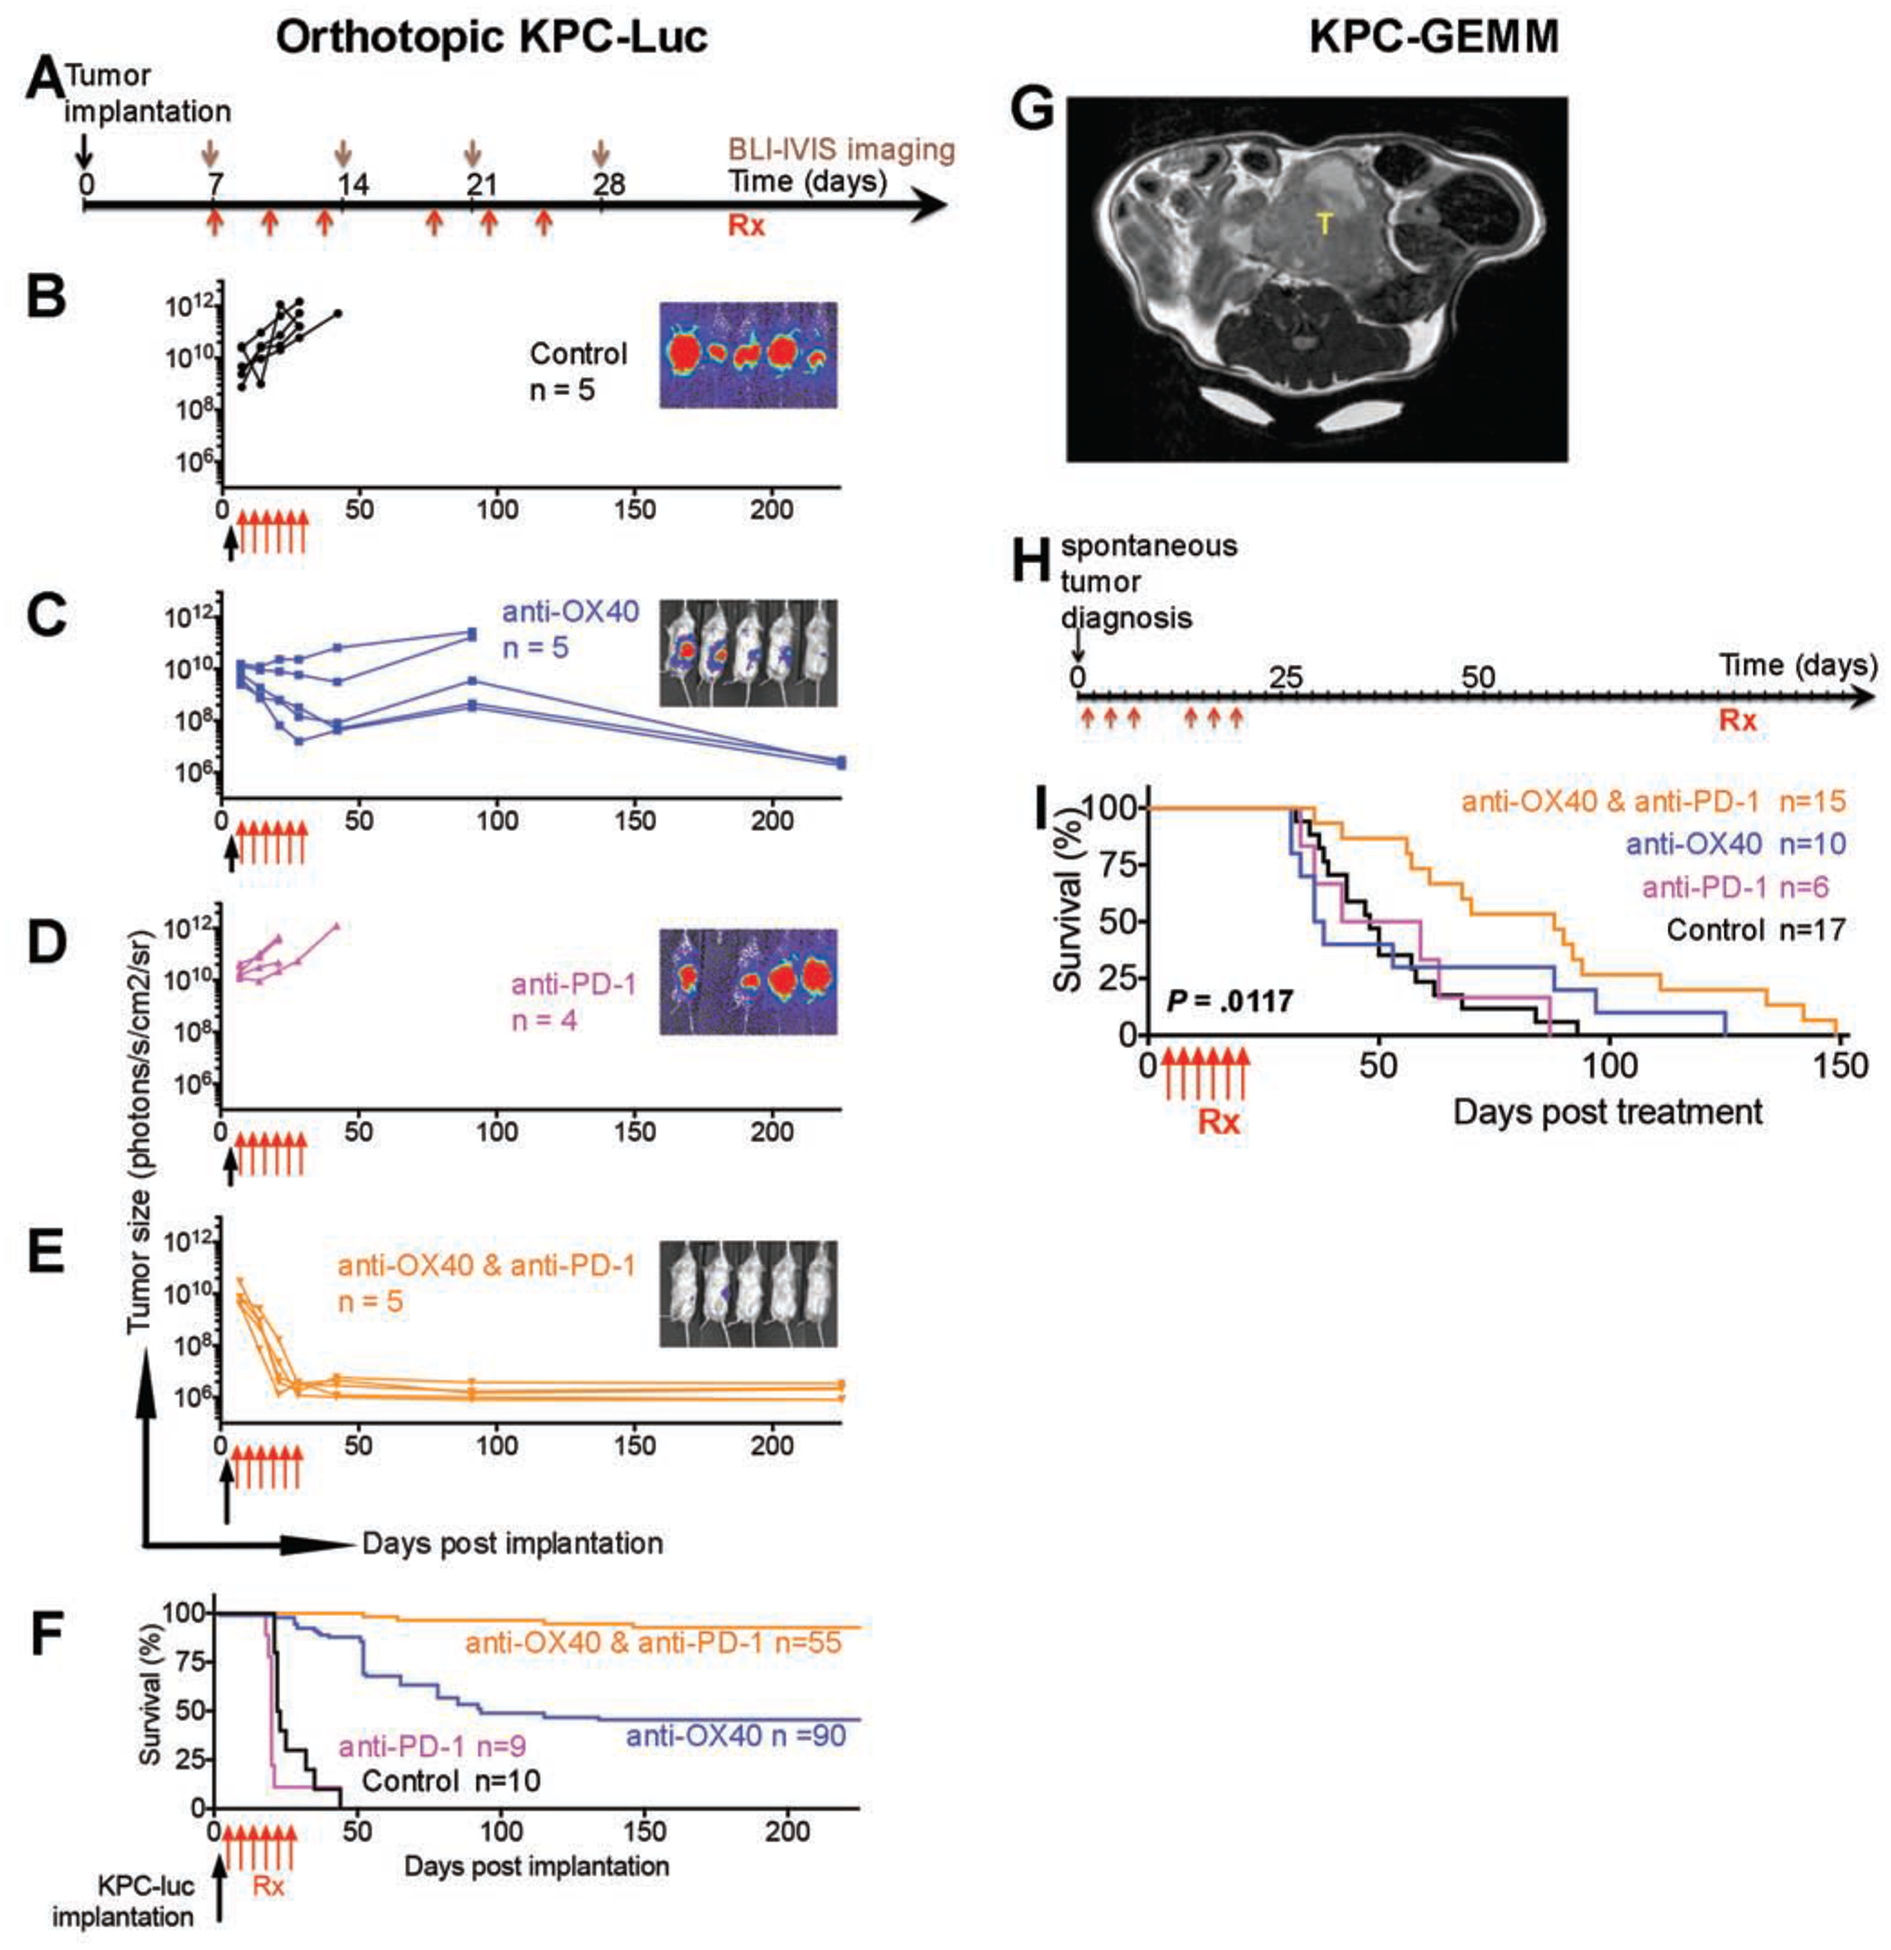
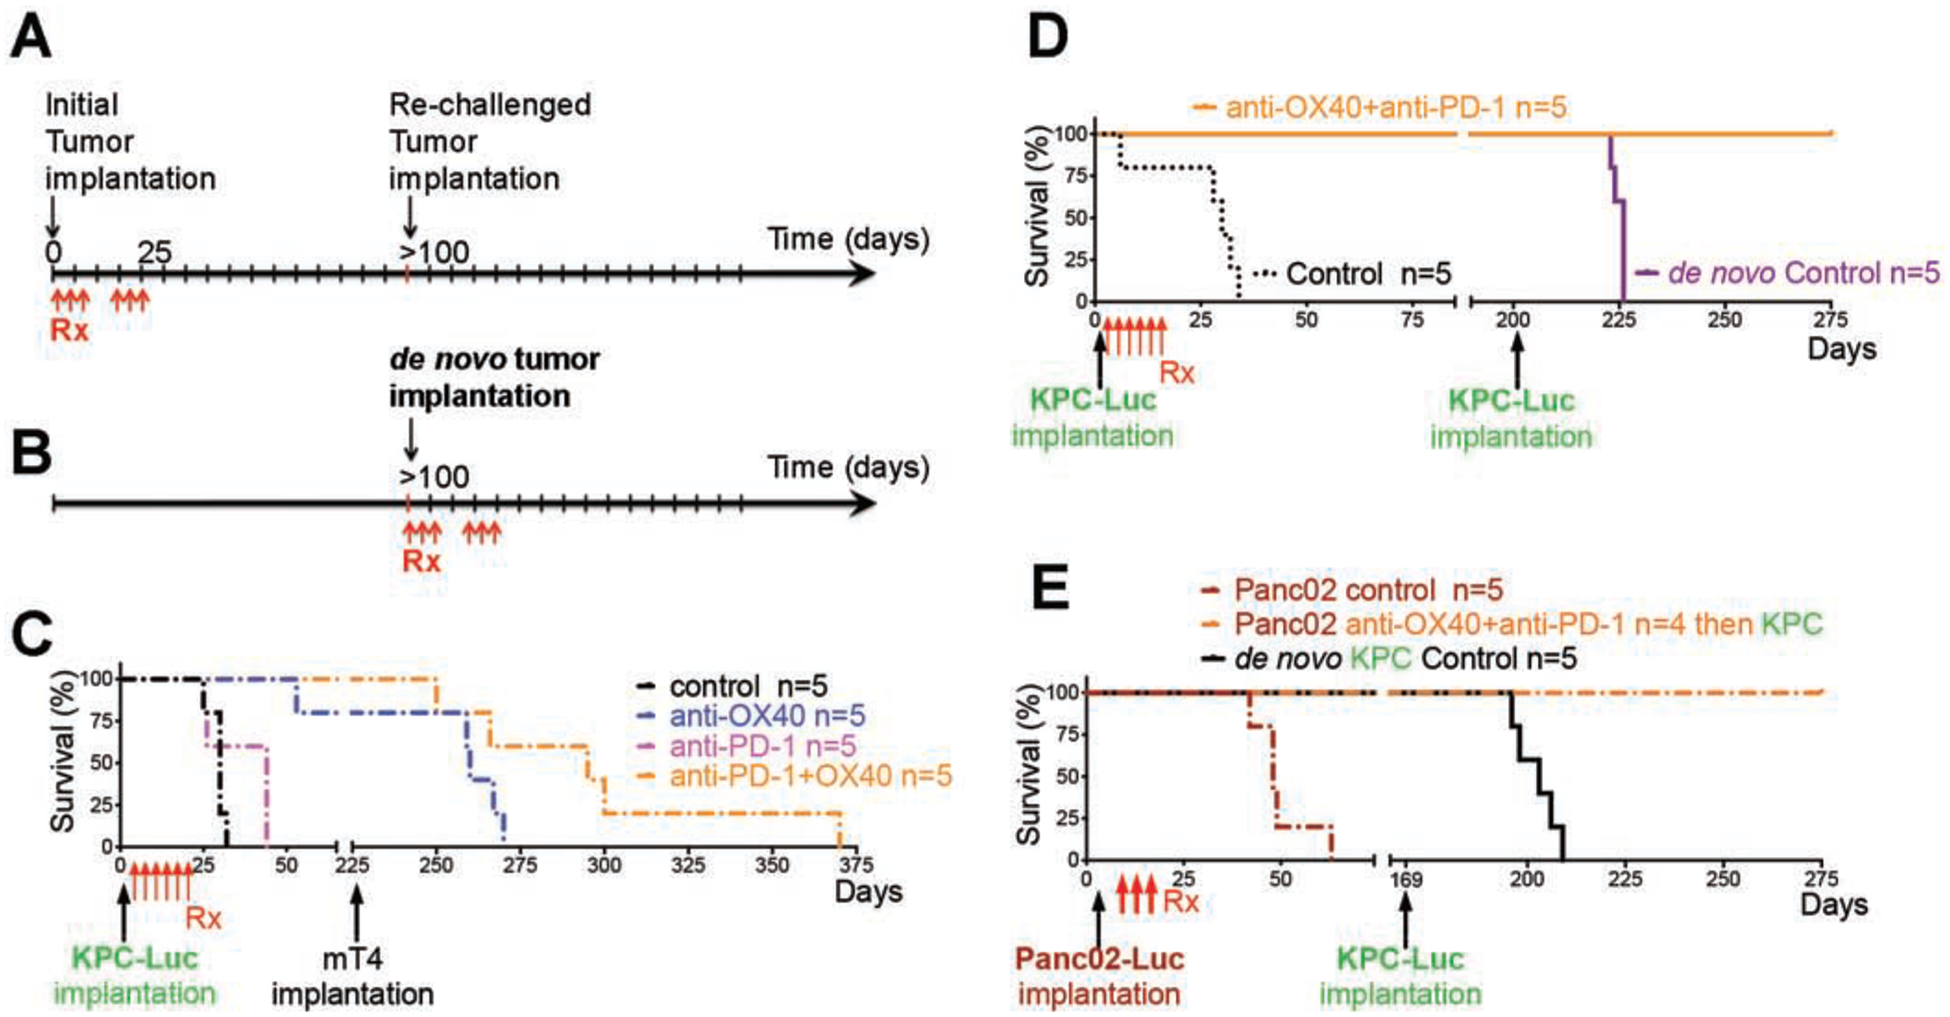
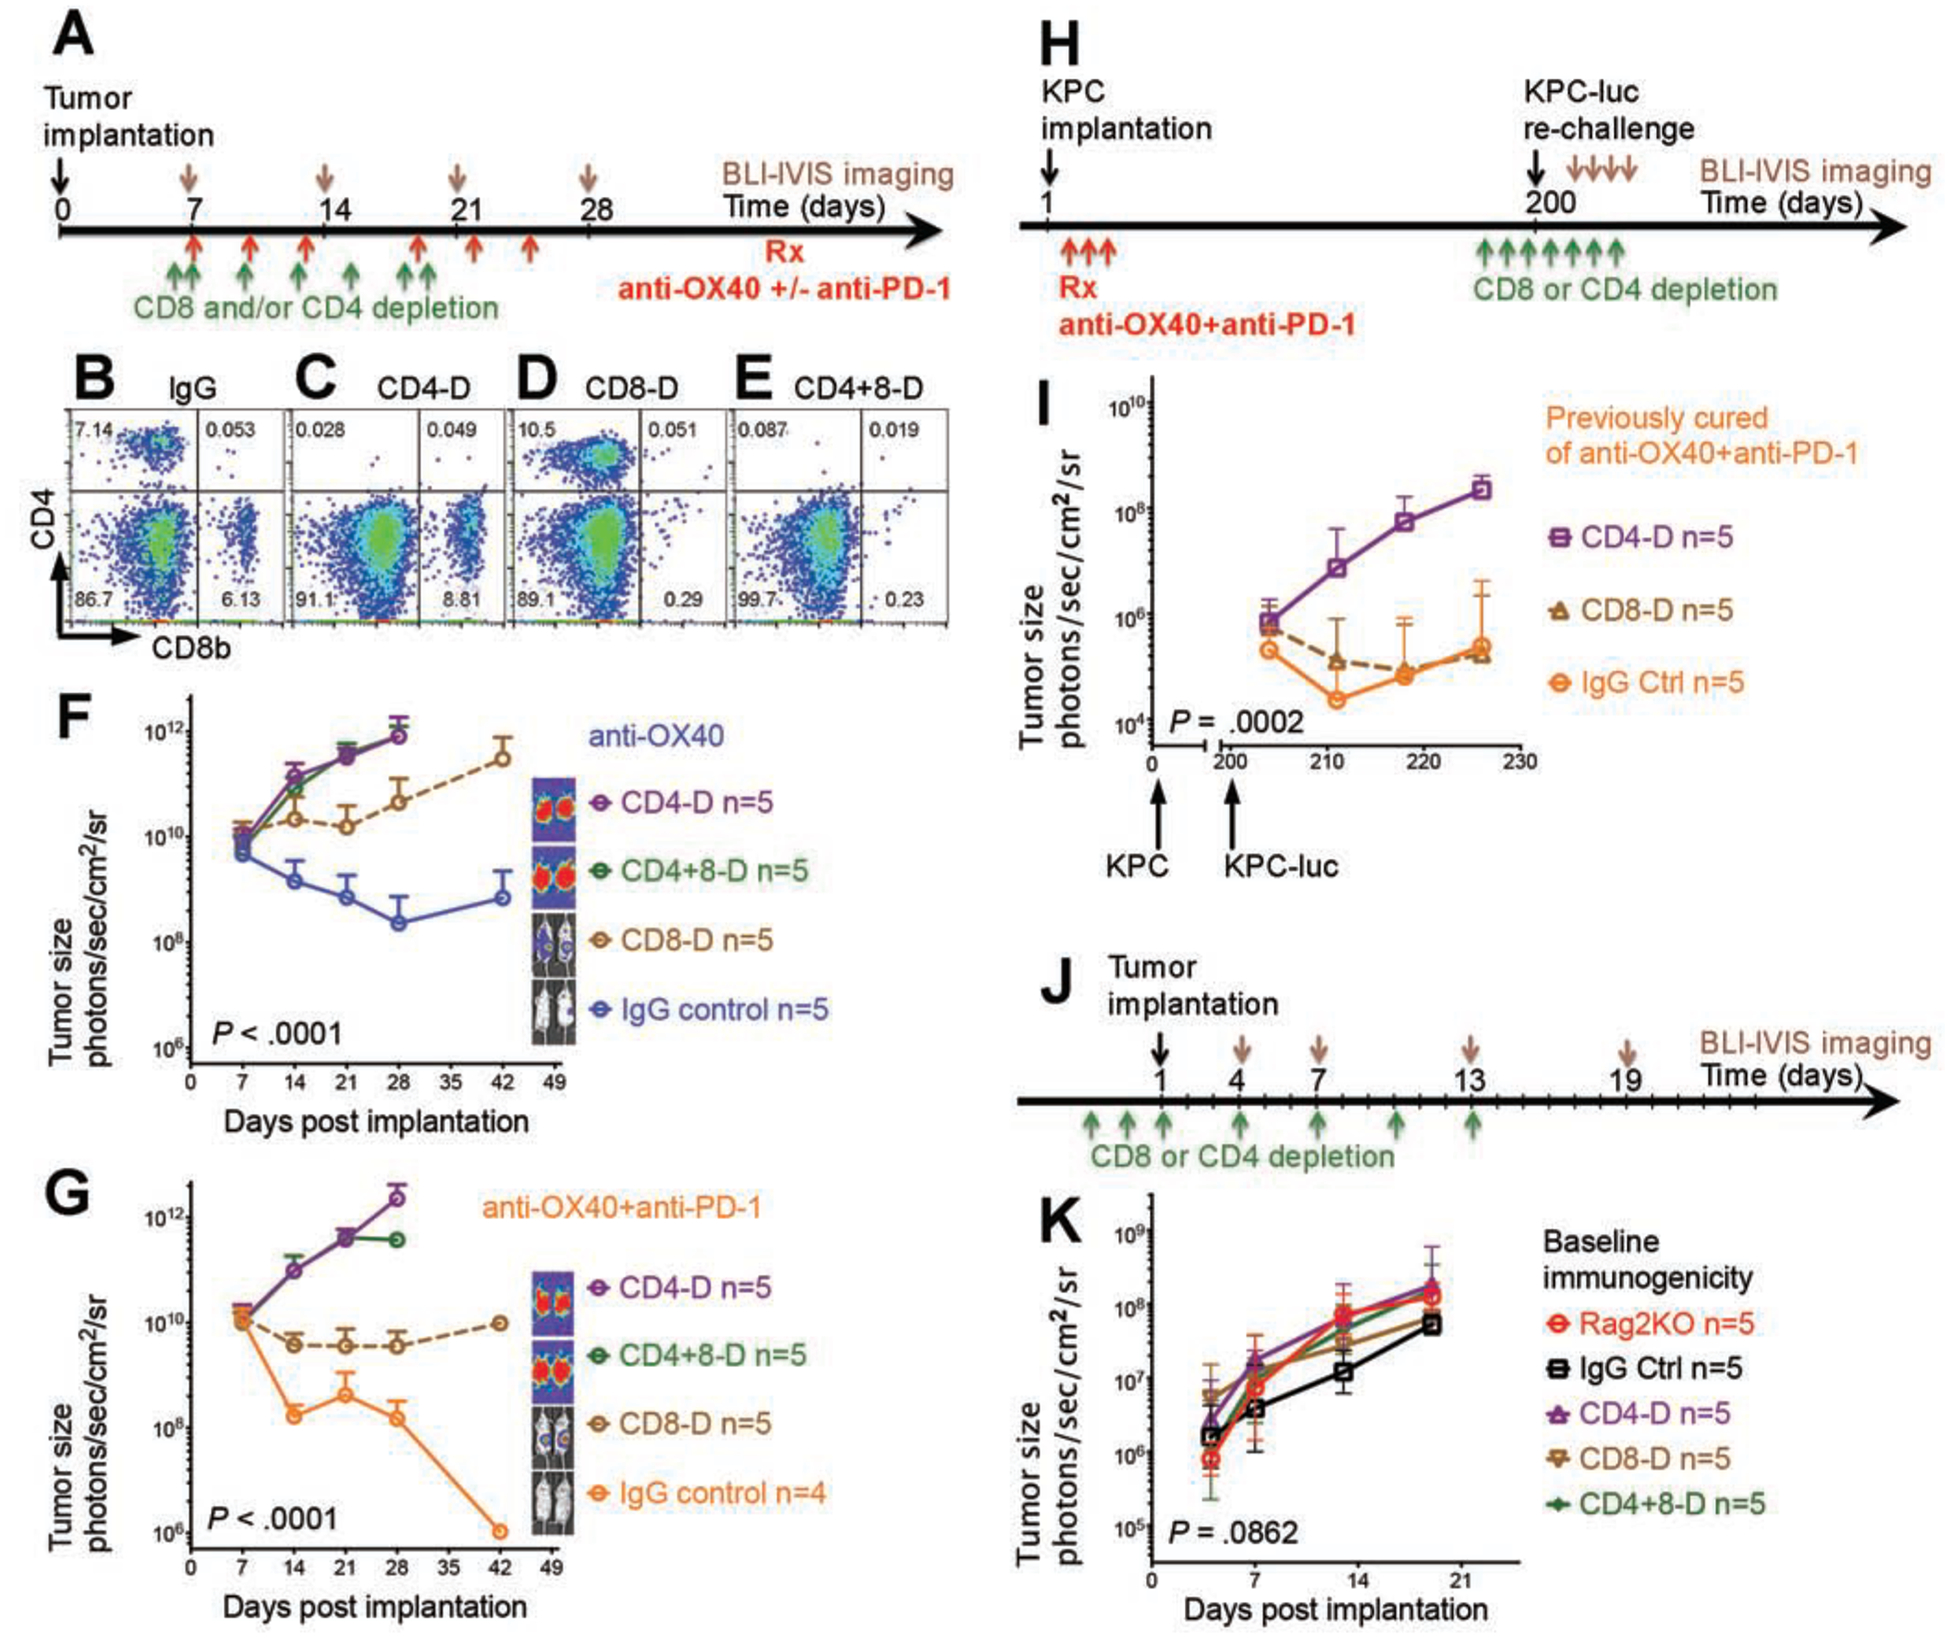
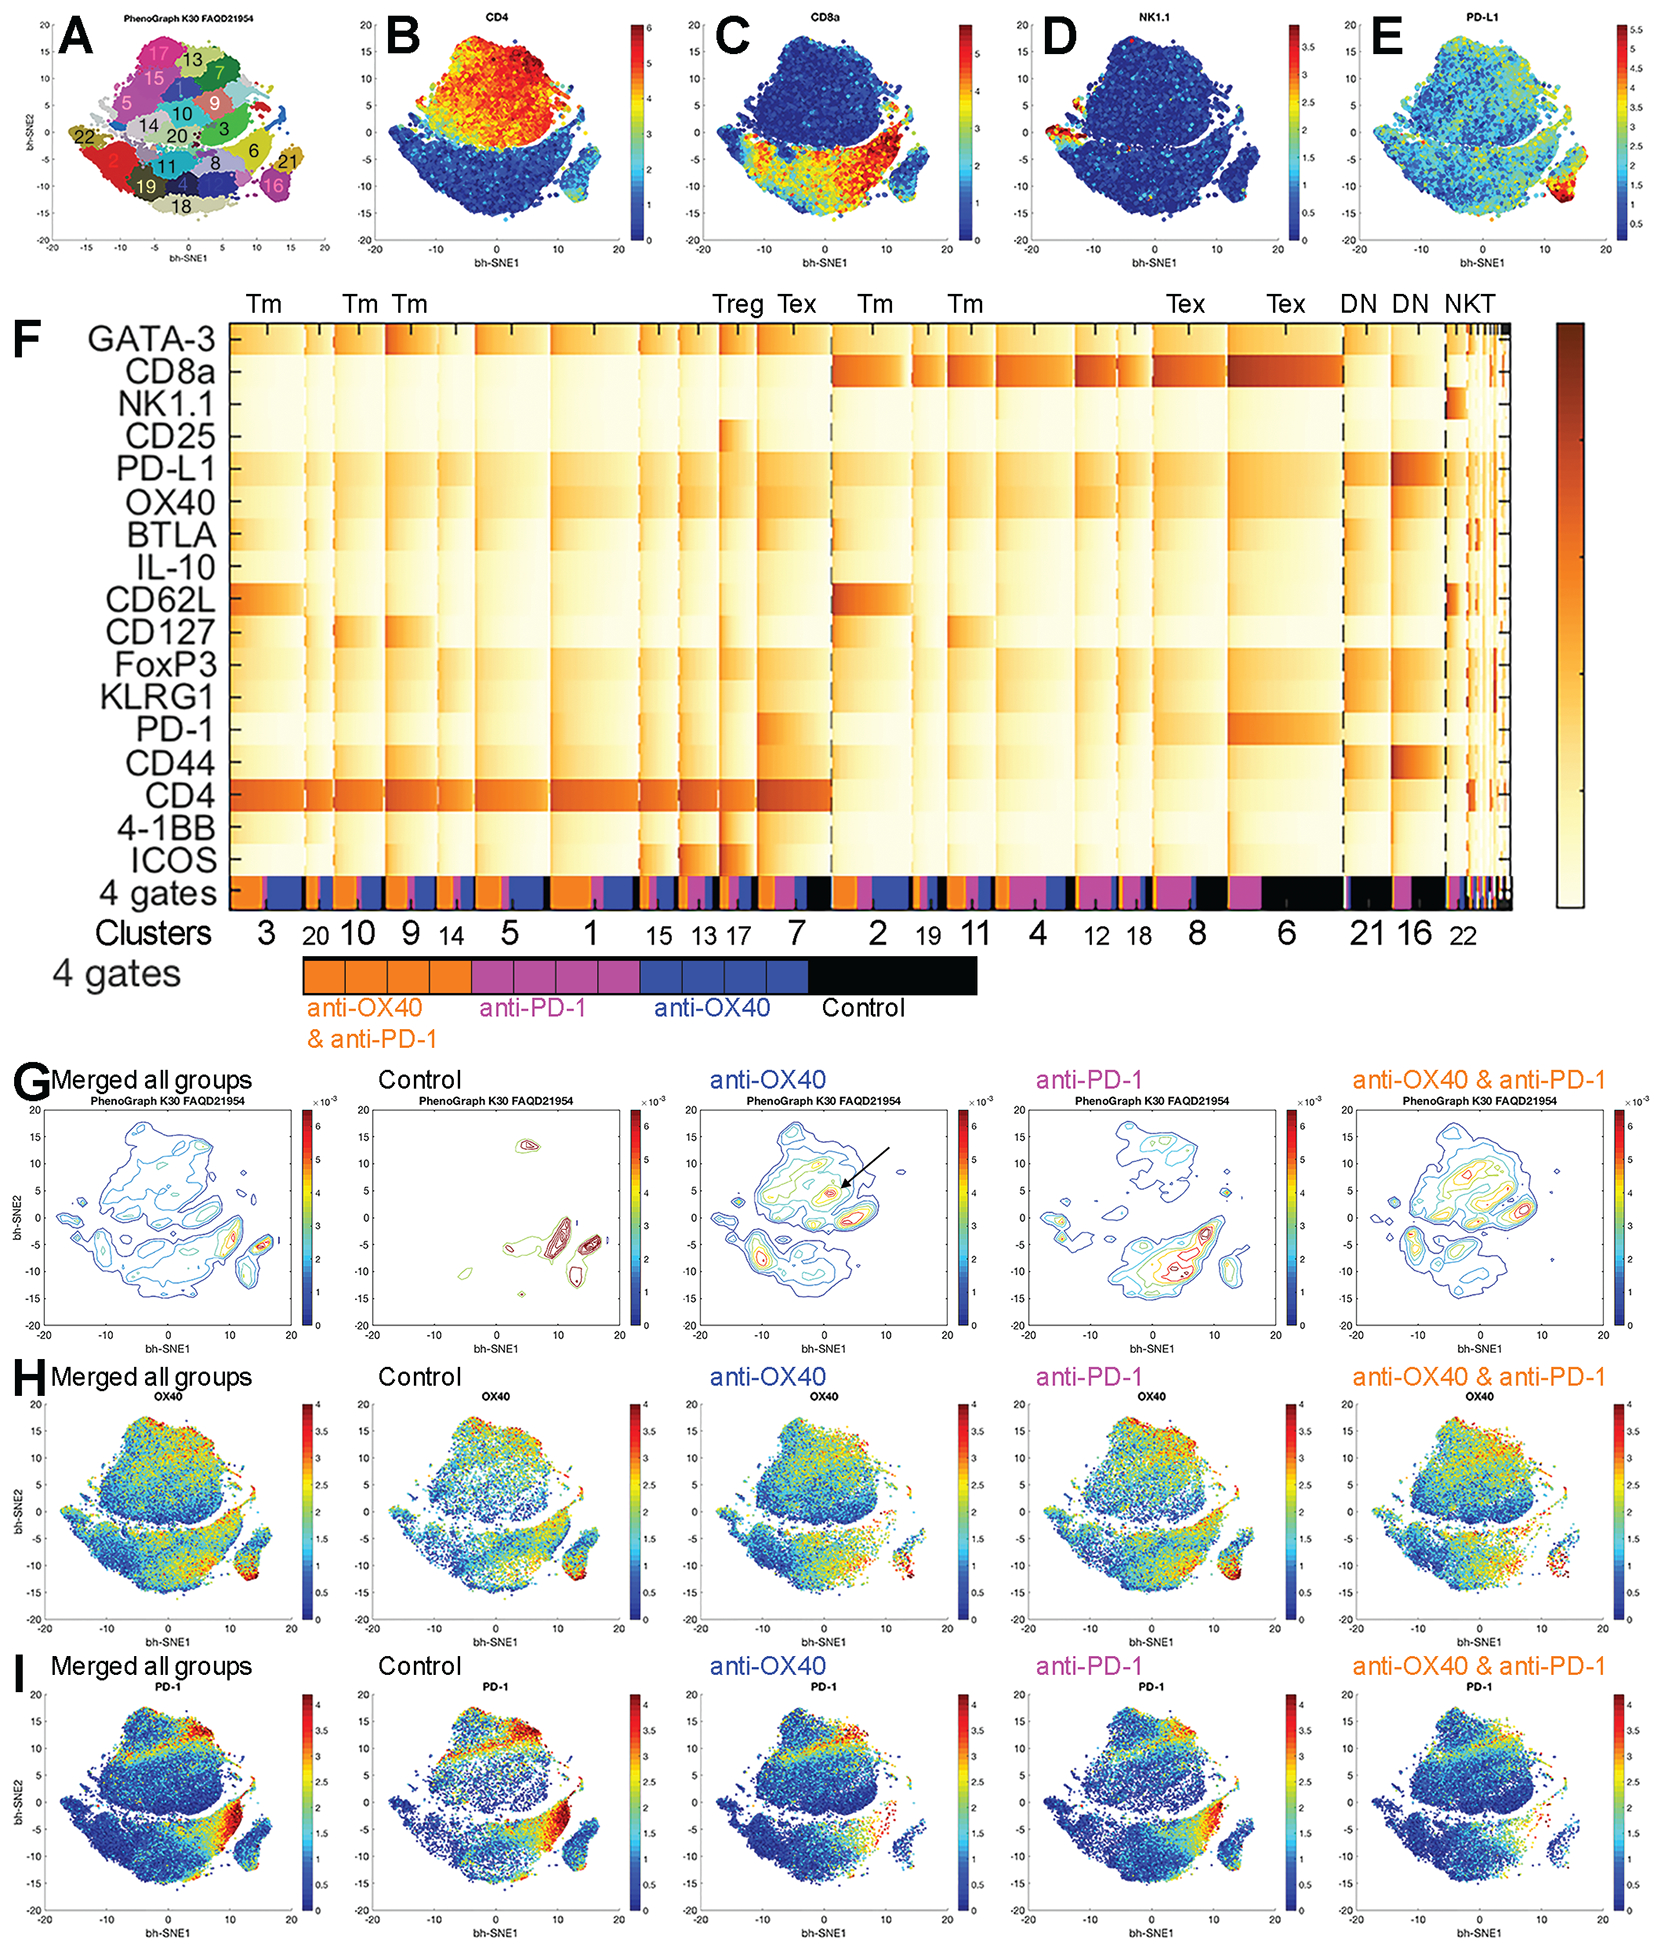
Methods: We performed studies in C57BL/6 mice (controls), KrasG12D/+;Trp53R172H/+;Pdx-1-Cre (KPC) mice, and mice with orthotopic tumors grown from Panc02 cells, KrasG12D;P53flox/flox;PDX-1-Cre;Luciferase (KPC-Luc) cells, or mT4 cells. After tumors developed, mice were given injections of control antibody or anti-OX40 and/or anti-PD-1 antibody. Some mice were then given injections of antibodies against CD8, CD4, or NK1.1 to deplete immune cells, and IL4 or IL7RA to block cytokine signaling. Bioluminescence imaging was used to monitor tumor growth. Tumor tissues collected and single-cell suspensions were analyzed by time of flight mass spectrometry analysis. Mice that were tumor-free 100 days after implantation of orthotopic tumors were rechallenged with PDAC cells (KPC-Luc or mT4) and survival was measured. Median levels of PD-1 and OX40 mRNAs in PDACs were determined from The Cancer Genome Atlas and compared with patient survival times.

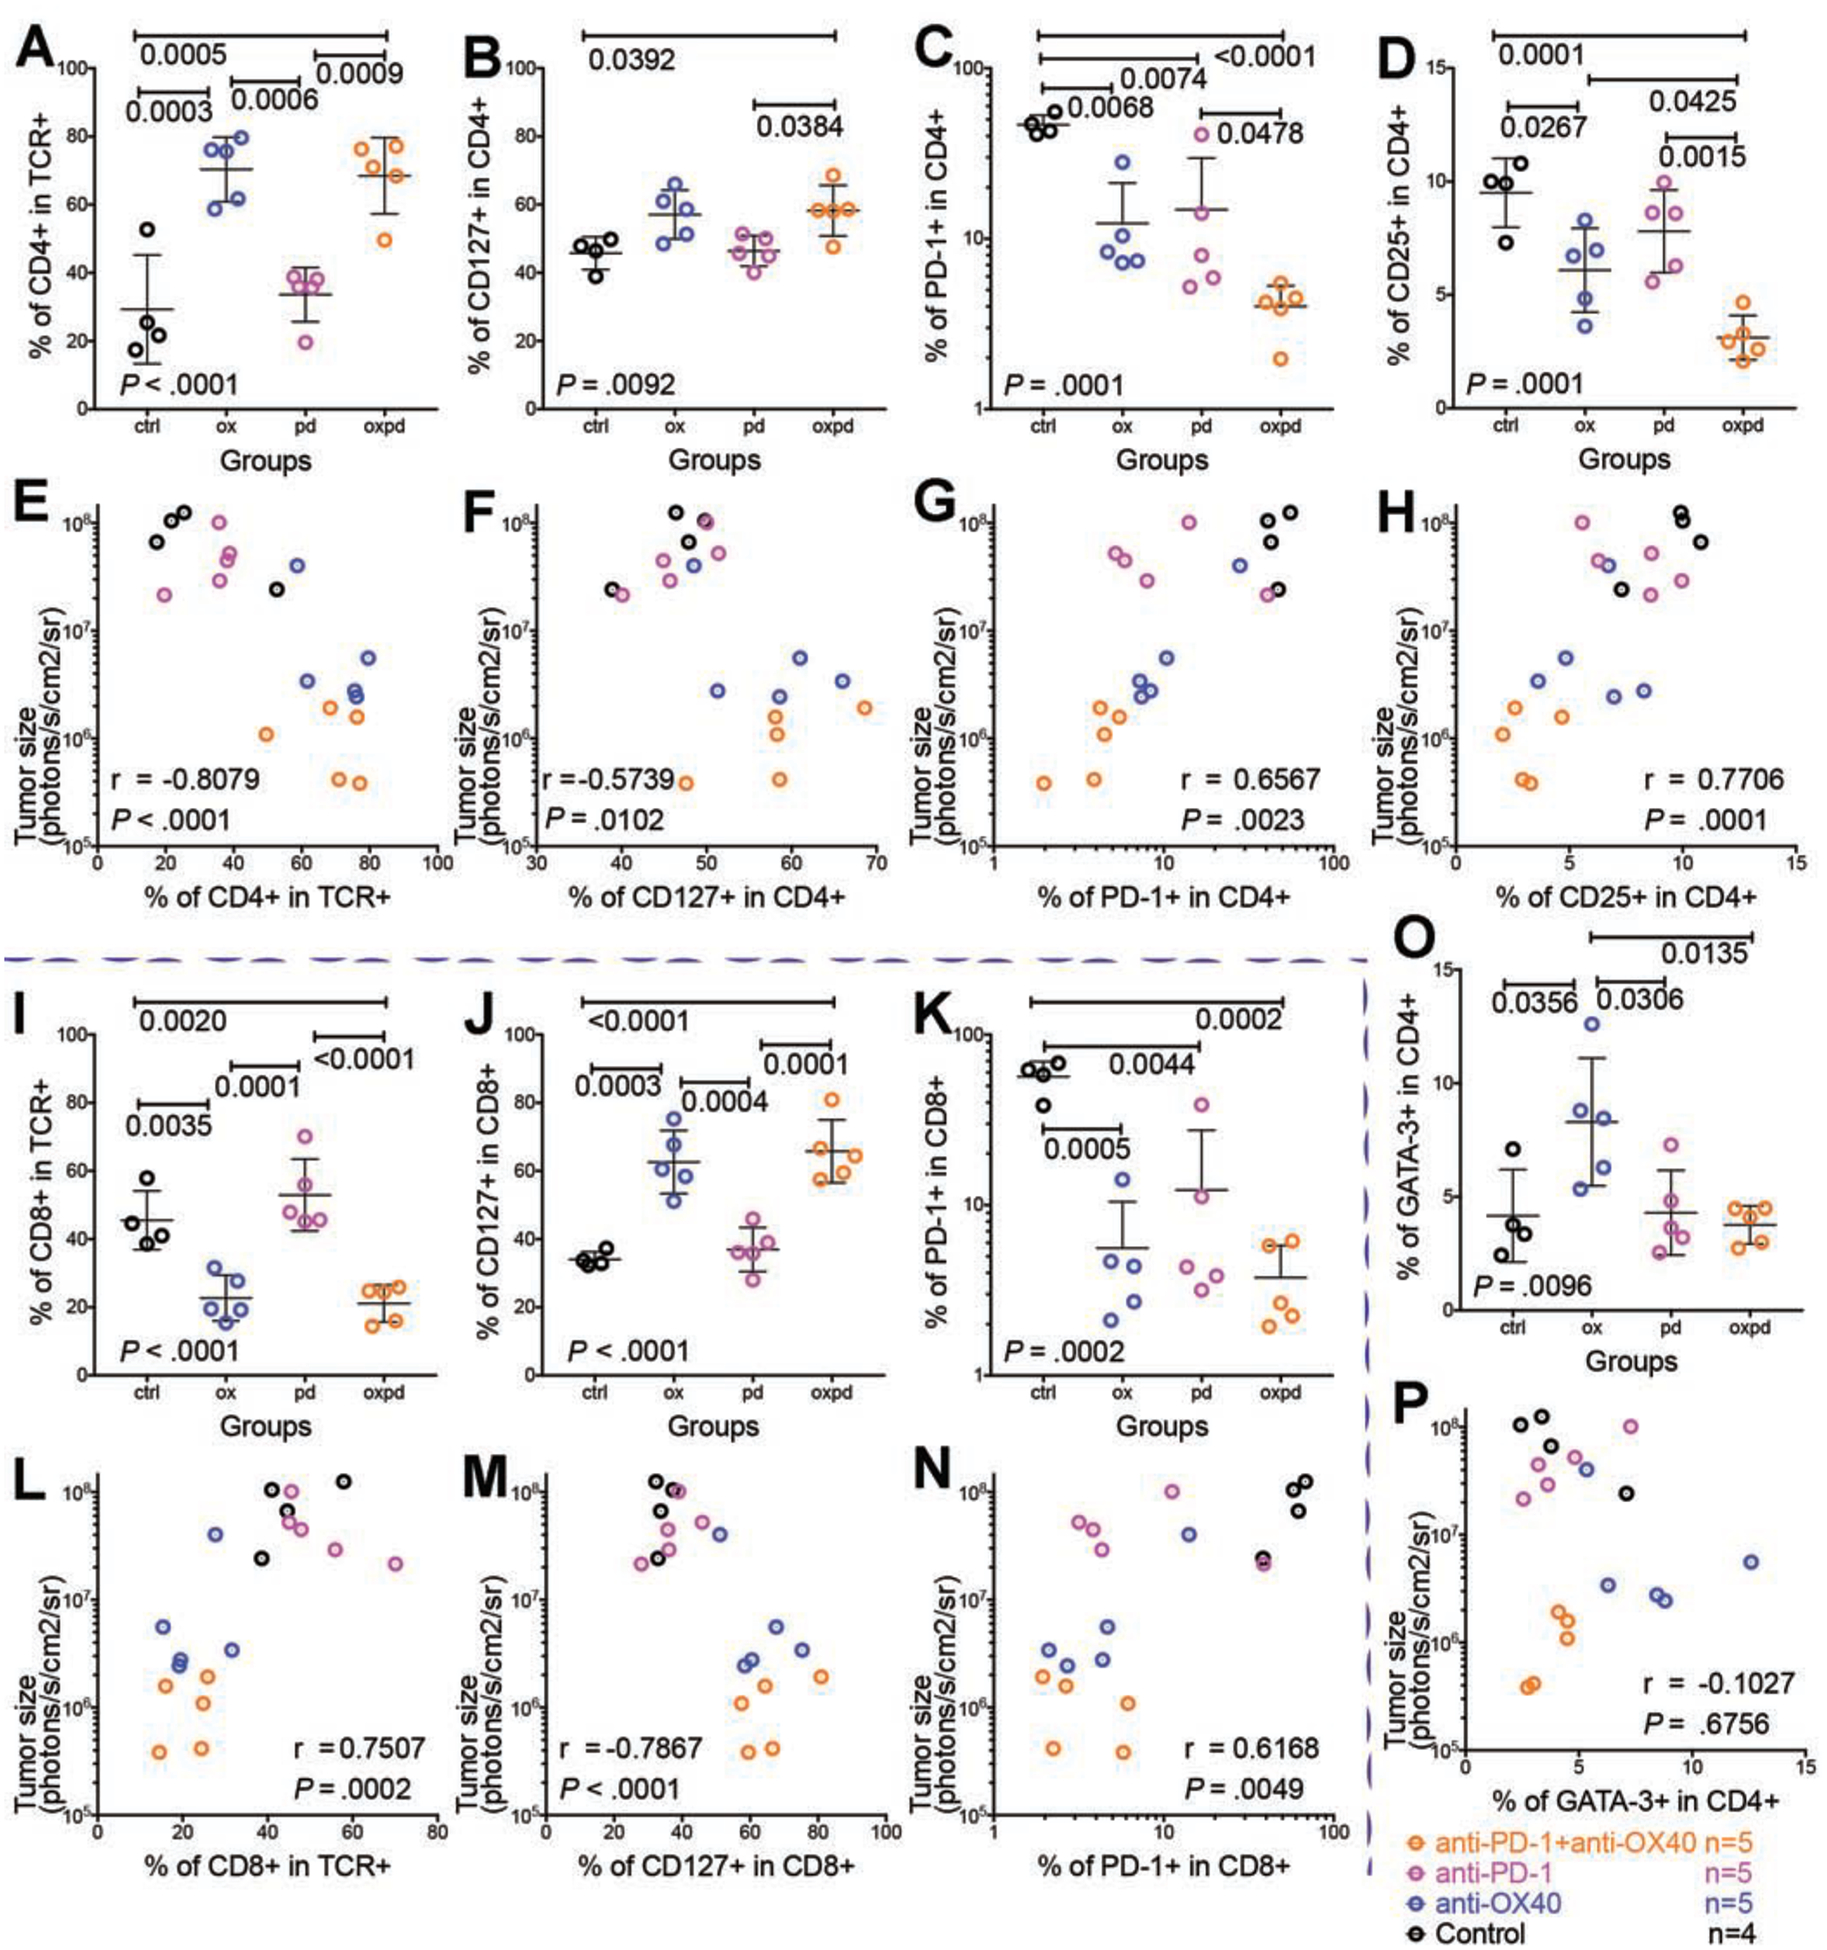
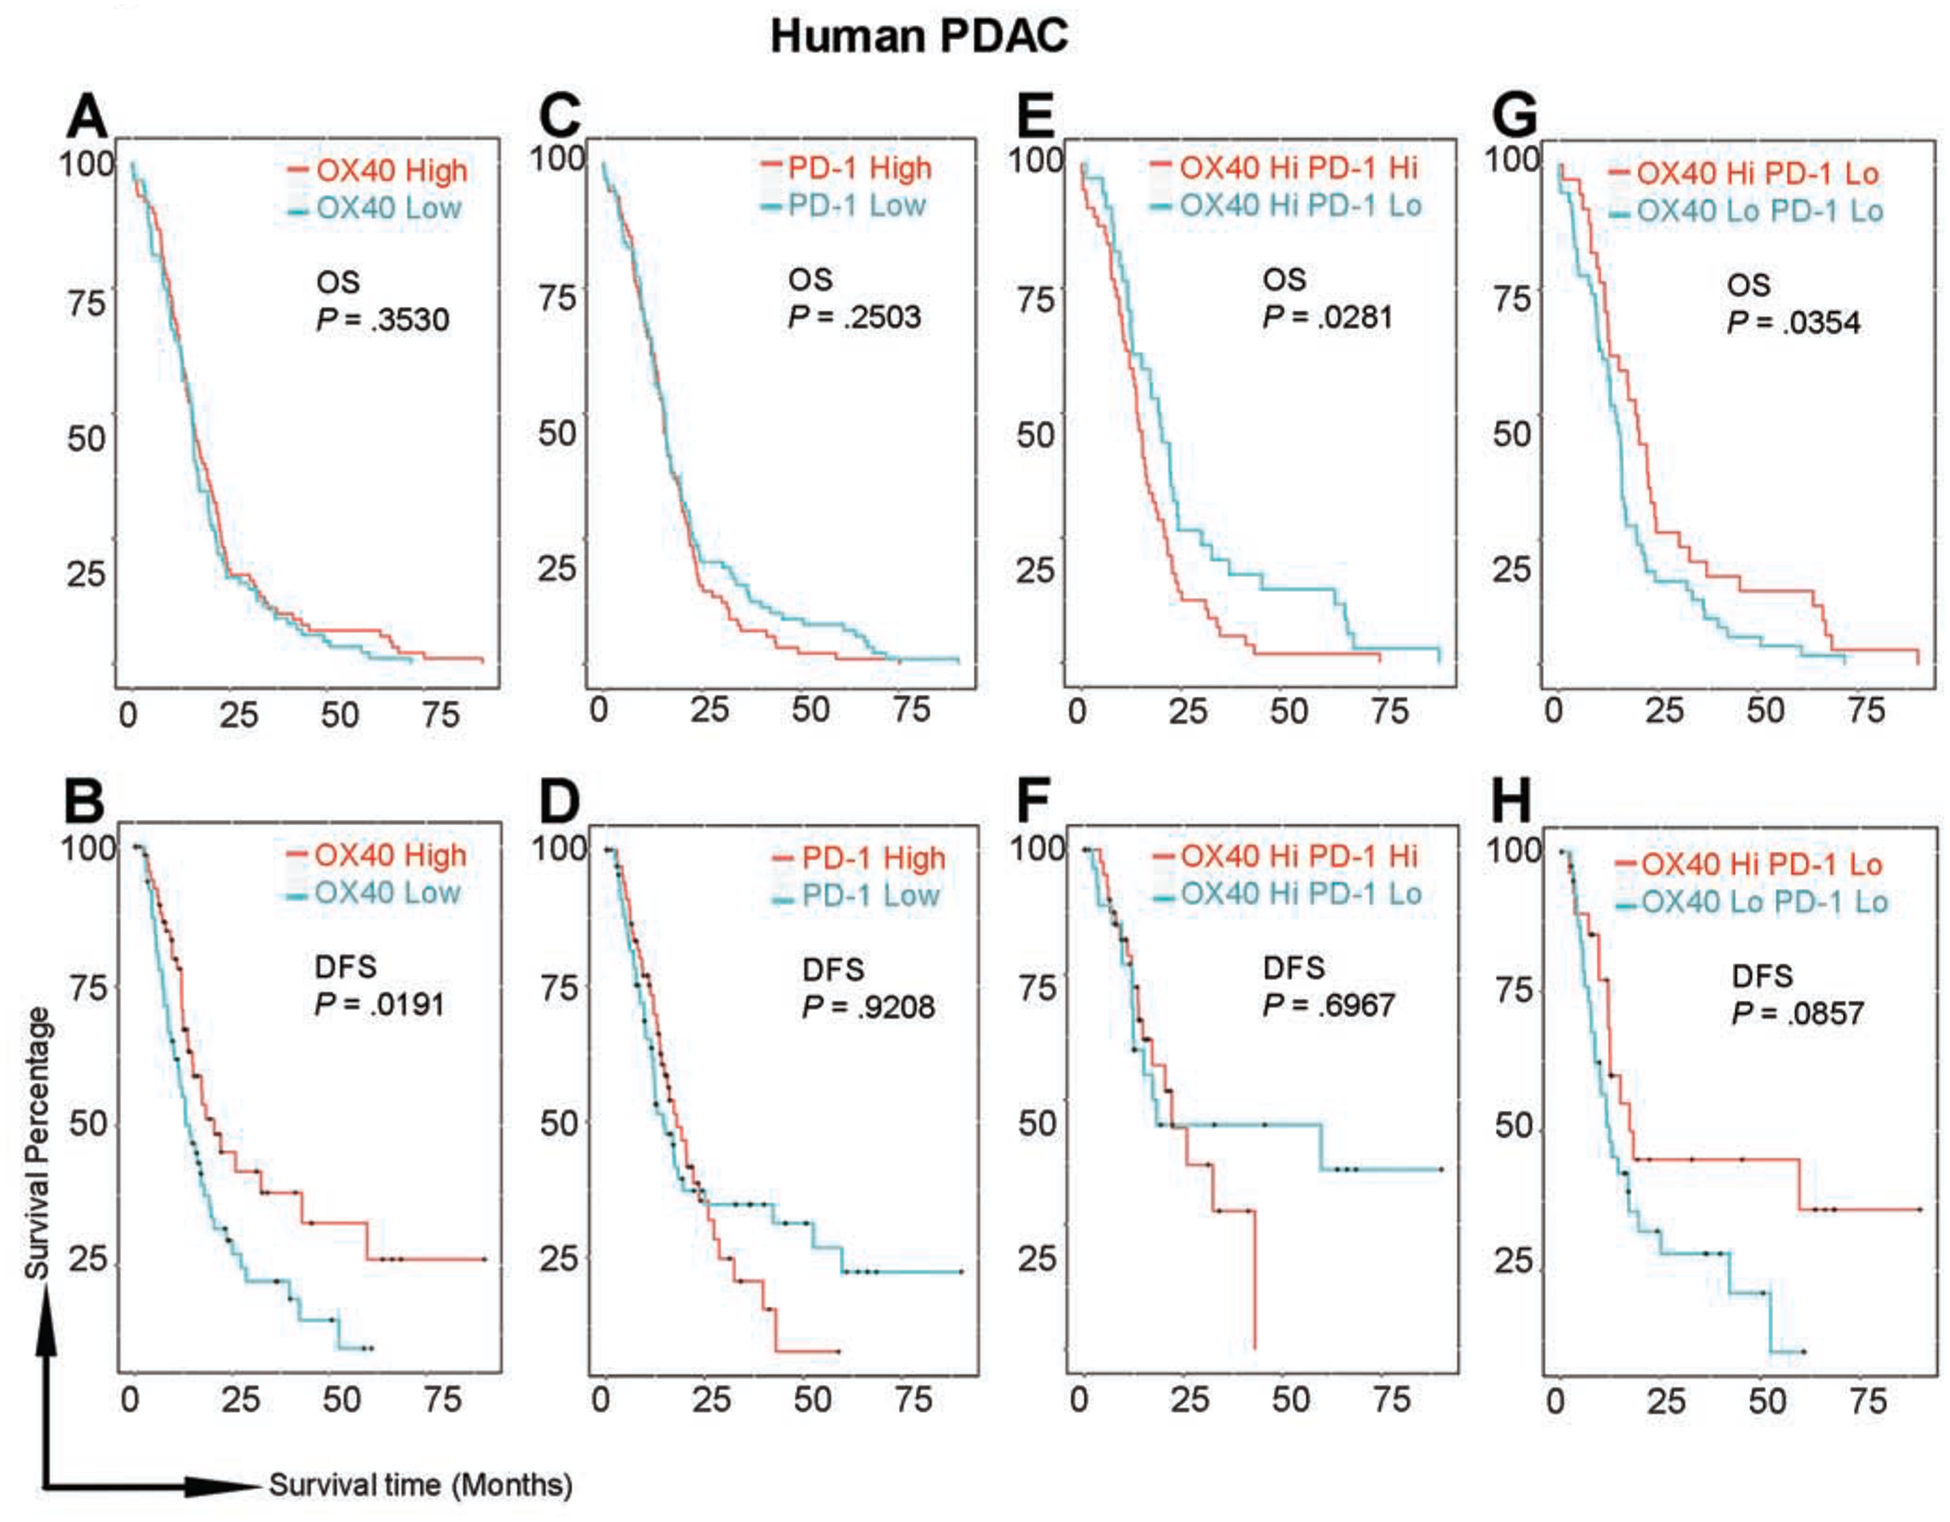
Results: In mice with orthotopic tumors, all those given control antibody or anti-PD-1 died within 50 days, whereas 43% of mice given anti-OX40 survived for 225 days; almost 100% of mice given the combination of anti-PD-1 and anti-OX40 survived for 225 days, and tumors were no longer detected. KPC mice given control antibody, anti-PD-1, or anti-OX40 had median survival times of 50 days or less, whereas mice given the combination of anti-PD-1 and anti-OX40 survived for a median 88 days. Mice with orthotopic tumors that were given the combination of anti-PD-1 and anti-OX40 and survived 100 days were rechallenged with a second tumor; those rechallenged with mT4 cells survived an additional median 70 days and those rechallenged with KPC-Luc cells survived long term, tumor free. The combination of anti-PD-1 and anti-OX40 did not slow tumor growth in mice with antibody-mediated depletion of CD4+ T cells. Mice with orthotopic tumors given the combination of anti-PD-1 and anti-OX40 that survived after complete tumor rejection were rechallenged with KPC-Luc cells; those with depletion of CD4+ T cells before the rechallenge had uncontrolled tumor growth. Furthermore, KPC orthotopic tumors from mice given the combination contained an increased number of CD4+ T cells that expressed CD127 compared with mice given control antibody. The combination of agents reduced the proportion of T-regulatory and exhausted T cells and decreased T-cell expression of GATA3; tumor size was negatively associated with numbers of infiltrating CD4+ T cells, CD4+CD127+ T cells, and CD8+CD127+ T cells, and positively associated with numbers of CD4+PD-1+ T cells, CD4+CD25+ T cells, and CD8+PD-1+ T cells. PDACs with high levels of OX40 and low levels of PD-1 were associated with longer survival times of patients.

Conclusions: Pancreatic tumors appear to evade the immune response by inducing development of immune-suppressive T cells. In mice, the combination of anti-PD-1 inhibitory and anti-OX40 agonist antibodies reduces the proportion of T-regulatory and exhausted T cells in pancreatic tumors and increases numbers of memory CD4+ and CD8+ T cells, eradicating all detectable tumor. This information can be used in development of immune-based combination therapies for PDAC.

Keywords: CyTOF; Immune Checkpoint Inhibitor; Immune-Based Therapy; Mouse Model.


Conflict of interest statement

Disclosures: The authors declare no potential conflicts of interest.

Figures

Figure 1.
Figure 1.. Combination of OX40 agonist and PD-1 antagonist eradicates PDAC in tumor-bearing mice.
Tumor size was measured by photons/sec/cm2/sr in the IVIS bioluminescence imaging; the normalized image at day 28 is on the right of each growth curve. Color-matched curves were applied to groups on all panels. (A) Tumor implantation and treatment schedule for KPC-Luc syngeneic orthotopic tumor models. (B-D) Tumor growth in mice treated with isotype control (B, black), anti-OX40 (C, blue), and anti–PD-1 (D, magenta). (E) Tumor shrinkage in mice treated with a combination of anti–PD-1 and anti-OX40 (orange). The eliminated tumors were visualized by trace luciferase signals. P values from two-way analysis of variance (ANOVA) were 0.0001 for anti-OX40 vs. control, 0.9542 for anti–PD-1 vs. control, <0.0001 for combination vs. control, 0.0006 for anti–PD-1 vs. anti-OX40, <0.0001 for combination vs. anti-OX40, and <0.0001 for combination vs. anti–PD-1. (F) Survival curve of tumor-bearing mice after orthotopic tumor implantation. Median survival durations of mice treated with control, anti-OX40, anti–PD-1, and combinaton were 22.5 days, 93 days, 20 days, and more than 225 days after treatment, respectively (P < 0.0001). (G) MRI diagnosis of a representative spontaneous PDAC tumors (T). (H) Treatment schedule of spontaneous PDAC tumors in KPC-GEMM mice. (I) Survival curve of tumor-bearing GEMM mice. Treatments were started when the solid tumor was palpable. Median survival times of mice treated with control, anti-OX40, anti–PD-1, and combination were 48 days, 37 days, 50.5 days, and 88 days after treatment, respectively (log-rank test, P = 0.0117). Significant P values between groups were 0.0011 for combination vs. control, 0.0102 for combination vs. anti–PD-1, and 0.0494 for combination vs. anti-OX40.
Figure 2:
Figure 2:. Surviving mice after anti-OX40 and anti-PD-1 immunotherapy reject rechallenged tumors.
(A) Initial PDAC cells were orthotopically implanted followed by immunotherapy. The surviving mice given anti-OX40 or the combination of anti-OX40 and anti-PD-1 immunotherapies were rechallenged with a second implantation of syngeneic PDAC cells from either the same cell line as the first or a different cell line. (B) Age-matched C57BL/6 albino mice received de novo mT4 cell implantation. (C) Survival of mT4-rechallenged mice in the absence of further immunotherapy. The control and anti–PD-1–treated mice, which died before possible mT4 rechallenge, are included for comparison. (D-E) Survival of KPC-Luc–rechallenged mice in the absence of further immunotherapy. KPC-Luc (D) or Panc02-Luc (E) cells were used as the initial tumor. Control mice (dash-dotted line), which died before possible KPC-Luc rechallenge, and de novo KPC-Luc mice (solid line), which died within 50 days after implantation, are included for comparison.
Figure 3.
Figure 3.. CD4 cells are required for maximal tumor elimination and immunologic memory after the treatment with anti-OX40 and anti–PD-1.
(A, H, J) Schedule of tumor implantation and injection of antibodies for cell depletion in mice receiving treatment only (A), in mice rechallenged after treatment (H), and in mice monitored for the baseline immunogenicity of KPC-Luc tumor (J). (B–E) Depletion of CD4 (CD4-D) (C), CD8 (CD8-D) (D), or double depletion of CD4 and CD8 (CD4+8-D) (E) was confirmed by flow cytometry, and no cells were depleted after control immunoglobulin G (IgG) antibody injection (B). (F–G) The antitumor effect was completely abolished after depletion of CD4 cells with or without depletion of CD8 cells; however, the antitumor effect was only partially reduced by depletion of CD8 cells. IVIS bioluminescence images of tumor size in mice are shown on the right in the setting of anti-OX40 monotherapy (F) and combination therapy with anti-OX40 and anti–PD-1 (G). (I) In mice previously cured by combination therapy with anti-OX40 and anti–PD-1, the immunologic memory effect was completely abolished after depletion of CD4 cells; however, the immunologic memory effect was intact after depletion of CD8 cells. (K) KPC-Luc tumor exhibited similar growth curves in Rag2 knockout, CD4- and/or CD8-depleted, and immunocompetent control mice.
Figure 4.
Figure 4.. Identification of tumor-infiltrating T lymphocytes by anti-OX40 or anti–PD-1 by CyTOF analysis.
(A-E) tSNE plots of all T cells (A) with expression levels of CD4 (B), CD8 (C), NK1.1 (D), and PD-L1 (E) from all samples with number- and color-coded clusters. (F) Heat map of normalized marker expression of T-cell clusters with the fractions of four gates. Gate source shows the pooled samples in each group at the bottom line of the heat map. Black: control, blue: anti-OX40 monotherapy, magenta: anti–PD-1 monotherapy, and orange: combination of anti–PD-1 and anti-OX40. Tm: memory T cells, Tex: PD-1 exhausted T cells, and DN: CD4 and CD8 double negative T cells. (G-I) tSNE plots of all samples and control, anti-OX40, anti–PD-1, and anti–PD-1 and anti-OX40 groups. (G) Density plots. Arrow in the anti-OX40 plot indicates GATA-3 CD4 cells. (H) Plots of OX40 expression. (I) Plots of PD-1 expression.
Figure 5.
Figure 5.. Frequency of identified subsets changed after treatments and was correlated with tumor size.
Shown are groups given isotype control (black, ctrl), anti-OX40 agonist monotherapy (blue, ox), anti–PD-1 blockade monotherapy (magenta, pd), and the combination of anti–PD-1 blockade and anti-OX40 agonist (orange, oxpd). (A–H, O, P) Subsets in the CD4 population (I-N) Subsets in the CD8 population. (A) Increased fraction of CD4 T cells after anti-OX40 and combination treatment. TCR: T-cell receptor (B) Increased CD127 memory subset in CD4 cells after combination treatment. (C) Decreased PD-1 exhausted subset in CD4 cells after all treatments. (D) Decreased CD25 Treg cell subsets in CD4 cells after anti-OX40 and combination treatment. (E, F, G, H) Correlations of CD4 T cell subsets and tumor size: CD4 (E), CD127 (F), PD-1 (G), and CD25 (H). (I) Decreased fraction of CD8 T cells after anti-OX40 and combination treatment. (J) Increased CD127 memory subset in CD8 cells after anti-OX40 and combination treatment. (K) Decreased PD-1 exhausted subset in CD8 cells after all treatments. (L, M, N) Correlations of CD8 T cell subsets and tumor size: CD8 (L), CD127 (M), and PD-1 (N). (O) Increased GATA-3 cell phenotype in CD4 cells after anti-OX40; this reversed to baseline after the addition of anti–PD-1. (P) No correlation between GATA-3 cell phenotype and tumor size. P values are on the plots. Pearson r correlation was applied. Scattered dot plots are displayed with mean ± standard deviation.
Figure 6.
Figure 6.. Patients’ prognosis is associated with the expression levels of OX40 and PD-1 in PDAC tumors in The Cancer Genome Atlas dataset.
(A, C, E, G) Overall survival (OS) did not significantly differ between patients grouped by OX40 (A) or PD-1 (C) levels only. Among patients with high OX40 expression (E), patients with low PD-1 lived significantly longer than did those with high PD-1. Among patients with low PD-1 expression (G), patients with high OX40 lived significantly longer than did those with low OX40. (B, D, F, G) Disease-free survival (DFS) was significantly longer in patients with high OX40 than in those with low OX40 (B). There were no differences in DFS in other comparisons; however, tails on the survival curves were elevated in patients with low PD-1 compared with patients with high PD-1 in both the whole population (D) and in the subpopulation with high OX40 (F). Among patients with low PD-1 (H), the tail was elevated in patients with high OX40.

References

    1. Ribas A, Wolchok JD. Cancer immunotherapy using checkpoint blockade. Science 2018;359:1350–1355. - PMC - PubMed
    1. Ying H, Dey P, Yao W, et al. Genetics and biology of pancreatic ductal adenocarcinoma. Genes Dev 2016;30:355–85. - PMC - PubMed
    1. Katlinski KV, Gui J, Katlinskaya YV, et al. Inactivation of Interferon Receptor Promotes the Establishment of Immune Privileged Tumor Microenvironment. Cancer Cell 2017;31:194–207. - PMC - PubMed
    1. Feig C, Jones JO, Kraman M, et al. Targeting CXCL12 from FAP-expressing carcinoma-associated fibroblasts synergizes with anti-PD-L1 immunotherapy in pancreatic cancer. Proc Natl Acad Sci U S A 2013;110:20212–7. - PMC - PubMed
    1. Clark CE, Hingorani SR, Mick R, et al. Dynamics of the immune reaction to pancreatic cancer from inception to invasion. Cancer Res 2007;67:9518–27. - PubMed

Publication types

MeSH terms