

Updated population minimal eliciting dose distributions for use in risk assessment of 14 priority food allergens
- PMID: 32179163
- PMCID: PMC7748293
- DOI: 10.1016/j.fct.2020.111259
Updated population minimal eliciting dose distributions for use in risk assessment of 14 priority food allergens
Abstract
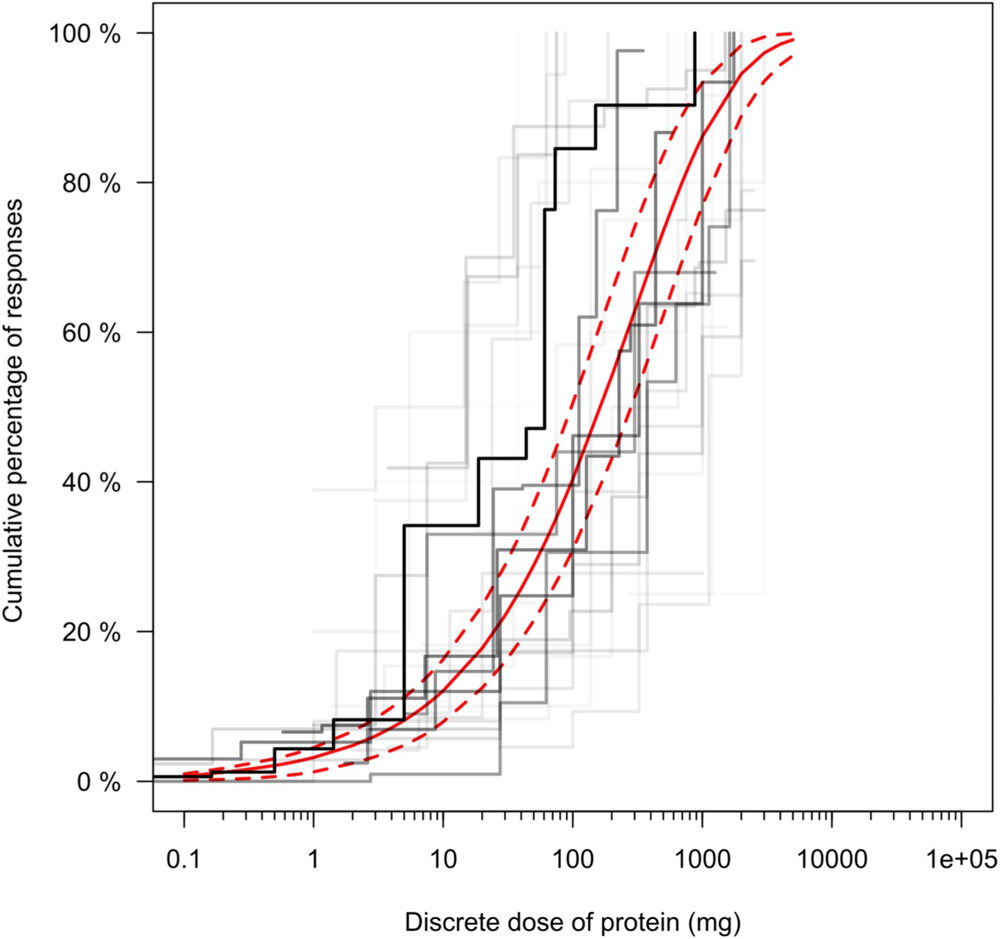
Food allergy and allergen management are important global public health issues. In 2011, the first iteration of our allergen threshold database (ATDB) was established based on individual NOAELs and LOAELs from oral food challenge in roughly 1750 allergic individuals. Population minimal eliciting dose (EDp) distributions based on this dataset were published for 11 allergenic foods in 2014. Systematic data collection has continued (2011-2018) and the dataset now contains over 3400 data points. The current study provides new and updated EDp values for 14 allergenic foods and incorporates a newly developed Stacked Model Averaging statistical method for interval-censored data. ED01 and ED05 values, the doses at which 1%, and respectively 5%, of the respective allergic population would be predicted to experience any objective allergic reaction were determined. The 14 allergenic foods were cashew, celery, egg, fish, hazelnut, lupine, milk, mustard, peanut, sesame, shrimp (for crustacean shellfish), soy, walnut, and wheat. Updated ED01 estimates ranged between 0.03 mg for walnut protein and 26.2 mg for shrimp protein. ED05 estimates ranged between 0.4 mg for mustard protein and 280 mg for shrimp protein. The ED01 and ED05 values presented here are valuable in the risk assessment and subsequent risk management of allergenic foods.
Keywords: Allergy; Food; Labeling; Model averaging; Risk assessment; Threshold.
Copyright © 2020 Elsevier Ltd. All rights reserved.
Conflict of interest statement
Declaration of competing interest The authors declare that they have no known competing financial interests or personal relationships that could have appeared to influence the work reported in this paper.
Figures
References
-
- Ballmer-Weber BK, Fernandez-Rivas M, Beyer K, Defernez M, Sperrin M, Mackie AR, Salt LJ, Hourihane JOB, Asero R, Belohlavkova S, Kowalski M, De Blay F, Papadopoulos NG, Clausen M, Knulst AC, Roberts G, Popov T, Sprikkelman AB, Dubakiene R, Vieths S, Van Ree R, Crevel R, Mills ENC, 2015. How much is too much? Threshold dose distributions for 5 food allergens. J. Allergy Clin. Immunol 135, 964–971. 10.1016/j.jaci.2014.10.047. - DOI - PubMed
-
- Blom WM, Michelsen-Huisman AD, van Os-Medendorp H, van Duijn G, de Zeeuw-Brouwer M, Versluis A, Castenmiller JJM, Noteborn HPJM, Kruizinga AG, Knulst AC, Houben GF, 2018. Accidental food allergy reactions: products and undeclared ingredients. J. Allergy Clin. Immunol 142, 865–875. 10.1016/j.jaci.2018.04.041. - DOI - PubMed
-
- Blumchen K, Beder A, Beschorner J, Ahrens F, Gruebl A, Hamelmann E, Hansen G, Heinzmann A, Nemat K, Niggemann B, Wahn U, Beyer K, 2014. Modified oral food challenge used with sensitization biomarkers provides more real-life clinical thresholds for peanut allergy. J. Allergy Clin. Immunol 134, 390–398. 10.1016/j.jaci.2014.03.035. e4. - DOI - PubMed
Publication types
MeSH terms
Substances
Grants and funding
LinkOut - more resources
Full Text Sources
Medical
