. 2020 Mar 27;23(3):100953.
doi: 10.1016/j.isci.2020.100953. Epub 2020 Feb 29.

Multiplex Stimulated Raman Scattering Imaging Cytometry Reveals Lipid-Rich Protrusions in Cancer Cells under Stress Condition

Affiliations

Multiplex Stimulated Raman Scattering Imaging Cytometry Reveals Lipid-Rich Protrusions in Cancer Cells under Stress Condition

Kai-Chih Huang et al. iScience. .

Abstract

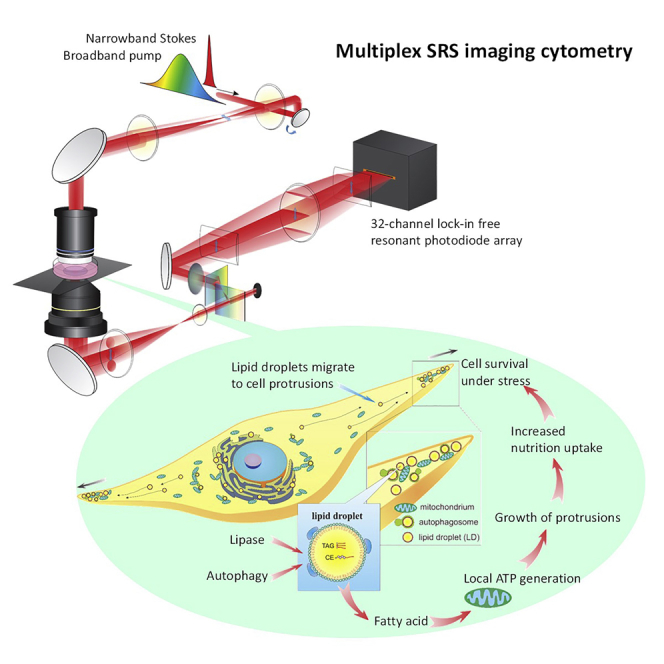
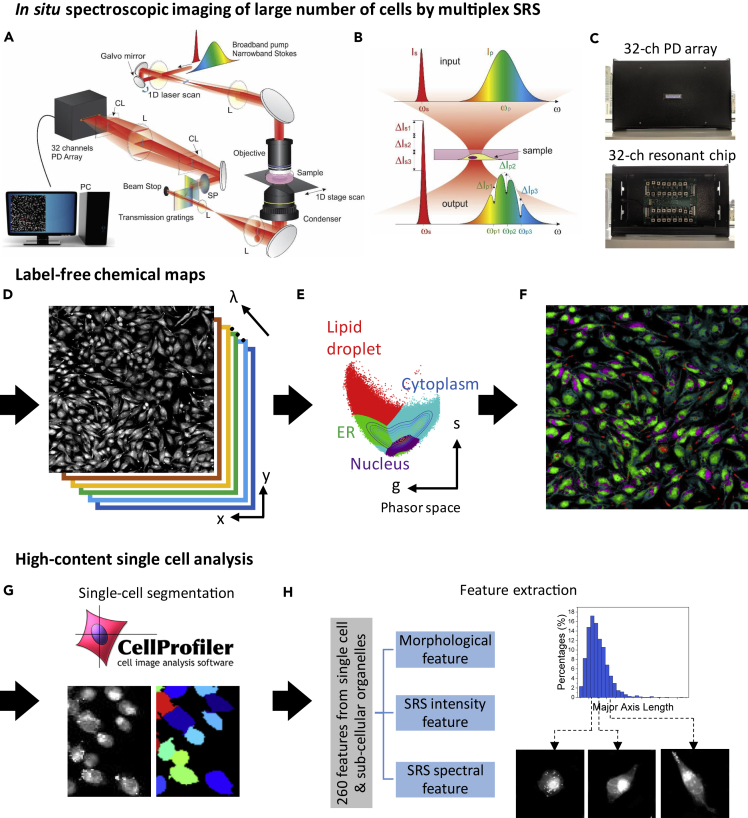
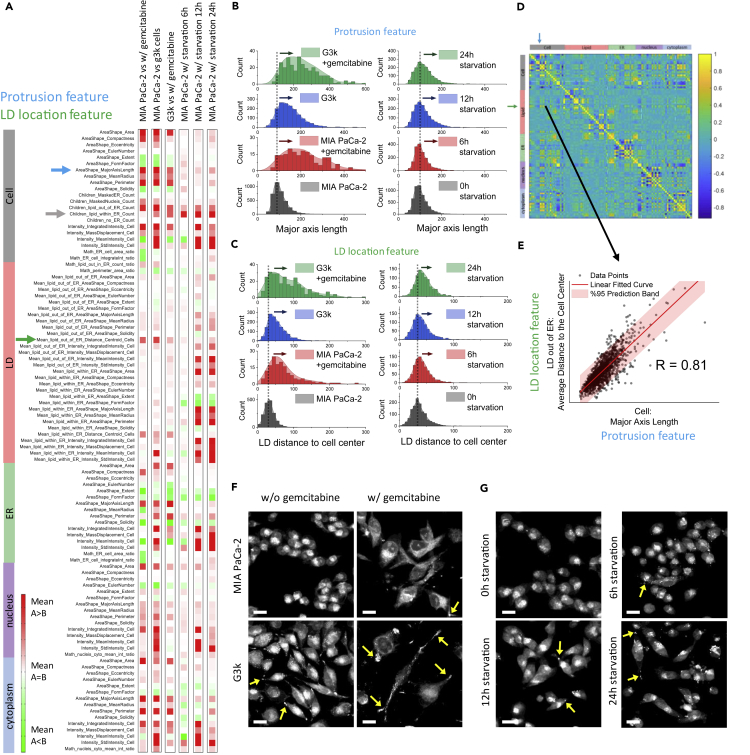
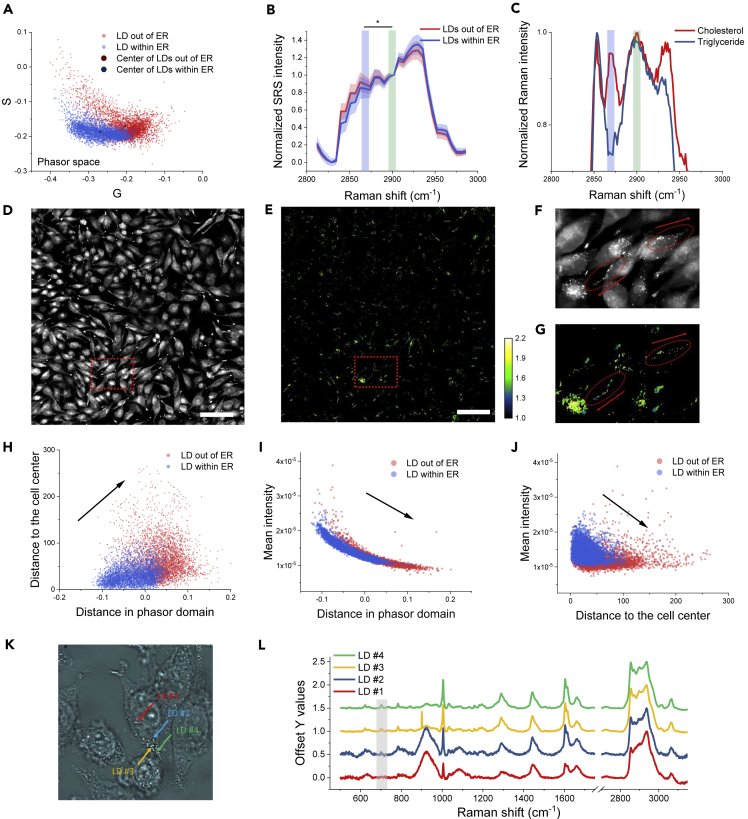
In situ measurement of cellular metabolites is still a challenge in biology. Conventional methods, such as mass spectrometry or fluorescence microscopy, would either destroy the sample or introduce strong perturbations to target molecules. Here, we present multiplex stimulated Raman scattering (SRS) imaging cytometry as a label-free single-cell analysis platform with chemical specificity and high-throughput capabilities. Using SRS imaging cytometry, we studied the metabolic responses of human pancreatic cancer cells under stress by starvation and chemotherapeutic drug treatments. We unveiled protrusions containing lipid droplets as a metabolic marker for stress-resistant cancer cells. Furthermore, by spectroscopic SRS mapping, we unveiled that triglyceride in lipid droplets are used for local energy production through lipolysis, autophagy, and β-oxidation. Our findings demonstrate the potential of targeting lipid metabolism for selective treatment of stress-resistant cancers. Collectively, these results highlight SRS imaging cytometry as a powerful label-free tool for biological discoveries with a high-throughput, high-content capacity.

Keywords: Cancer; Metabolomics; Optical Imaging.


Conflict of interest statement

Declaration of Interests The authors declare no competing interests.

Figures

None
Graphical abstract
Figure 1
Figure 1
Workflow of the Single-Cell Analysis by Multiplex SRS Imaging Cytometry (A–C) In situ spectroscopic imaging of a large number of cells by multiplex SRS. (A) Hybrid scanning was implemented by scanning a galvo mirror while moving the motorized stage. Multiple Raman modes are parallelly detected by a laboratory-built 32-channel lock-in free resonant photodiode array detector. (B) Multiple Raman shifts are excited by a broadband pump beam and a narrowband Stokes beam. (C) A photograph of our laboratory-built 32-channel lock-in free resonant photodiode (PD) array detector. Upper panel: the detector front side, showing a 32-channel PD array. Lower panel: the detector backside, showing 32-channel resonant circuit chips for lock-in free detection. (D–F) Label-free chemical mapping. (D) x-y-λ, a three-dimensional dataset generated by the multiplex SRS imaging cytometer. (E) The SRS spectrum from each image pixel is projected onto a 2D phasor domain, followed by an unsupervised clustering algorithm to separate the ER, nuclei, cytosol, and LDs. (F) A chemical map is generated by remapping the clustered results in the phasor domain back to the SRS image. (G and H) High-content single-cell analysis. (G) Single-cell segmentation by CellProfiler. (H) Left panel: a total of 260 features in each cell are extracted, which can be classified into morphological features, SRS intensity features, and SRS spectral features. Right: statistical analysis of each feature demonstrates cellular heterogeneity.
Figure 2
Figure 2
Multiplex SRS Imaging Cytometry Identifies Metabolic Signatures under Stressed Conditions (A) Feature arrays of cells under chemotherapy stress model (columns 1–3) and starvation stress model (columns 4–6). Red or green color indicates a mean value higher or lower than the control group, respectively. From columns 1–6: MIA PaCa-2 cells treated with gemcitabine (n = 642) compared with MIA PaCa-2 cells (control, n = 1,150); G3K cells (n = 1,637) compared with MIA PaCa-2 cells (control, n = 1,150); G3K cells treated with gemcitabine (n = 313) compared with G3K cells (control, n = 1,637); MIA PaCa-2 cells starved for 6 h (n = 1,698) compared with MIA PaCa-2 cell without starvation (control, n = 5,259); MIA PaCa-2 cells starved for 12 h (n = 1,515) compared with MIA PaCa-2 cell without starvation (control, n = 5,259); MIA PaCa-2 cells starved for 24 h (n = 1,547) compared with MIA PaCa-2 cell without starvation (control, n = 5,259). Blue arrow indicates the celluar feature as the major axis length; Gray arrow indicates the feature of increased LD counts within ER; Green arrow indicates the feature of mean distances of LDs out of the ER to the center of the cell. (B) Histograms of the cell “major axis length” for both the chemotherapy stress model (left panels) and the starvation stress model (right panels). (C) Histograms of the “distance of lipid droplets to the cell center,” for both the chemotherapy stress model (left panel) and the starvation stress model (right panel). (D) Correlation matrix of all the 260 features in gemcitabine-resistant G3K cells (n = 1,637). Yellow color indicates positive correlation coefficients with the highest value of 1. Blue color indicates negative correlation coefficients with the lowest value of −1. (E) The “major axis length” (a protrusion feature) is positively correlated with “distance of lipid droplets to the cell center” (a lipid droplet feature), with a correlation coefficient of 0.81. (F and G) Representative SRS images of cells from (F) the chemotherapy stress model and (G) the starvation stress model. Yellow arrows indicate the lipid-accumulated protrusion structures. Scale bar, 20 μm.
Figure 3
Figure 3
Multiplex SRS Imaging Cytometry Reveals the Heterogeneity of LDs in Single Cells (A) A scatterplot of LDs outside the ER (red) and inside the ER (blue) boundaries in the phasor space. (B) Averaged SRS spectra of LDs outside the ER (red) and inside the ER (blue) boundaries in the C-H region. Shaded area indicates the standard deviation of SRS spectral measurements from different LDs. SRS spectra of LDs outside the ER (red) and inside the ER are statistically different at 2,870 cm−1. p < 0.05. (C) Spontaneous Raman spectra of cholesteryl ester (red) and triglyceride (blue) in the C-H region. (D) An SRS image of G3K cells. (E) The molecular composition map of LDs in G3K cells by 2,900 cm−1/2,870 cm−1 SRS ratio image. Lower values indicate more cholesteryl ester contents, and higher values indicate more triglyceride contents. Scale bar, 100 μm. (F and G) A zoom-in SRS image (F), and a zoom-in composition map (G) of the dashed rectangular region in (D) and (E), respectively. Red arrows indicate the directions of LDs away from the cell center. (H–J) 2D scatterplots of two features from LDs outside the ER (red) and LDs inside the ER (blue) boundaries. The “distance in phasor domain” reflects “lipid compositions” of the LDs. The higher value of “distance in phasor domain” indicates more cholesteryl ester contents. The lower value of “distance in phasor domain” indicates more triglyceride contents. The features are (H) “lipid composition” versus “the distance of LD to the cell center,” (I) “lipid composition” versus “LD mean intensity,” and (J) “distance of LD to the cell center” versus “LD mean intensity.” (K) A transmission image of G3K cells. Arrows indicate LDs analyzed by Raman spectroscopy. (L) Spontaneous Raman spectra of selected LDs in (K). The gray region highlights the cholesteryl ester signature peak around 704 cm−1.
Figure 4
Figure 4
LDs Are Degraded by Autophagy and Lipase and Used in Mitochondria for Energy (A) SRS (left panel), TPEF (middle panel), and the composition (right panel) images from an MIA PaCa-2 cell (upper panel) and a G3K cell (lower panel). TPEF imaging detects the autophagosomes labeled by monodansylcadaverine. Zoom-in areas from the dashed yellow square are shown in the lower left corner of each panel. Scale bars, 10 μm. (B) SRS (left panel), TPEF (middle panel), and the composition (right panel) images from an MIA PaCa-2 cell (upper panel) and a G3K cell (lower panel). TPEF imaging detects the mitochondria labeled by MitoTracker. Zoom-in areas from the dashed yellow square are shown in the lower left corner of each panel. Scale bar, 10 μm. (C) Percentage of cells with LD-rich protrusions after treatment by atglistation in normal and starvation conditions (n = 5). The bars indicate means ± SEM. (D) Percentage of cells with LD-rich protrusions after treatment by chloroquine sulfate in normal and starvation conditions (n = 5). The bars indicate means ± SEM. (E) Percentage of cells with LD-rich protrusions after treatment by etomoxir in normal and starvation conditions (n = 5). The bars indicate means ± SEM. (F and G) Histograms of one of the protrusion features “extent” for (F) G3K cells and (G) gemcitabine-treated G3K cells, treated with atglistatin (atglis), chloroquine sulfate (clq), and etomoxir (eto). The higher “extent” value indicates cells with less protrusion formation. (H and I) Histograms of the “distance of LDs out of ER to the cell center” feature for (I) G3K cells and (J) gemcitabine-treated G3K cells, treated with atglistatin, chloroquine sulfate, and etomoxir. (J) Our hypothesis of LD degradation at the protrusion by autophagy and lipase, and the utilization of free fatty acids for energy production via β-oxidation in mitochondria. ∗∗p < 0.01, ∗∗∗p < 0.001.
Figure 5
Figure 5
Blockage of Lipid Metabolism Suppressed Cell Survival under Stress (A) Time-dependent MIA PaCa-2 cell viability with and without chloroquine sulfate treatment, atglistatin treatment, and etomoxir treatment under starvation condition. The bars indicate means ± SEM. (B) Gemcitabine concentration-dependent G3K cell viability with and without chloroquine sulfate treatment, atglistatin treatment, and etomoxir treatment for 72 h. The bars indicate means ± SEM. (C–E) Concentration-dependent MIA PaCa-2 cell viability for cells treated by (C) chloroquine sulfate, (D) atglistatin, and (E) etomoxir under normal and starved conditions for 24 h. The bars indicate means ± SEM. (F–H) Concentration-dependent viability for MIA PaCa-2 cells and G3K cells, treated by (F) chloroquine sulfate, (G) atglistatin, and (H) etomoxir, for 72 h, n = 3. The bars indicate means ± SEM.
Figure 6
Figure 6
Protrusions Increase Cellular Uptake of Glucose (A) SRS (left panels) and TPEF (right panels) images from MIA PaCa-2 cells incubated with 2-NBDG for 1 h. The TPEF signal was from the 2-NBDG accumulated in the cells. The upper panels are the control group, whereas the lower panels are collected under the starvation condition. Scale bar, 10 μm. (B) Quantitation of the 2-NBDG intensity for MIA PaCa-2 cells in normal (n = 5) and starvation conditions (with [n = 6] and without protrusions [n = 7]). The bars indicate means ± SEM. (C) Representative TPEF images of MIA PaCa-2 cells immunostained with an antibody against GLUT1. Scale bar, 10 μm. (D) Quantitation of fluorescent intensity from labeled GLUT1 in (C) (n = 6). The bars indicate means ± SEM. (E) Transmission phase contrast (left panels) and TPEF (right panels) images of MIA PaCa-2 and G3K cells incubated with 2-NBDG for 2 h. Scale bar, 10 μm. (F) Quantitation of the 2-NBDG intensity for MIA PaCa-2 and G3K cells without (MIA PaCa-2: n = 105; G3K: n = 67) and with gemcitabine treatment (MIA PaCa-2: n = 103; G3K: n = 68). The bars indicate means ± SEM. ∗∗p < 0.01, ∗∗∗p < 0.001.

References

    1. Altschuler S.J., Wu L.F. Cellular heterogeneity: do differences make a difference? Cell. 2010;141:559–563. - PMC - PubMed
    1. Baenke F., Peck B., Miess H., Schulze A. Hooked on fat: the role of lipid synthesis in cancer metabolism and tumour development. Dis. Models Mech. 2013;6:1353–1363. - PMC - PubMed
    1. Bi Y., Yang C., Chen Y., Yan S., Yang G., Wu Y., Zhang G., Wang P. Near-resonance enhanced label-free stimulated Raman scattering microscopy with spatial resolution near 130 nm. Light Sci. Appl. 2018;7:81. - PMC - PubMed
    1. Blasi T., Hennig H., Summers H.D., Theis F.J., Cerveira J., Patterson J.O., Davies D., Filby A., Carpenter A.E., Rees P. Label-free cell cycle analysis for high-throughput imaging flow cytometry. Nat. Commun. 2016;7:10256. - PMC - PubMed
    1. Charles H., Camp J., Yegnanarayanan S., Eftekhar A.A., Adibi A. Label-free flow cytometry using multiplex coherent anti-Stokes Raman scattering (MCARS) for the analysis of biological specimens. Opt. Lett. 2011;36:2309–2311. - PubMed