. 2020 Mar;30(3):361-374.
doi: 10.1101/gr.251405.119. Epub 2020 Mar 16.

Identification of FMR1-regulated molecular networks in human neurodevelopment

Affiliations

Identification of FMR1-regulated molecular networks in human neurodevelopment

Meng Li et al. Genome Res. 2020 Mar.

Abstract

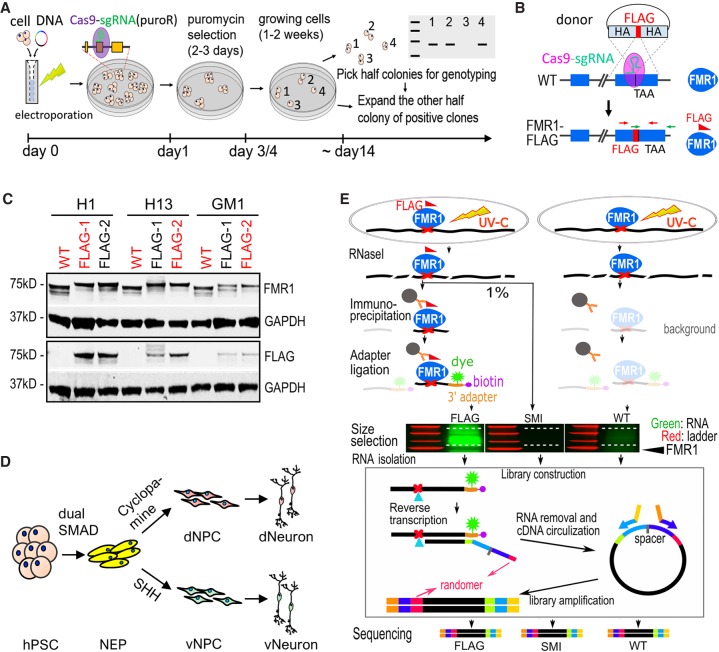
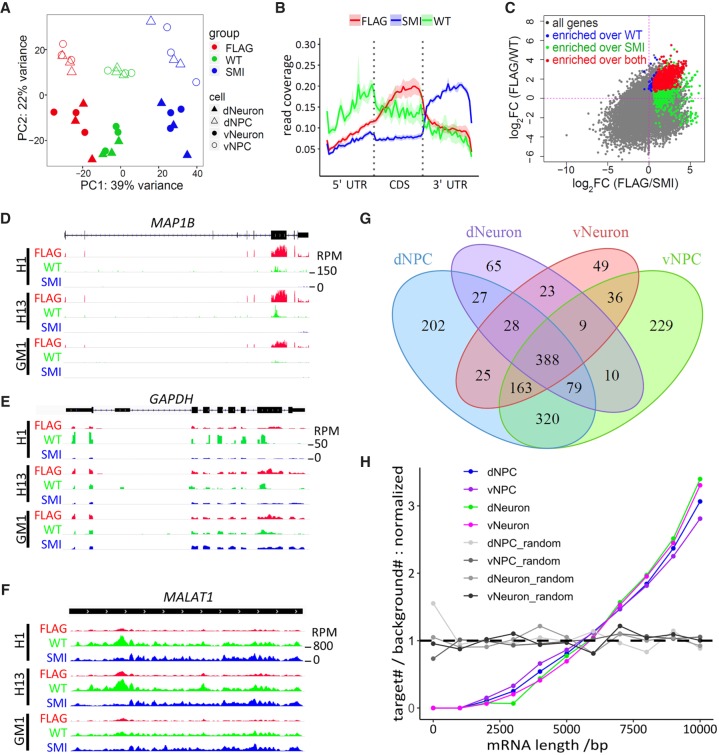
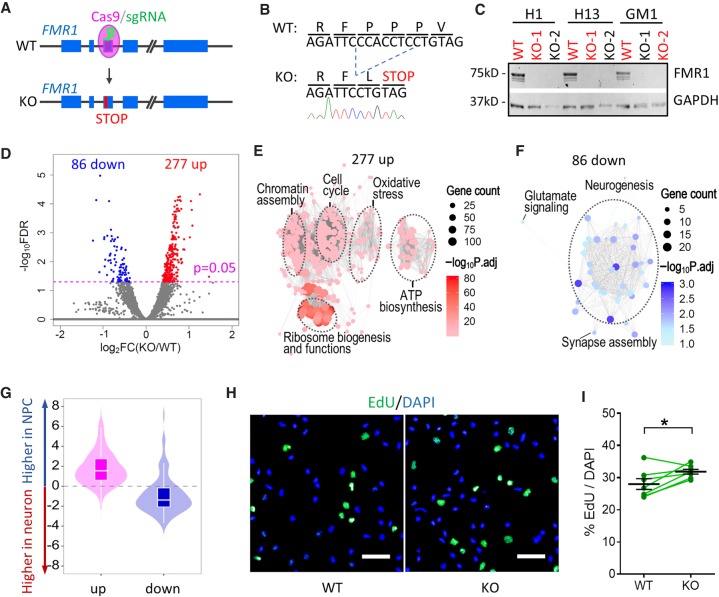
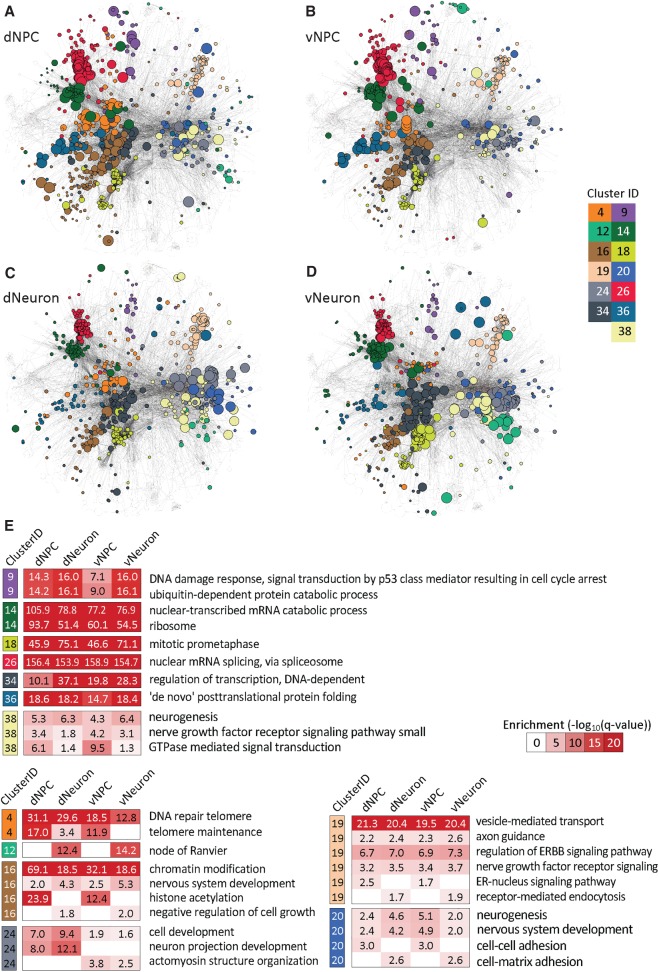
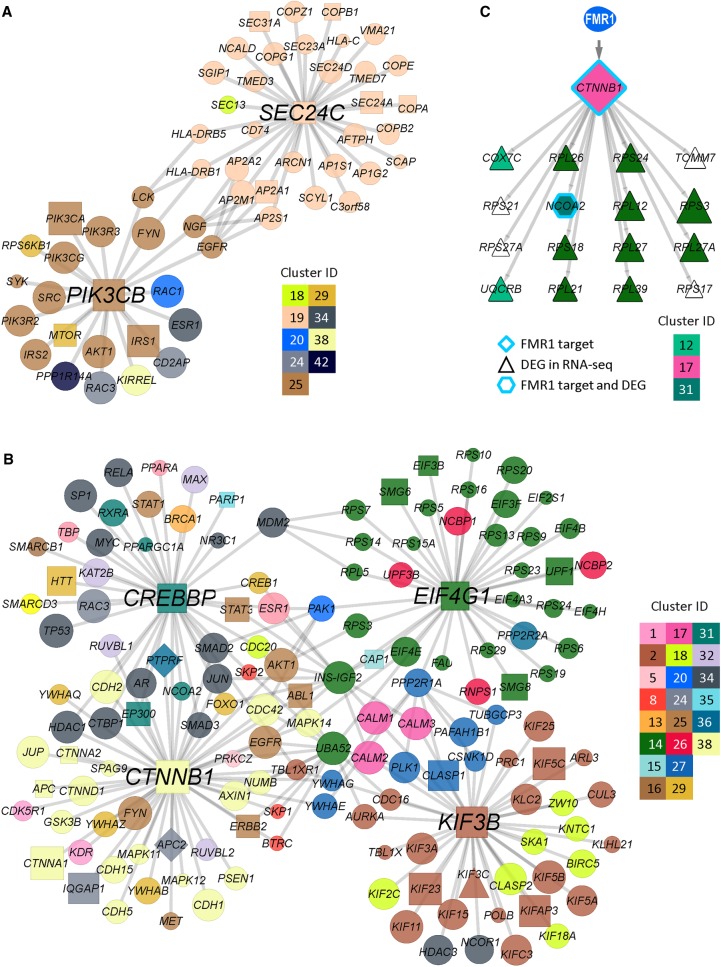
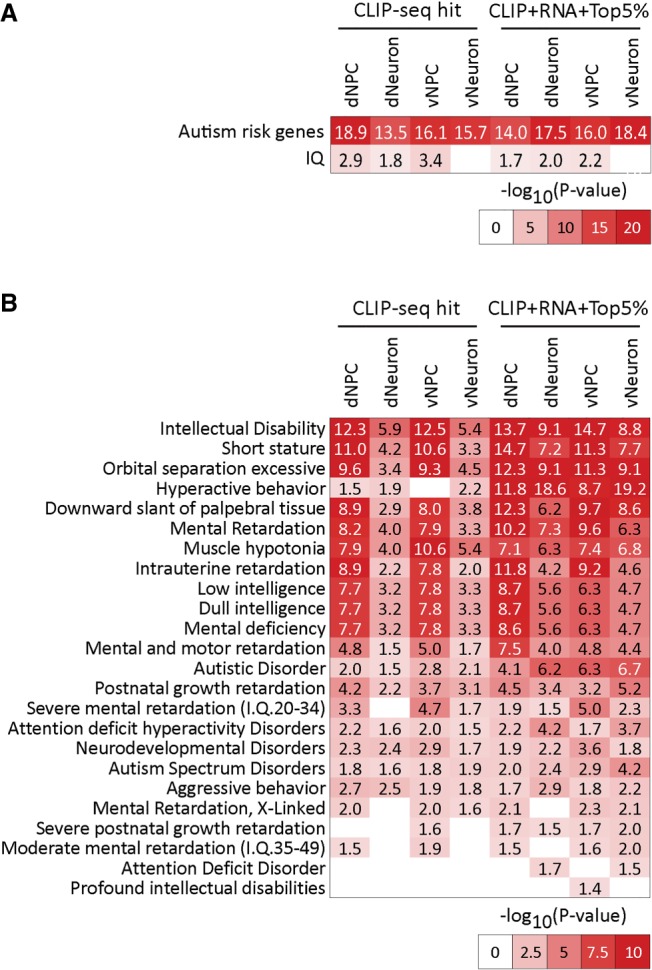
RNA-binding proteins (RNA-BPs) play critical roles in development and disease to regulate gene expression. However, genome-wide identification of their targets in primary human cells has been challenging. Here, we applied a modified CLIP-seq strategy to identify genome-wide targets of the FMRP translational regulator 1 (FMR1), a brain-enriched RNA-BP, whose deficiency leads to Fragile X Syndrome (FXS), the most prevalent inherited intellectual disability. We identified FMR1 targets in human dorsal and ventral forebrain neural progenitors and excitatory and inhibitory neurons differentiated from human pluripotent stem cells. In parallel, we measured the transcriptomes of the same four cell types upon FMR1 gene deletion. We discovered that FMR1 preferentially binds long transcripts in human neural cells. FMR1 targets include genes unique to human neural cells and associated with clinical phenotypes of FXS and autism. Integrative network analysis using graph diffusion and multitask clustering of FMR1 CLIP-seq and transcriptional targets reveals critical pathways regulated by FMR1 in human neural development. Our results demonstrate that FMR1 regulates a common set of targets among different neural cell types but also operates in a cell type-specific manner targeting distinct sets of genes in human excitatory and inhibitory neural progenitors and neurons. By defining molecular subnetworks and validating specific high-priority genes, we identify novel components of the FMR1 regulation program. Our results provide new insights into gene regulation by a critical neuronal RNA-BP in human neurodevelopment.


Figures

Figure 1.
Figure 1.
Generation of FMR1-FLAG hPSCs and neural cells for CLIP. (A) Schematic diagram of one-step seamless genome editing using CRISPR-Cas9. A Cas9-sgRNA plasmid also confers puromycin resistance (puroR) which allows for a temporary selection to obtain seamless genome editing in ∼2 wk. (B) Diagram of generation of FMR1-FLAG hPSCs using CRISPR-Cas9 and a donor plasmid for FLAG knock-in. Exons of FMR1 are shown as blue boxes. TAA indicates the position of a stop codon. HA represents homology arm, and crossed dash lines depict homology-directed recombination. (C) Western blot detecting FMR1 or FLAG in FMR1-FLAG and WT hPSCs, GAPDH as a loading control. hPSC lines in red were used for experiments. (D) Diagram of neural differentiation of hPSCs. Neuroepithelial cells (NEP) were differentiated from hPSCs by dual SMAD inhibition followed by patterning to forebrain dorsal NPCs (dNPC) and ventral MGE-like NPCs (vNPC) by modulating the SHH pathway. Patterned NPCs were further differentiated to neurons. (E) Flow chart of CLIP-seq. Both FMR1-FLAG and control (WT) cells were subjected to UV crosslinking. RNAs were partially digested by RNase I and FMR1-bound RNAs were immunoprecipitated using a FLAG antibody. Immunoprecipitated RNAs (and background levels of RNAs) were ligated to a fluorescent 3′ adapter for visualization (green) and reverse transcription. Randomers were incorporated in the RT primer to allow for removal of duplicated Illumina reads from individual cDNAs. A size-matched input (SMI) control, RNAs from FMR1-FLAG cells that were not immunoprecipitated but size-selected, was also used as a control.
Figure 2.
Figure 2.
Identification of FMR1 targets by CLIP in human neural cells. (A) PCA plot of CLIP-seq data. Color and shapes represent experimental conditions and cell types. (B) Line plots show relative distribution of reads over gene elements. (5′ UTR / 3′ UTR) 5′ and 3′ untranslated region, (CDS) coding sequence. Reads mapped to protein-coding genes of all samples were used for the analysis. Lines and shades represent mean ± SE. (C) Representative scatter plot of log2(fold change) (cell: dNPC) shows that FMR1 targets (red) were defined as significantly enriched in the FLAG group over both WT control (blue) and SMI control (green). Gray genes were not significantly enriched in the FLAG group over either control. (D–F) Visualization of reads by Integrative Genomics Viewer (IGV) (Thorvaldsdottir et al. 2013) on representative FMR1 target, MAP1B (D), and nontargets, GAPDH (E) and MALAT1 (F). Tracks of dNPC are shown. Scale of height (RPM) is the same for all tracks in the same panel. (G) Venn diagram showing overlaps of FMR1 targets identified in four cell types analyzed. (H) Analysis of length distribution of FMR1 targets in various cell types. Line plots show normalized ratio of number of targets to number of background genes at 1000-bp windows of mRNA lengths. The random sets were the same number of genes randomly picked from the background genes (protein-coding genes with a RPKM > 0.1). P < 2.2 × 10⁻¹⁶ for each of the four cell types, two-sample Kolmogorov–Smirnov test comparing targets to background genes.
Figure 3.
Figure 3.
Transcriptomic analysis of NPCs and neurons derived from WT and FMR1-KO hPSCs. (A) Schematic diagram of generation of isogenic FMR1 KO hPSCs using a seamless CRISPR-Cas9 strategy. (B) Sanger sequencing shows a 7-bp deletion in the FMR1 gene and a premature stop codon of FMR1 KO cells. (C) Western blot confirming knockout of FMR1 in FMR1 KO hPSCs, GAPDH as a loading control. hPSC lines in red were used for experiments. (D) Volcano plot of gene expression in WT and FMR1 KO dNPCs. (E) GO enrichment of the 277 genes up-regulated in FMR1 KO dNPCs. (F) GO enrichment of the 86 genes down-regulated in FMR1 KO dNPCs. (G) Violin and box plots of up-regulated (up) and down-regulated (down) genes in KO dNPCs with respect to their expression levels in dNPCs and dNeurons (Box plot: center line, median; box limits, upper and lower quartiles; whiskers, 1.5× interquartile range). (H) Representative images of EdU incorporation assay of dNPCs derived from H1 WT and KO hPSCs (scale bar, 50 µm). (I) Quantitative analysis of the percentage of EdU+ dNPCs (mean ± SE; dots and lines show batches of differentiation; P = 0.02, paired t-test, two tails).
Figure 4.
Figure 4.
Cell type–specific network clusters of CLIP- and RNA-seq integrative network analysis. (A–D) Cell type–specific network clusters for dNPC (A), vNPC (B), dNeuron (C), and vNeuron (D), identified from our integrative network clustering analysis approach using CLIP and RNA-seq data simultaneously. Node colors correspond to a cluster assignment, and the size of the node is proportional to node diffusion values, which assess the network proximity to the CLIP- and RNA-seq hits. Colors correspond to 13 clusters, seven of which are conserved across all cell types (9, 14, 18, 26, 34, 36, 38) and six clusters that exhibit cell type–specific patterns either among the NPC versus neurons or dorsal versus ventral cell types (4, 12, 16, 19, 20, 24). (E) Enriched Gene Ontology (GO) processes in the 13 clusters depicted in AD. Cluster IDs and color coding are the same as in AD. Red-white heat maps show significance of enrichment in a cluster from a particular cell type (−log10(FDR), hypergeometric test).
Figure 5.
Figure 5.
Hub genes and subnetworks in neural cells. (A,B) Hubs in dNeuron (A) and vNeuron (B) and the subnetworks consisting of the first neighbor genes of hubs. Node shapes discriminate between hits and nonhits and different types of hits. CLIP-seq target (square), RNA-seq DEG (triangle), both (diamond), and network prioritized genes (circle). Node sizes correspond to diffusion score, and node colors correspond to cluster assignments. (C) A proposed model of the relationship between FMR1 CLIP-seq targets and DEGs. Here, CTNNB1, which has been identified as an FMR1 direct target, encodes a predicted transcription factor regulating 16 DEGs. Node sizes and colors correspond to diffusion score and cluster assignment, respectively.
Figure 6.
Figure 6.
Disease and phenotype enrichment of FMR1 targets and prioritized genes in human neural cells. (A) Heat map of enrichment of autism risk genes and IQ-related in our CLIP-seq target set (left) and network diffusion-based augmented gene sets (right). (B) Heat map of enrichment of genes associated with neuronal diseases and symptoms from DisGeNet, in our CLIP-seq (left) and network diffusion augmented gene sets (right) in each of the four cell types. Enrichment was tested using FDR-corrected hypergeometric test. Numbers indicate −log10(FDR). Network diffusion-based gene sets include genes that were in the top 5% after diffusion.

References

    1. Abrahams BS, Arking DE, Campbell DB, Mefford HC, Morrow EM, Weiss LA, Menashe I, Wadkins T, Banerjee-Basu S, Packer A. 2013. SFARI Gene 2.0: a community-driven knowledgebase for the autism spectrum disorders (ASDs). Mol Autism 4: 36 10.1186/2040-2392-4-36 - DOI - PMC - PubMed
    1. Anderson S, Vanderhaeghen P. 2014. Cortical neurogenesis from pluripotent stem cells: complexity emerging from simplicity. Curr Opin Neurobiol 27: 151–157. 10.1016/j.conb.2014.03.012 - DOI - PMC - PubMed
    1. Ascano M Jr, Mukherjee N, Bandaru P, Miller JB, Nusbaum JD, Corcoran DL, Langlois C, Munschauer M, Dewell S, Hafner M, et al. 2012. FMRP targets distinct mRNA sequence elements to regulate protein expression. Nature 492: 382–386. 10.1038/nature11737 - DOI - PMC - PubMed
    1. Ashley CT Jr, Wilkinson KD, Reines D, Warren ST. 1993. FMR1 protein: conserved RNP family domains and selective RNA binding. Science 262: 563–566. 10.1126/science.7692601 - DOI - PubMed
    1. Avitzour M, Mor-Shaked H, Yanovsky-Dagan S, Aharoni S, Altarescu G, Renbaum P, Eldar-Geva T, Schonberger O, Levy-Lahad E, Epsztejn-Litman S, et al. 2014. FMR1 epigenetic silencing commonly occurs in undifferentiated fragile X-affected embryonic stem cells. Stem Cell Reports 3: 699–706. 10.1016/j.stemcr.2014.09.001 - DOI - PMC - PubMed

Publication types

Substances