. 2020 May;183(1):345-357.
doi: 10.1104/pp.19.01504. Epub 2020 Mar 16.

WRKY13 Enhances Cadmium Tolerance by Promoting D-CYSTEINE DESULFHYDRASE and Hydrogen Sulfide Production

Affiliations

WRKY13 Enhances Cadmium Tolerance by Promoting D-CYSTEINE DESULFHYDRASE and Hydrogen Sulfide Production

Qing Zhang et al. Plant Physiol. 2020 May.

Abstract

Hydrogen sulfide (H2S), a plant gasotransmitter, functions in the plant response to cadmium (Cd) stress, implying a role for cysteine desulfhydrase in producing H2S in this process. Whether d -CYSTEINE DESULFHYDRASE (DCD) acts in the plant Cd response remains to be identified, and if it does, how DCD is regulated in this process is also unknown. Here, we report that DCD-mediated H2S production enhances plant Cd tolerance in Arabidopsis (Arabidopsis thaliana). When subjected to Cd stress, a dcd mutant accumulated more Cd and reactive oxygen species and showed increased Cd sensitivity, whereas transgenic lines overexpressing DCD had decreased Cd and reactive oxygen species levels and were more tolerant to Cd stress compared with wild-type plants. Furthermore, the expression of DCD was stimulated by Cd stress, and this up-regulation was mediated by a Cd-induced transcription factor, WRKY13, which bound to the DCD promoter. Consistently, the higher Cd sensitivity of the wrky13-3 mutant was rescued by the overexpression of DCD Together, our results demonstrate that Cd-induced WRKY13 activates DCD expression to increase the production of H2S, leading to higher Cd tolerance in plants.


Figures

Figure 1.
Figure 1.
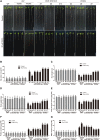
Cd stress-induced growth inhibition is aggravated in dcd but attenuated in DCDox. A, Representative images of 10-d-old seedlings grown on medium without or with 50 μm CdCl2. Bars = 10 mm. B, The endogenous H2S content in the 10-d-old wild type (WT), dcd, DCD::DCD dcd, and DCDox without or with 50 μm CdCl2. Data represent means ± se of three independent experiments, and different letters indicate significant differences between the annotated columns (P < 0.05 by Tukey’s test). C, Root length of 10-d-old wild-type, dcd, DCD::DCD dcd, and DCDox seedlings grown on medium without or with 50 μm CdCl2. Data represent means ± se; n ≥ 60. Different letters indicate significant differences between the annotated columns (P < 0.05 by Tukey’s test). The measurement was repeated three times with similar results. D to G, Fresh weight (D), total chlorophyll content (E), Pro content (F), and MDA content (G) of 10-d-old wild-type, dcd, DCD::DCD dcd, and DCDox seedlings grown on medium without or with 50 μm CdCl2. Data represent means ± se of three independent experiments, and different letters indicate significant differences between the annotated columns (P < 0.05 by Tukey’s test). FW, Fresh weight.
Figure 2.
Figure 2.
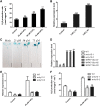
H2S improves Cd efflux capacity under Cd stress. A, Cd concentration in the root and shoot of 10-d-old wild-type seedlings treated without or with 0.1 mm NaHS under 50 μm CdCl2 treatment. Data are means ± se of three independent biological replicates. Asterisks indicate significant differences with respect to treatment with 50 μm CdCl2 (Student’s t test): ***, P < 0.001. FW, Fresh weight. B, Cd concentration in the root and shoot of 10-d-old wild-type (WT), dcd, DCD::DCD dcd, and DCDox seedlings under 50 μm CdCl2 treatment. Data are means ± se of three independent biological replicates. Asterisks indicate significant differences with respect to Cd concentration in the wild type (Student’s t test): ***, P < 0.001. C, The expression of PCR1, PCR2, and PDR8 in 5-d-old wild-type seedlings treated without or with 0.1 mm NaHS for 6 h assayed by RT-qPCR. The relative expression level was obtained by normalization to the expression level in wild-type plants without 0.1 mm NaHS treatment. Data represent means ± se of three independent experiments, and asterisks indicate significant differences (Student’s t test): ***, P < 0.001. D to F, The expression of PCR1 (D), PCR2 (E), and PDR8 (F) in 5-d-old wild-type, dcd, DCD::DCD dcd, and DCDox seedlings treated without or with 50 μm CdCl2 for 6 h assayed by RT-qPCR. The relative expression level was obtained by normalization to the expression level in wild-type plants without Cd treatment. Data represent means ± se of three independent experiments, and different letters indicate significant differences between the annotated columns (P < 0.05 by Tukey’s test). Three independent lines of DCD::DCD dcd (#7, #9, and #13) and DCDox (#2, #6, and #7) were used for all of the experiments mentioned in this article, with the same results. The data obtained for DCD::DCD dcd #9 and DCDox #6 are shown.
Figure 3.
Figure 3.
DCD modulates ROS homeostasis in plant tolerance to Cd stress. A, Representative images of DAB-stained leaves from 10-d-old wild-type seedlings grown on medium without or with 0.1 mm NaHS, 50 μm CdCl2, and 0.1 mm NaHS + 50 μm CdCl2. Bar = 1 cm. B, Representative images of DAB-stained leaves from 10-d-old wild-type (WT), dcd, DCD::DCD dcd, and DCDox seedlings grown on medium without or with 50 μm CdCl2. Bars = 1 cm. C, The relative DAB staining intensity in B. The DAB staining intensity of wild-type leaves without Cd treatment was set to 1. Data represent means ± se of three independent experiments, and different letters indicate significant differences between the annotated columns (P < 0.05 by Tukey’s test). D, Representative images of NBT-stained roots from 10-d-old wild-type, dcd, DCD::DCD dcd, and DCDox seedlings grown on medium without or with 50 μm CdCl2. Bars = 10 μm. E and F, CAT activity (E) and SOD activity (F) of 10-d-old wild-type, dcd, DCD::DCD dcd, and DCDox seedlings grown on medium without or with 50 μm CdCl2. Data represent means ± se of three independent experiments, and different letters indicate significant differences between the annotated columns (P < 0.05 by Tukey’s test).
Figure 4.
Figure 4.
WRKY13 regulates DCD expression and H2S production under Cd stress. A, d-CDes activity in 10-d-old wild-type seedlings without or with 25, 50, or 75 µm CdCl2 treatment. Data are means ± se of three independent biological replicates. Asterisks indicate significant differences with respect to the untreated control (Student’s t test): **, P < 0.01 and ***, P < 0.001. B, RT-qPCR analysis of DCD transcription level after treatment with 50 μm CdCl2 for 3 and 6 h in the 5-d-old wild type. Asterisks indicate significant differences with respect to the untreated control (Student’s t test): ***, P < 0.001. The experiments were repeated three times with similar results. C, GUS staining in DCD::DCD-GUS transgenic seedlings treated with or without 25, 50, or 75 μm CdCl2. Bars = 1 cm. D, RT-qPCR analysis of the DCD transcription level in the wild type (WT), wrky13, and WRKY13ox. Values are relative to the expression level in wild-type plants. E, RT-qPCR analysis of the DCD transcription level in the wild type and wrky13 mutants without or with 50 μm CdCl2 treatment for 6 h. Values are relative to the expression level in untreated wild-type plants. F, d-CDes activity in the wild type and wrky13 mutants without or with 50 μm CdCl2 treatment for 6 h. Data in D to F represent means ± se of three independent experiments. Asterisks indicate significant differences (Student’s t test): **, P < 0.01 and ***, P < 0.001.
Figure 5.
Figure 5.
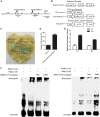
WRKY13 regulates the DCD transcript by directly binding to its promoter. A, Schematic diagram of the DNA fragments used for chromatin immunoprecipitation (ChIP) and the probes used for electrophoretic mobility shift assay (EMSA). The sequences 1 kb upstream of the start site and parts of the coding sequences of DCD are shown. The translational start site (ATG) is shown at position +1. The red triangles represent the locus of the W-box. B, A schematic of the DCD promoter reporter construct, the effector plasmid, and the transfection control plasmid. The ProDCD::GUS plasmid represents a GUS reporter driven by the full-length DCD promoter. C, GUS staining of the ProDCD::GUS reporter after coexpression of 35S:WRKY13-GFP in N. benthamiana. Coexpression of the ProDCD::GUS reporter and 35S empty vector was used as the effector plasmid control. D, Relative GUS activity of the ProDCD::GUS reporter after coexpression of 35S:WRKY13-GFP in N. benthamiana. Coexpression of the ProDCD::GUS reporter and 35S empty vector was used as the effector plasmid control. Data are presented as means ± se of three replicate experiments. Asterisks indicate significant differences with respect to the control (Student’s t test): ***P < 0.001. E, Enrichment of the indicated DNA fragments following ChIP using anti-GFP antibodies. Chromatin from WRKY13ox plants was immunoprecipitated using anti-GFP antibodies, and the presence of the indicated DNA in the immune complex was determined by RT-qPCR. The ChIP values were normalized to their respective DNA inputs. The experiments were repeated three times with similar results. The data shown are representative of three independent experiments. Error bars indicate the se of three technical replicates. F, EMSA of WRKY13 binding to DCD in vitro (P1 and P2). Biotin-labeled probes were incubated with WRKY13, and free and bound DNAs were separated on an acrylamide gel. As indicated, unlabeled probes were used as competitors.
Figure 6.
Figure 6.
Overexpression of DCD rescues the Cd-sensitive phenotype in the wrky13-3 mutant. A, Representative images of 10-d-old wild-type (WT), wrky13-3, DCDox, and DCDox wrky13-3 seedlings grown on medium without or with 50 μm CdCl2. Bars = 10 mm. B to D, Root length (B), fresh weight (C), and total chlorophyll content (D) of wild-type, wrky13-3, DCDox, and DCDox wrky13-3 seedlings grown on medium without or with 50 μm CdCl2. Data represent means ± se of three independent experiments, and different letters indicate significant differences between the annotated columns (P < 0.05 by Tukey’s test). FW, Fresh weight.
Figure 7.
Figure 7.
Model for the role of DCD in Cd stress. Cd stress-induced transcription factor WRKY13 directly binds to the DCD promoter to induce its expression and the production of H2S to enhance Cd tolerance in Arabidopsis. The generated H2S reduces Cd toxicity by reducing the content of ROS produced by Cd stress, and it also induces the expression of the Cd transporter genes (PCR1, PCR2, and PDR8) to reduce the accumulation of Cd and alleviate Cd stress.

Similar articles

Cited by

References

    1. Ahsan N, Nakamura T, Komatsu S(2012) Differential responses of microsomal proteins and metabolites in two contrasting cadmium (Cd)-accumulating soybean cultivars under Cd stress. Amino Acids 42: 317–327 - PubMed
    1. Alvarez C, Calo L, Romero LC, García I, Gotor C(2010) An O-acetylserine(thiol)lyase homolog with L-cysteine desulfhydrase activity regulates cysteine homeostasis in Arabidopsis. Plant Physiol 152: 656–669 - PMC - PubMed
    1. Bais HP, Weir TL, Perry LG, Gilroy S, Vivanco JM(2006) The role of root exudates in rhizosphere interactions with plants and other organisms. Annu Rev Plant Biol 57: 233–266 - PubMed
    1. Binkert M, Kozma-Bognár L, Terecskei K, De Veylder L, Nagy F, Ulm R(2014) UV-B-responsive association of the Arabidopsis bZIP transcription factor ELONGATED HYPOCOTYL5 with target genes, including its own promoter. Plant Cell 26: 4200–4213 - PMC - PubMed
    1. Brückner H, Westhauser T(2003) Chromatographic determination of L- and D-amino acids in plants. Amino Acids 24: 43–55 - PubMed

Publication types

MeSH terms

LinkOut - more resources