. 2020 Mar 31;117(13):7255-7262.
doi: 10.1073/pnas.1914794117. Epub 2020 Mar 16.

Environmental reservoir dynamics predict global infection patterns and population impacts for the fungal disease white-nose syndrome

Affiliations

Environmental reservoir dynamics predict global infection patterns and population impacts for the fungal disease white-nose syndrome

Joseph R Hoyt et al. Proc Natl Acad Sci U S A. .

Abstract

Disease outbreaks and pathogen introductions can have significant effects on host populations, and the ability of pathogens to persist in the environment can exacerbate disease impacts by fueling sustained transmission, seasonal epidemics, and repeated spillover events. While theory suggests that the presence of an environmental reservoir increases the risk of host declines and threat of extinction, the influence of reservoir dynamics on transmission and population impacts remains poorly described. Here we show that the extent of the environmental reservoir explains broad patterns of host infection and the severity of disease impacts of a virulent pathogen. We examined reservoir and host infection dynamics and the resulting impacts of Pseudogymnoascus destructans, the fungal pathogen that causes white-nose syndrome, in 39 species of bats at 101 sites across the globe. Lower levels of pathogen in the environment consistently corresponded to delayed infection of hosts, fewer and less severe infections, and reduced population impacts. In contrast, an extensive and persistent environmental reservoir led to early and widespread infections and severe population declines. These results suggest that continental differences in the persistence or decay of P. destructans in the environment altered infection patterns in bats and influenced whether host populations were stable or experienced severe declines from this disease. Quantifying the impact of the environmental reservoir on disease dynamics can provide specific targets for reducing pathogen levels in the environment to prevent or control future epidemics.

Keywords: Pseudogymnoascus destructans; environmental pathogen reservoir; global disease dynamics; white-nose syndrome.


Conflict of interest statement

The authors declare no competing interest.

Figures

Fig. 1.
Fig. 1.
Population growth rates for hibernating bats across Europe, Asia, and North America. Each dot shows an estimate of annual population change at a site for a species, with the size of the point scaled by log10 population size. The red line indicates population stability, and the black points and whiskers show the model predicted posterior mean, 95% credible intervals (thin lines), and ±1 SD of the posterior mean (thick lines) for each species across all regions (SI Appendix, Tables S2 and S3). (A) Bat population growth rates for species with >2 population growth estimates combined across Eurasia. (B) Bat population growth rates in North America (Left to Right) pre-P. destructans (Pd) invasion (all years prior to pathogen arrival), during P. destructans invasion (year 1), and following the invasion of P. destructans (years 2 to 4) (Fig. 2B). Color corresponds to average declines across species for each year since P. destructans arrival (individual panels).
Fig. 2.
Fig. 2.
Changes in P. destructans prevalence on bats and in the environmental reservoir from preinvasion through P. destructans establishment (years 2 to 4) in North America. Columns in each panel show the invasion and establishment of P. destructans in the environmental reservoir (A) and on bats (B) from Left to Right, over a total of 4 y of infection with all years prior to the arrival of P. destructans shown in a single column (pre-Pd invasion). Line color indicates the different type of bat species (B) or substrate type collected (A), far (>2 m from any bat), near (10 cm from the focal bat), and under (directly under or adjacent to the bat). Points indicate a prevalence estimate for an environmental sample type (A) or species (B) at a site, and the lines indicate the posterior mean for each environmental sample type (SI Appendix, Table S4) or species (SI Appendix, Table S5).
Fig. 3.
Fig. 3.
Global host and environmental reservoir dynamics of P. destructans over the winter (country panels). Solid lines indicate the mean of the posterior distribution for the prevalence of P. destructans for each species in a country sampled. Points represent prevalence estimates for a species or environmental sample at a site and the size of the point indicates the sample size. Red points on the map indicate the location of sample collection, and black lines link regions with corresponding graphs. Circles in the graphs show pathogen prevalence for a species or the environmental reservoir at a site, and lines show the mean of the posterior distribution for each species or environmental type in each region (SI Appendix, Tables S8 and S9). Dashed lines indicate predictions beyond the sampling dates. Prevalence of P. destructans in the environment is shown as the red line in each panel. Four-letter species codes correspond to the first 2 letters of the genus and species names for bats (SI Appendix, Table S1). The data from North America show the changes in prevalence for the first year of P. destructans invasion at a site and all subsequent years following the invasion of the fungus (years 2 to 4 combined from Fig. 2B) for comparison of dynamics across all regions.
Fig. 4.
Fig. 4.
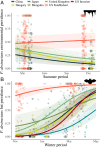
Changes in P. destructans prevalence in the environmental reservoir over the summer (A) and on bats over the winter (B). Solid lines indicate the mean of the posterior distribution for the prevalence of P. destructans for each country sampled, and transparent ribbons indicate ±1 SD of the posterior distribution. Points represent prevalence estimates for a species or environmental sample at a site, and the size of the point indicates the sample size. (A) Dynamics of P. destructans in the environmental reservoir over the summer. Data for all years over the summer are combined into “US Established” and shown as individual summer periods (1 to 3) in SI Appendix, Fig. S2A. (B) The change in prevalence on bats over the winter period. Data for the United States are split into 2 groups with separate lines (invasion and established 2 to 4 y postpathogen invasion) and the species are combined for each region (SI Appendix, Table S11).
Fig. 5.
Fig. 5.
Relationship between late winter P. destructans prevalence (A), fungal loads (B), and annual population growth rates (C) of bats and environmental reservoir prevalence in early winter. Black lines show the posterior mean and the gray ribbons show 95% credible intervals. The size of the points in each panel represents the sample size from bats (A and B) and the environment (C) for a species or the substrate sample at a site. The shape indicates the genus of the bat species for each point. (A and B) The relationship between late winter bat prevalence and early winter prevalence of P. destructans in the environment (within 10 cm of bats) [A; intercept: 0.45 (−0.43,1.39); slope: 1.91 (1.18,2.66)] and late winter fungal loads on bats and early winter prevalence of P. destructans in the environment [B; intercept: −3.26 (−3.66,−2.81); slope: 1.33 (1.14,1.53)]. Each point shows a prevalence estimate or mean fungal load for a species at a site and the contamination of P. destructans 10 cm around that species at a site. (C) The relationship between population growth rates for a bat species at a site and pathogen prevalence in the environment 10 cm around that species at a site in early winter [intercept: 0.18 (−0.14,0.51); slope: −1.47 (−2.01,−0.90)]. Each dot shows the prevalence of P. destructans in the environment 10 cm from around individuals of that species at a site in early winter (x axis) and the y axis shows the population growth rate (Nt+1/Nt) from the previous late winter, Nt, to the following late winter, Nt+1. The horizontal red line indicates population stability. bR2 are Bayesian R2 values, calculated as the variance of the predicted values divided by the variance of predicted values plus the variance of the errors.

References

    1. Jones K. E., et al. , Global trends in emerging infectious diseases. Nature 451, 990–993 (2008). - PMC - PubMed
    1. Wolfe N. D., Dunavan C. P., Diamond J., Origins of major human infectious diseases. Nature 447, 279–283 (2007). - PMC - PubMed
    1. Daszak P., Cunningham A. A., Hyatt A. D., Emerging infectious diseases of wildlife—Threats to biodiversity and human health. Science 287, 443–449 (2000). - PubMed
    1. Frick W. F., et al. , Disease alters macroecological patterns of North American bats. Glob. Ecol. Biogeogr. 24, 741–749 (2015).
    1. Scheele B. C., et al. , Amphibian fungal panzootic causes catastrophic and ongoing loss of biodiversity. Science 363, 1459–1463 (2019). - PubMed

Publication types