. 2020 Mar 31;117(13):7409-7417.
doi: 10.1073/pnas.1916329117. Epub 2020 Mar 16.

Macroscopic information-based taste representations in insular cortex are shaped by stimulus concentration

Affiliations

Macroscopic information-based taste representations in insular cortex are shaped by stimulus concentration

Emanuele Porcu et al. Proc Natl Acad Sci U S A. .

Abstract

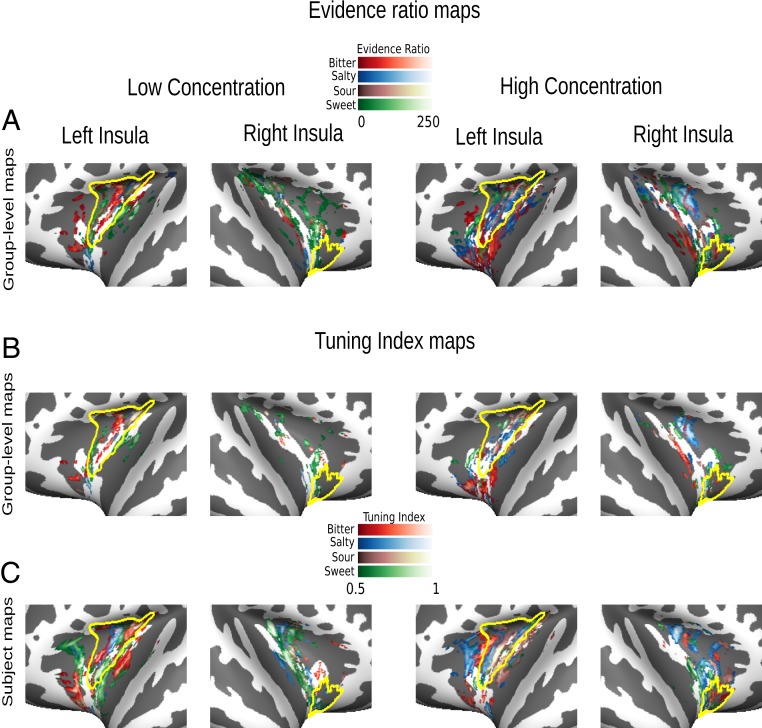
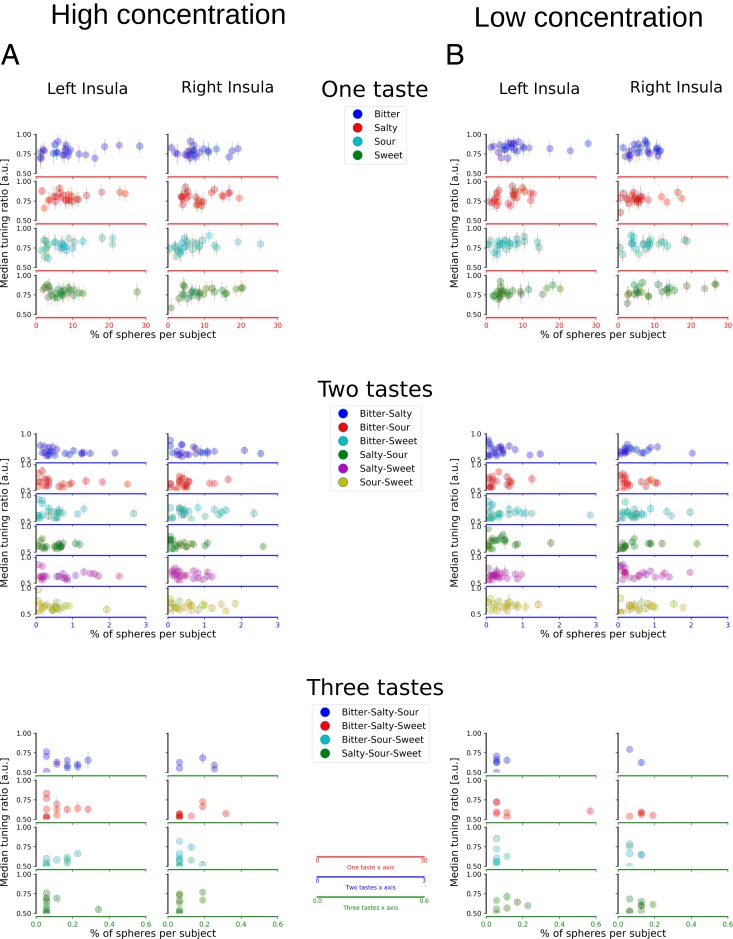
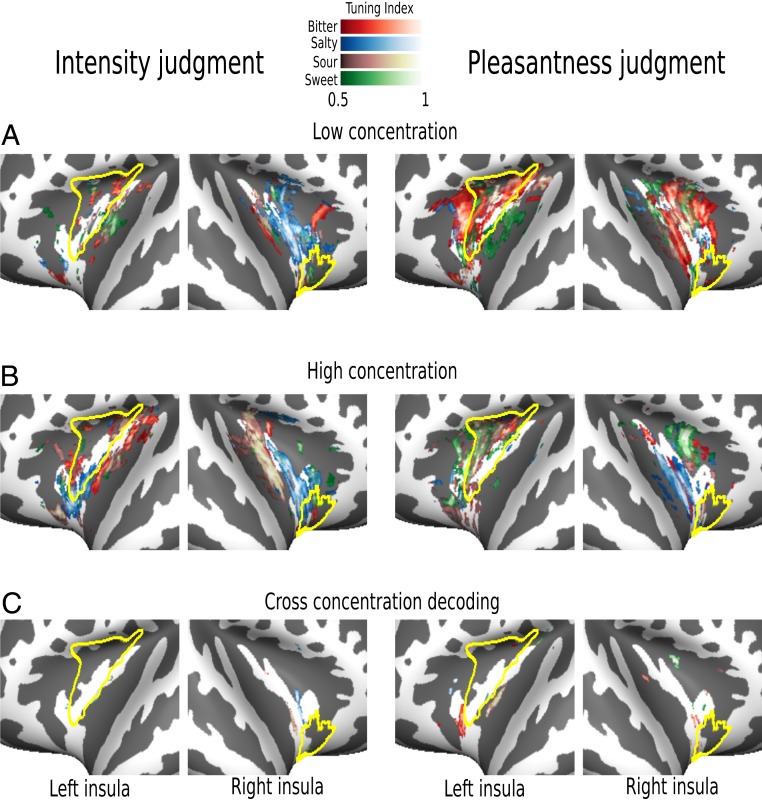
Taste processing is an essential ability in all animals signaling potential harm or benefit of ingestive behavior. However, current evidence for cortical taste representations remains contradictory. To address this issue, high-resolution functional MRI (fMRI) and multivariate pattern analysis were used to characterize taste-related informational content in human insular cortex, which contains primary gustatory cortex. Human participants judged pleasantness and intensity of low- and high-concentration tastes (salty, sweet, sour, and bitter) in two fMRI experiments on two different days to test for task- and concentration-invariant taste representations. We observed patterns of fMRI activity within insular cortex narrowly tuned to specific tastants consistently across tasks in all participants. Fewer patterns responded to more than one taste category. Importantly, changes in taste concentration altered the spatial layout of putative taste-specific patterns with distinct, almost nonoverlapping patterns for each taste category at different concentration levels. Together, our results point at macroscopic representations in human insular cortex as a complex function of taste category and concentration rather than representations based solely on taste identity.

Keywords: MVPA; concentration; fMRI; gustatory; human.


Conflict of interest statement

The authors declare no competing interest.

Figures

Fig. 1.
Fig. 1.
Cross-experiment taste maps. (A) Flat maps depict significant clusters of ERs (cluster-thresholded at pFWE <0.05 with an auxiliary voxel threshold of P < 0.001) in insular cortex at the group level, obtained through cross-experiment decoding. Plots were created by projecting three-dimensional brain voxels onto a two-dimensional surface via Nilearn 0.5.0 (40) and subsequently plotting the brain surfaces by using Visbrain 0.4.0 (45). Note that ERs for particular tastes can and do overlap as ERs represent reliability of our classification independently for each taste category. (B) Tuning maps depict spheres narrowly tuned to single tastes at the group level (thresholded at >0.5). (C) Tuning maps for an illustrative subject. The information provided by group-level maps may be misleading given the extreme variability of the insula’s functional microstructure (13, 14). Single-subject maps exhibit a stronger degree of spatial continuity for specific taste categories than the group-level maps. Left columns always represent low concentration tastes, and right columns represent high concentration tastes. Yellow lines depict GC as defined by Fan et al. (21); see SI Appendix, Figs. S2 and S3 for further information.
Fig. 2.
Fig. 2.
Subject-specific TIs. Scatter plots depict median TIs for all subjects (each dot represents a subject) separately for high (A) and low (B) concentrations in insular cortex (see SI Appendix, Figs. S2 and S3 for gustatory ROIs). The y axis represents the median TIs for a specific taste or a compound of tastes. A TI of 0.75 indicates that the ER for the preferred taste was three times higher than the second-highest ER (see Methods for further details). The x axis indicates the percentage of spheres which show a preferential tuning for a taste or a compound of tastes. Scatter plots, from top to bottom, represent percentage of spheres tuned to single tastes (two top columns), double tastes (two middle columns), and triple tastes (two bottom columns); the left and right columns of each taste configuration represent the left and right insula, respectively. Note that the x axis is scaled differently for single-, double- and triple-taste spheres (top, middle, and bottom columns) due to the decreasing number of spheres responsive to double- and triple-taste compounds.
Fig. 3.
Fig. 3.
Coactive spheres across taste concentrations. (A) Heat maps depict the coactivity index of spheres based on data from narrowly tuned spheres for the cross-experiment decoding. Coactivity is expressed as an index of overlapping spheres across concentrations, where 0 indicates the absence of overlap and 1 complete overlap. (B) Heat maps represent the coactivity index based on classifications for intensity judgments. (C) Heat maps represent the coactivity index for pleasantness judgments. The main diagonal represents coactive spheres coding for the identical taste category across concentrations. Values outside the main diagonal indicate a switch in taste preference as a function of concentration.
Fig. 4.
Fig. 4.
Within-experiments tuning maps. (A) Flat maps depict narrowly tuned spheres in insular cortex for low-concentration tastes, separately for intensity judgments (Left) and pleasantness judgments (Right). (B) Maps depict narrowly tuned spheres in insular cortex for high-concentration stimuli, for intensity (Left) and pleasantness (Right) judgments, respectively. (C) Plots depict maps representing tuning indices for cross-concentrations decoding for each taste category, separately for intensity (Left) and pleasantness (Right) judgments. Note that within concentration decoding produces consistent results (A and B), whereas cross-concentration decoding (C) reveals almost no consistent clustering. Yellow lines depict GC as defined by Fan et al. (21); see SI Appendix, Figs. S2 and S3 for further information.

References

    1. Wilson S. P., Bednar J. A., What, if anything, are topological maps for? Dev. Neurobiol. 75, 667–681 (2015). - PubMed
    1. Giessel A. J., Datta S. R., Olfactory maps, circuits and computations. Curr. Opin. Neurobiol. 24, 120–132 (2014). - PMC - PubMed
    1. Chen X., Gabitto M., Peng Y., Ryba N. J. P., Zuker C. S., A gustotopic map of taste qualities in the mammalian brain. Science 333, 1262–1266 (2011). - PMC - PubMed
    1. Accolla R., Bathellier B., Petersen C. C. H., Carleton A., Differential spatial representation of taste modalities in the rat gustatory cortex. J. Neurosci. 27, 1396–1404 (2007). - PMC - PubMed
    1. Katz D. B., Nicolelis M. A. L., Simon S. A., Gustatory processing is dynamic and distributed. Curr. Opin. Neurobiol. 12, 448–454 (2002). - PubMed

Publication types

LinkOut - more resources