. 2020 Mar 16;10(1):94.
doi: 10.1038/s41398-020-0776-z.

Elevated serum chemokine CCL22 levels in first-episode psychosis: associations with symptoms, peripheral immune state and in vivo brain glial cell function

Affiliations

Elevated serum chemokine CCL22 levels in first-episode psychosis: associations with symptoms, peripheral immune state and in vivo brain glial cell function

Heikki Laurikainen et al. Transl Psychiatry. .

Abstract

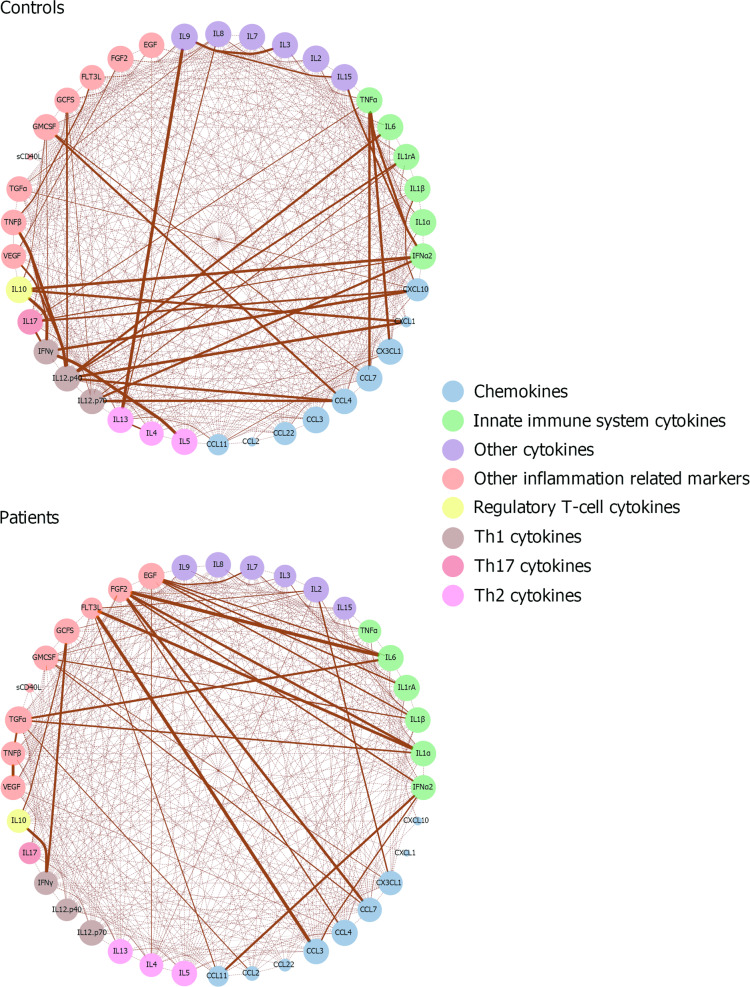
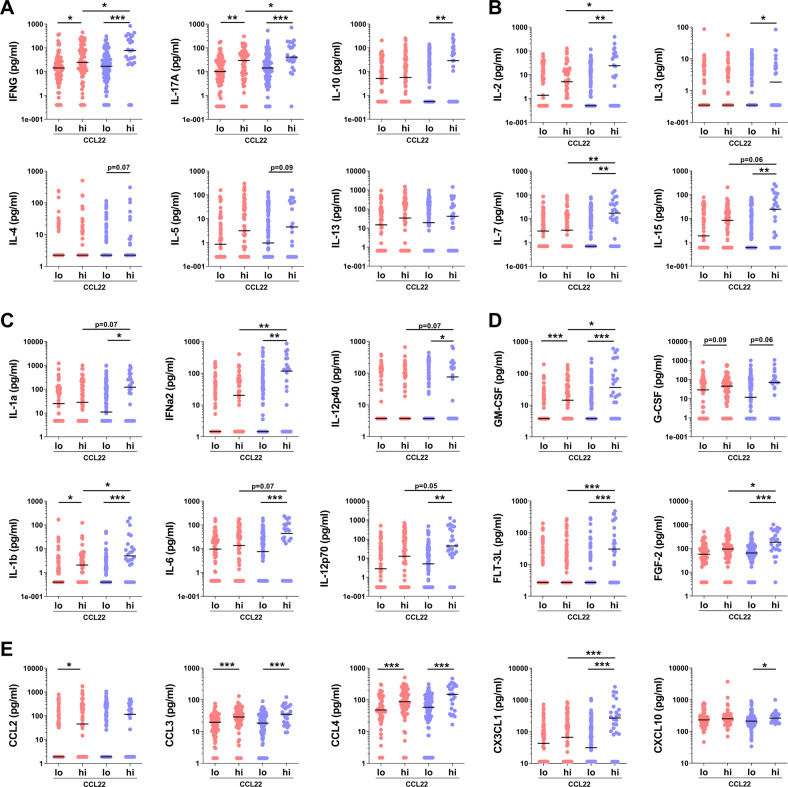
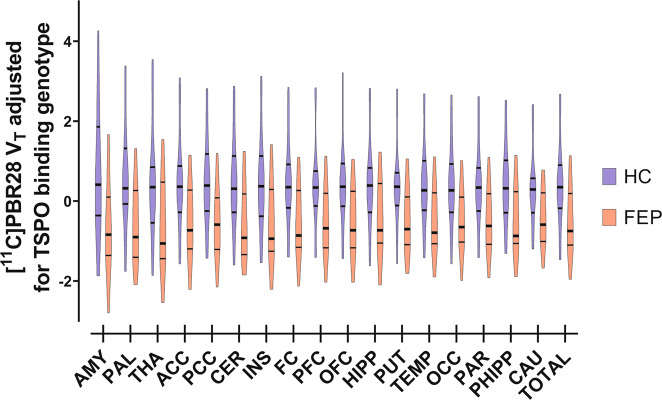
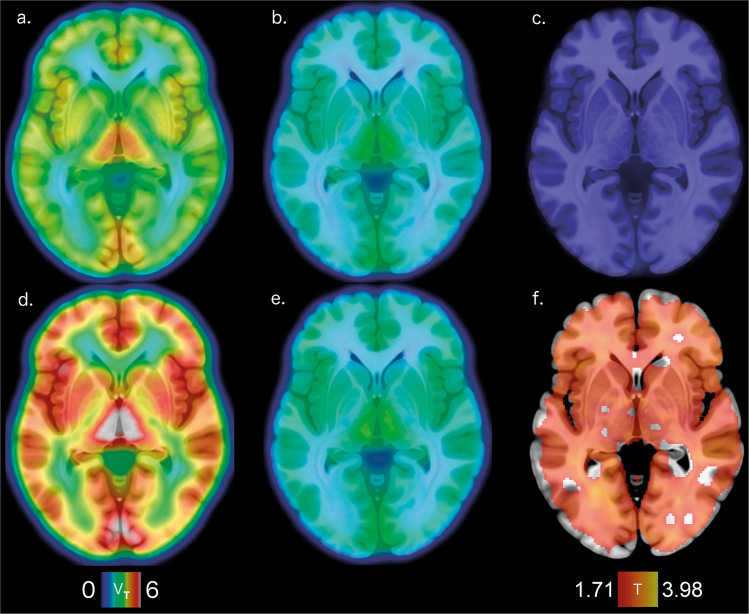
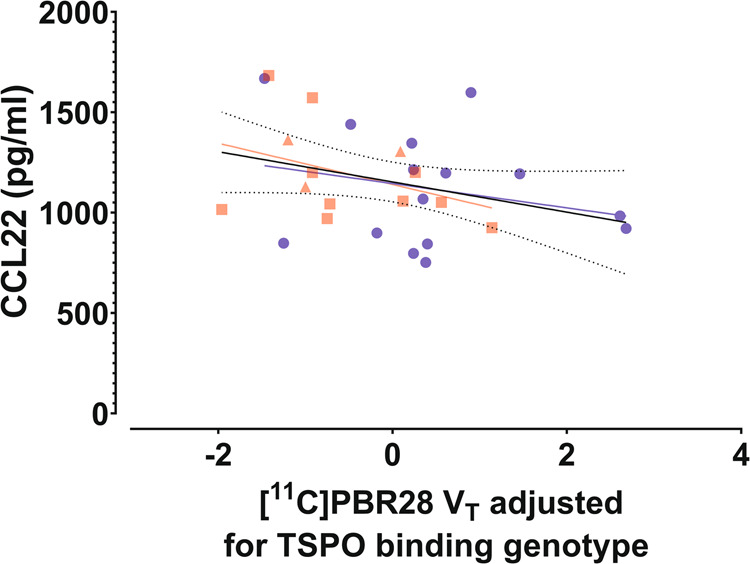
Several lines of research support immune system dysregulation in psychotic disorders. However, it remains unclear whether the immunological marker alterations are stable and how they associate with brain glial cell function. This longitudinal study aimed at investigating whether peripheral immune functions are altered in the early phases of psychotic disorders, whether the changes are associated with core symptoms, remission, brain glial cell function, and whether they persist in a one-year follow-up. Two independent cohorts comprising in total of 129 first-episode psychosis (FEP) patients and 130 controls were assessed at baseline and at the one-year follow-up. Serum cyto-/chemokines were measured using a 38-plex Luminex assay. The FEP patients showed a marked increase in chemokine CCL22 levels both at baseline (p < 0.0001; Cohen's d = 0.70) and at the 12-month follow-up (p = 0.0007) compared to controls. The group difference remained significant (p = 0.0019) after accounting for relevant covariates including BMI, smoking, and antipsychotic medication. Elevated serum CCL22 levels were significantly associated with hallucinations (ρ = 0.20) and disorganization (ρ = 0.23), and with worse verbal performance (ρ = -0.23). Brain glial cell activity was indexed with positron emission tomography and the translocator protein radiotracer [11C]PBR28 in subgroups of 15 healthy controls and 14 FEP patients with serum CCL22/CCL17 measurements. The distribution volume (VT) of [11C]PBR28 was lower in patients compared to controls (p = 0.026; Cohen's d = 0.94) without regionally specific effects, and was inversely associated with serum CCL22 and CCL17 levels (p = 0.036). Our results do not support the over-active microglia hypothesis of psychosis, but indicate altered CCR4 immune signaling in early psychosis with behavioral correlates possibly mediated through cross-talk between chemokine networks and dysfunctional or a decreased number of glial cells.


Conflict of interest statement

The authors declare that they have no conflict of interest.

Figures

Fig. 1
Fig. 1. Spearman’s rank correlation coefficient networks of cyto- and chemokines in patients and controls.
Correlations which are statistically significant after Bonferroni correction are presented. The strength of the line connecting two nodes (circles) reflects the degree of correlation, and the size of node for each cyto-and chemokine reflect the number and strength of correlations they have with other cyto- and chemokines. The nodes are grouped by color to structurally or functionally similar signaling molecules.
Fig. 2
Fig. 2. Cytokine, chemokine and growth factor concentration in FEP patients (red circles) and in control subjects with low or high CCL22.
a Type cytokines of Th1, Th17 and Th2 cells and Tregs, b cytokines regulating T-cell activity and proliferation, c innate immunity cytokines, d growth factors and e chemokines. Black horizontal lines represents the median values. Y-axis show concentrations in logarithmic scale for visualization purposes. Linear concentration values were used to calculate p values using the Wilcoxon two sample test. *p < 0.05, **p < 0.01 and ***p < 0.001.
Fig. 3
Fig. 3. VT of [11C]PBR28, adjusted for the effect of TSPO binding genotype, is lower in first episode psychosis patients (FEP, red bars, n = 13) than in healthy controls (HC, blue bars, n = 15) without significant differences between regions (df = 1, F = 5.635, p = 0.026; Cohen’s d = 0.936).
The width of the figures represent the probability density at different values of adjusted VT in 17 VOIs and their composite VOI. The VOIs are arranged in order of decreasing maximum mean of HC VT. Thick lines inside the figures indicate the median value, while the thin lines represent upper and lower quartiles. Abbreviations: ACC, anterior cingulate cortex; AMY, amygdala; CAU, caudate nucleus; CER, cerebellum; FC, frontal cortex; HIPP, hippocampus; INS, insula; OCC, occipital cortex; OFC, orbitofrontal cortex; PAR, parietal cortex; PCC, posterior cingulate cortex; PFC, prefrontal cortex; PHIPP, parahippocampal gyrus; PUT, putamen; TEMP, temporal cortex; THA, thalamus; TOTAL, composite VOI.
Fig. 4
Fig. 4. Voxel-wise tests of [11C]PBR28 VT.
ae Representative planes of mean [11C]PBR28 VT in parametric images overlaid upon a anatomical reference template: a FEP HAB genotype subjects (n=8), b FEP MAB genotype subjects (n=5), c FEP LAB genotype subject (n=1), d HC HAB genotype subjects (n=9) and e HC MAB genotype subjects (n=6) separately. The color representation of VT, shown in the color bar on the lower left, is adjusted to to cover the variance between LAB, MAB, and HAB subjects in both groups. f A statistical parametric mapping (SPM) analysis shows one extensive cluster of lower VT in FEPs (n=13) compared to HCs (n=15) visualized here with a red to yellow gradient representing voxel-wise T-score values. The lower limit of the color bar on the lower right shows the T-score height threshold and the upper limit denotes maximum peak value.
Fig. 5
Fig. 5. Association of brain [11C]PBR28 VT to serum CCL17 level.
Total GM VT of [11C]PBR28, adjusted for the effect of TSPO binding genotype, is shown plotted against peripheral blood serum concentrations of CCL17 in first episode psychosis patients (FEP; red squares for non-affective psychoses, n = 10; red triangles for affective psychoses, n = 3) and healthy controls (HC; blue squares, n = 15). A simple linear regression was used to test for association of adjusted VT and CCL22 concentration in the whole sample, and within both groups separately. A statistically significant linear effect was found in the whole sample (F(1,26) = 4.361, p = 0.047), with an R2 of 0.144. The solid black line represents the linear regression line and the dotted black lines show the 95% confidence intervals of the fit. The best fit linear regression lines of the FEP and HC groups are shown as red and blue lines, respectively.
Fig. 6
Fig. 6. Association of brain [11C]PBR28 VT to serum CCL22 level.
Total GM VT of [11C]PBR28, adjusted for the effect of TSPO binding genotype, is shown plotted against peripheral blood serum concentrations of CCL22 in first episode psychosis patients (FEP; red squares for non-affective psychoses, n = 10; red triangles for affective psychoses, n = 3) and healthy controls (HC; blue squares, n = 15). A simple linear regression was used to test for association of adjusted VT and CCL22 concentration in the whole sample, and both groups separately. A trend level statistically significant linear effect was found in the combined sample (F(1,26) = 3.017, p = 0.09), with an R2 of 0.104. The solid black line represents the linear regression line and the dotted black lines show the 95% confidence intervals of the fit. The best fit linear regression lines of the FEP and HC groups are shown as red and blue lines, respectively.

References

    1. Goldsmith DR, Rapaport MH, Miller BJ. A meta-analysis of blood cytokine network alterations in psychiatric patients: comparisons between schizophrenia, bipolar disorder and depression. Mol. Psychiatry. 2016;21:1696–1709. - PMC - PubMed
    1. Frydecka D, et al. Profiling inflammatory signatures of schizophrenia: a cross-sectional and meta-analysis study. Brain Behav. Immun. 2018;71:28–36. - PubMed
    1. Wang AK, Miller BJ. Meta-analysis of cerebrospinal fluid cytokine and tryptophan catabolite alterations in psychiatric patients: comparisons between schizophrenia, bipolar disorder, and depression. Schizophr. Bull. 2018;44:75–83. - PMC - PubMed
    1. Volk DW. Role of microglia disturbances and immune-related marker abnormalities in cortical circuitry dysfunction in schizophrenia. Neurobiol. Dis. 2017;99:58–65. - PMC - PubMed
    1. Fillman SG, et al. Elevated peripheral cytokines characterize a subgroup of people with schizophrenia displaying poor verbal fluency and reduced Broca’s area volume. Mol. Psychiatry. 2016;21:1090–1098. - PMC - PubMed

Publication types