. 2020 Jun;45(7):1159-1170.
doi: 10.1038/s41386-020-0656-5. Epub 2020 Mar 16.

Targeting inhibitory cerebellar circuitry to alleviate behavioral deficits in a mouse model for studying idiopathic autism

Affiliations

Targeting inhibitory cerebellar circuitry to alleviate behavioral deficits in a mouse model for studying idiopathic autism

Owen Y Chao et al. Neuropsychopharmacology. 2020 Jun.

Abstract

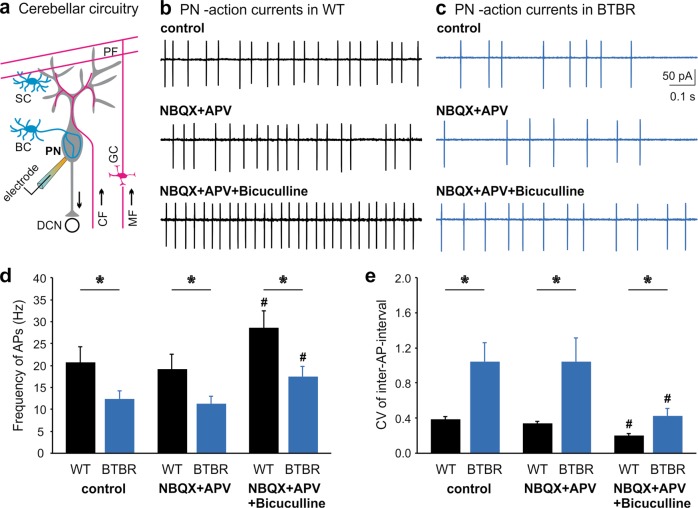
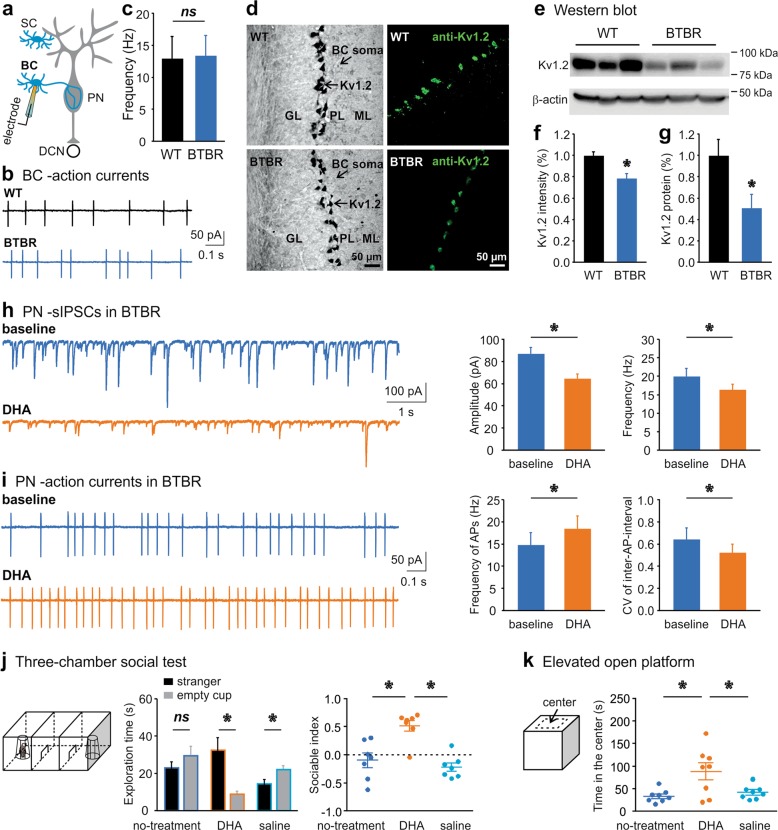
Autism spectrum disorder (ASD) encompasses wide-ranging neuropsychiatric symptoms with unclear etiology. Although the cerebellum is a key region implicated in ASD, it remains elusive how the cerebellar circuitry is altered and whether the cerebellum can serve as a therapeutic target to rectify the phenotype of idiopathic ASD with polygenic abnormalities. Using a syndromic ASD model, e.g., Black and Tan BRachyury T+Itpr3tf/J (BTBR) mice, we revealed that increased excitability of presynaptic interneurons (INs) and decreased intrinsic excitability of postsynaptic Purkinje neurons (PNs) resulted in low PN firing rates in the cerebellum. Knowing that downregulation of Kv1.2 potassium channel in the IN nerve terminals likely augmented their excitability and GABA release, we applied a positive Kv1.2 modulator to mitigate the presynaptic over-inhibition and social impairment of BTBR mice. Selective restoration of the PN activity by a new chemogenetic approach alleviated core ASD-like behaviors of the BTBR strain. These findings highlight complex mechanisms converging onto the cerebellar dysfunction in the phenotypic model and provide effective strategies for potential therapies of ASD.


Figures

Fig. 1
Fig. 1. Reduced firing activity of PNs in the BTBR cerebellum.
a Schematics of cerebellar circuitry including excitatory and inhibitory inputs to a PN. BC basket cell, SC stellate cell, DCN deep cerebellar nuclei, CF climbing fiber, MF mossy fiber, PF parallel fiber, GC granule cell. (b, c Representative action currents (i.e., APs in the voltage-clamp mode) from PNs recorded in the cell-attached configuration from WT (b) and BTBR (c) brain slices in the absence (control, top panels) or presence of AMPA-receptor and NMDA-receptor blockers NBQX (10 μM) and APV (50 μM) (middle panels), or in a combination of NBQX, APV, and a GABAA receptor blocker bicuculline (10 μM, bottom panels). d Summary of frequency of APs from WT (black bars, n = 10) and BTBR (blue bars, n = 10) PNs in the aforementioned conditions (b, c). The frequency is the reciprocal of each inter-AP-intervals. e Summarized coefficient of variation (CV) of inter-AP-intervals for the same WT (black bars, n = 10) and BTBR (blue bars, n = 10) neurons. # indicates significant differences between “NBQX + APV + bicuculline” and “control” conditions within each group. Data are represented as mean ± s.e.m. Asterisks (*) or “ns” denotes statistical significance (p < 0.05) or “not significant” respectively in this and following figures.
Fig. 2
Fig. 2. Excessive GABA release from INs and decreased intrinsic excitability of PNs in the BTBR synapses.
a, b IPSCs recorded in the whole-cell mode at a holding potential of −60 mV from PNs of WT (a) and BTBR (b) mice in NBQX (10 μM) and APV (50 μM) to block excitatory inputs. The same PNs were then exposed to TTX (1 μM) or bicuculline (10 μM). c, d Summary of the amplitude (c) and frequency (d) of IPSCs for WT (black bars) and BTBR (blue bars) PNs before (n = 16 for WT and BTBR) and after TTX exposure (n = 13 for WT; n = 9 for BTBR). The frequency is calculated as the reciprocal of each inter-IPSC-intervals and averaged for each neuron. e APs evoked by current steps (top) from a WT (middle) or BTBR (bottom) PN. All synaptic inputs are blocked by NBQX (10 μM), APV (50 μM) and bicuculline (10 μM). f, g Steady-state potentials (f) measured within last 5 ms of each evoked potential and number of spikes (g) generated by the current steps in WT (n = 10, black) and BTBR (n = 10, blue) neurons. Solid lines represent fits to a single exponential function: f(t) = Ae−t/τ +C (f) or a Boltzmann function: f(I) = Vmax/(1 + e(Imid-I)/Ic)+C (g). “Vmax” is theoretical value of the maximal number of APs; “Imid” is depolarization current needed to produce half of the maximal number of APs; “Ic” is steepness of the Boltzmann curve. h, i Summary of FO (h) and FSS (i) for WT (n = 10, black) and BTBR (n = 10, blue) PNs. FO and FSS are derived from the first and last inter-spike intervals, respectively (e). (j) Overlay of first spikes from a WT (black) and a BTBR (blue) PN, evoked by a current step of 1.1 nA. k, l Phase plane plots of the first spikes from WT (k) and BTBR (l) cells. m, n Maximal value of dV/dt (dV/dt Max, m) and spike threshold, i.e., the voltage where dV/dt reaches 5% of its maximum (n) are summarized for WT (n = 10, black bars) and BTBR (n = 10, blue bars) groups.
Fig. 3
Fig. 3. A Kv1.2 agonist alleviates inhibitory overtone in the cerebellar circuits and autistic behaviors of BTBR mice.
a Schematics of recording configuration from a basket cell (BC) in NBQX (10 μM) and APV (50 μM) to isolate inhibitory inputs. b Cell-attached patch-clamp recordings of APs from a WT (top) and BTBR (bottom) BC soma. c Summary of firing frequency for WT (n = 8, black) and BTBR (n = 7, blue) BCs. d Confocal images of Kv1.2 immunolabeling (left: DAB staining; right: fluorescent staining) in WT (top) and BTBR (bottom) cerebellum. GL granular layer, PL Purkinje layer, ML molecular layer. e Western blot of Kv1.2 from WT and BTBR cerebellar homogenates. f, g Normalized (to the mean values of WT group) fluorescence intensity of Kv1.2 labeling (f) or amount of Kv1.2 protein (g) detected by Western blots for both groups (n = 3 mice for each). h sIPSCs (isolated by 10 µM NBQX and 50 μM APV) recorded from a PN in a BTBR brain slice before (baseline, blue) and after perfusion of DHA (100 µM, orange). Changes in amplitude and frequency of sIPSC are summarized on the right (n = 8). i APs elicited from a PN in the same condition as in h. DHA increases spike frequency (left) and decreases coefficient of variation (CV, right) of inter-AP-intervals of BTBR PNs (n = 7). j Illustration of three-chamber sociability test (trial 2) on the left. Time spent on exploring the stranger (black bars) or empty cup (gray bars) by BTBR mice (n = 8) is plotted for each condition: before and after DHA (200 mg/kg) or saline injection (middle). Compared to no- or saline-treatment, DHA increases sociable index (right). (k) Setup of elevated open platform, which is virtually divided into center and edge areas (left). Time spent in the center, an indicator of anxiety, is summarized for the three conditions (n = 8, right).
Fig. 4
Fig. 4. Expression of excitatory DREADD in PNs enhances their firing activity in the BTBR cerebellar cortex.
a Example of AAV-carried DREADD expression in the BTBR cerebellum. b Selective targeting of PNs by AAV8-Pcp2-hM3Dq-mCherry (hM3Dq). ML molecular layer, GL granular layer. c APs elicited from PNs transduced with hM3Dq (left) or AAV8-Pcp2-mCherry (mCherry, right) before (blue) and after bath application of CNO (10 µM, magenta). d Frequencies of APs are quantified for the above conditions (n = 9 for hM3Dq, n = 6 for mCherry). e APs generated by depolarization steps (top) from a PN transduced with hM3Dq (left) or mCherry (right) before (blue) and after CNO perfusion (10 µM, magenta) in cocktail blockers of NBQX (10 μM), APV (50 μM) and bicuculline (10 μM). f, g Changes in membrane potentials (left) and numbers of spikes (right) made by CNO are summarized for hM3Dq (f, n = 10) and mCherry (g, n = 10) groups. Solid lines represent fits to a Boltzmann function: f(I) = Vmax/(1 + e(Imid-I)/Ic)+C, in which “Vmax” is theoretical value of the maximal number of APs, “Imid” is depolarization current needed to produce half of the maximal number of APs, and “Ic” is steepness of the Boltzmann curve.
Fig. 5
Fig. 5. Behavioral rescues by chemogenetic excitation of PNs in the BTBR cerebellum.
a Design for intracranial injection of AAV8-Pcp2-mCherry (mCherry) or AAV8-Pcp2-hM3Dq-mCherry (hM3Dq) at postnatal day (P) 5 to target PNs in the entire cerebellum (Crb) of BTBR mice as depicted in Fig. 4. After 25 days of transduction, animals are subjected to behavioral tests following CNO injections (1 mg/kg, i.p.). b In the sociability session of a three-chamber test (left), BTBR mice transduced with mCherry spent equal time exploring the stranger (black bars) and empty cup (gray bars) but BTBR mice transduced with hM3Dq approach the stranger more than empty cup (middle), rendering a higher sociable index (filled circles) than mCherry (empty circles) group (n = 7 for each, right). c Distance traveled (left) and time spent on grooming (right) in the open-field test are quantified for three successive periods. BTBR mice injected with hM3Dq (n = 7, filled circles) groom less than those with mCherry (n = 8, empty circles) in the last two intervals. d Schematics of an object-based attention test consisting of learning and test trials (left). In the test trial, hM3Dq group (n = 7) explore the new (gray bars) more than old (black bars) object while mCherry group (n = 8) do not (middle), generating a more positive index for hM3Dq (filled circles) than for mCherry (empty circles) cohort (right). eg Within-subject design (e) for infusion of hM3Dq to target PNs in lobules VI & VIIa (f) of ~2-months-old BTBR mice via stereotaxic surgery. Three weeks later, animals are subjected to behavioral tests following alternating CNO (1 mg/kg) or saline administrations. In the three-chamber sociability test (g), animals treated by CNO (to activate hM3Dq receptors) explore the stranger more than empty cup, giving a greater sociable index (magenta) than the saline (blue) group (n = 8 for each).

References

    1. Lai MC, Lombardo MV, Baron-Cohen S. Autism. Lancet. 2014;383:896–910. - PubMed
    1. Baio J, Wiggins L, Christensen DL, Maenner MJ, Daniels J, Warren Z, et al. Prevalence of autism spectrum disorder among children aged 8 years—autism and developmental disabilities monitoring network, 11 sites, United States, 2014. MMWR Surveill Summ. 2018;67:1–23. - PMC - PubMed
    1. Weiss LA, Arking DE, Gene Discovery Project of Johns H, the Autism C. Daly MJ, Chakravarti A. A genome-wide linkage and association scan reveals novel loci for autism. Nature. 2009;461:802–8. - PMC - PubMed
    1. Pinto D, Pagnamenta AT, Klei L, Anney R, Merico D, Regan R, et al. Functional impact of global rare copy number variation in autism spectrum disorders. Nature. 2010;466:368–72. - PMC - PubMed
    1. Yuen RKC, Merico D, Bookman MJLH, Thiruvahindrapuram B, Patel RV, et al. Whole genome sequencing resource identifies 18 new candidate genes for autism spectrum disorder. Nat Neurosci. 2017;20:602–11. - PMC - PubMed

Publication types