. 2020 Mar 1;143(3):1010-1026.
doi: 10.1093/brain/awaa033.

Neuroinflammation and protein aggregation co-localize across the frontotemporal dementia spectrum

Affiliations

Neuroinflammation and protein aggregation co-localize across the frontotemporal dementia spectrum

W Richard Bevan-Jones et al. Brain. .

Abstract

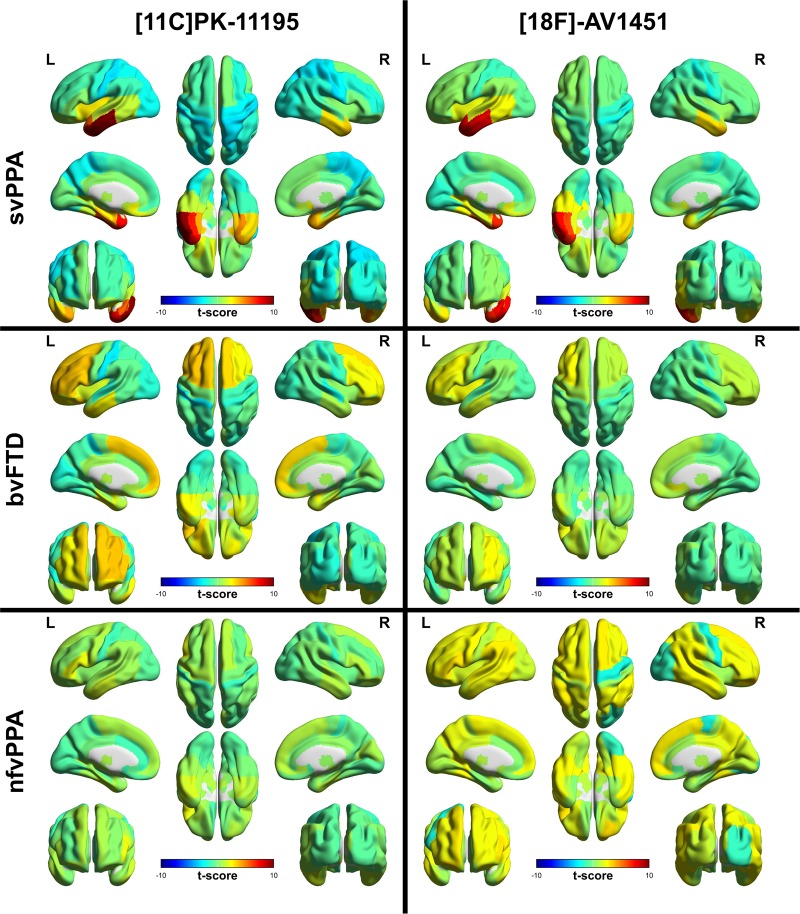
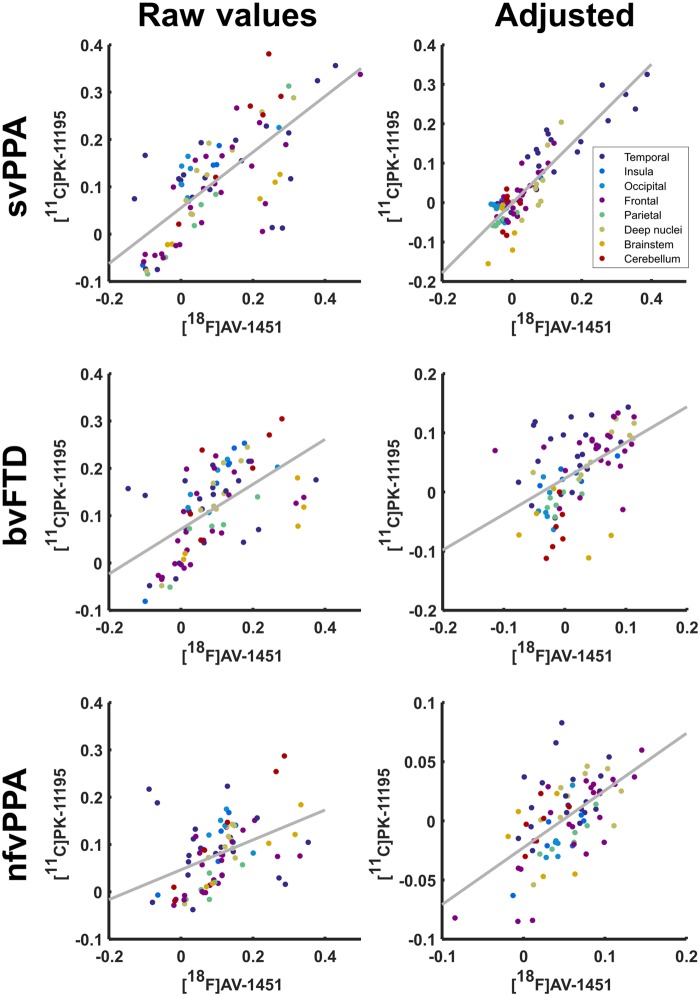
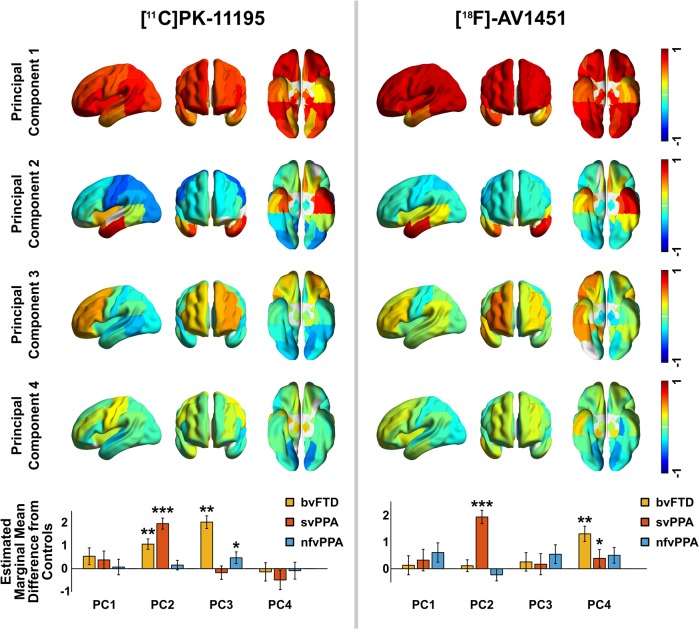
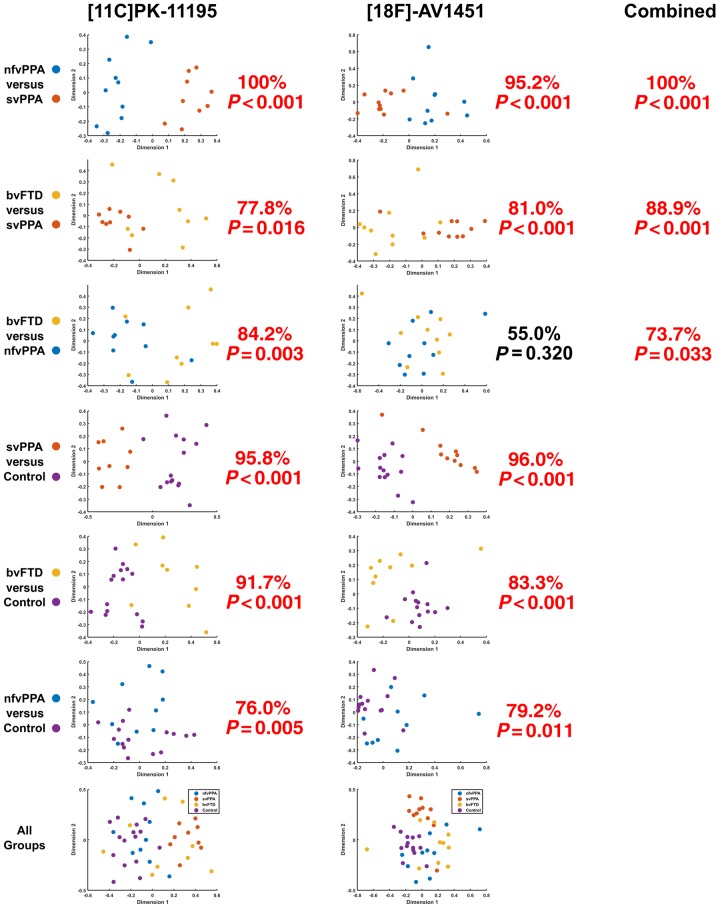
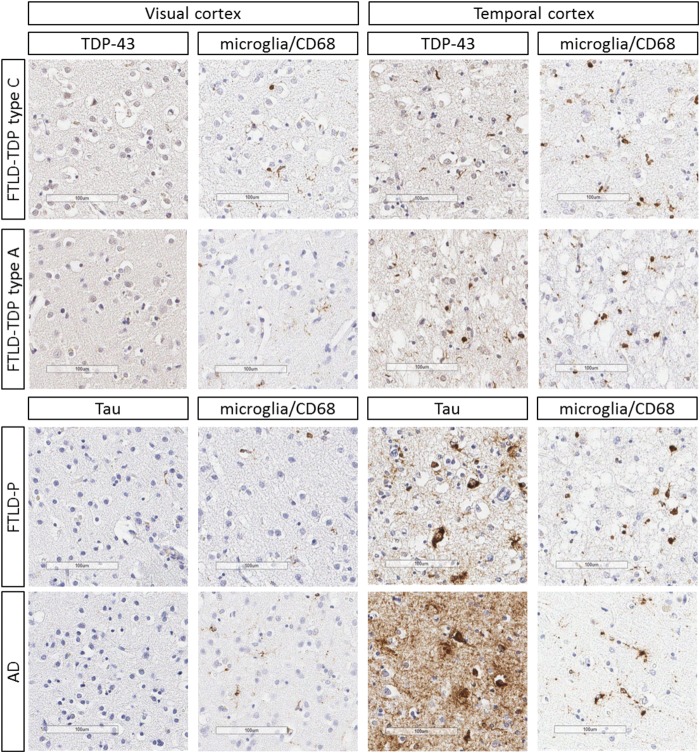
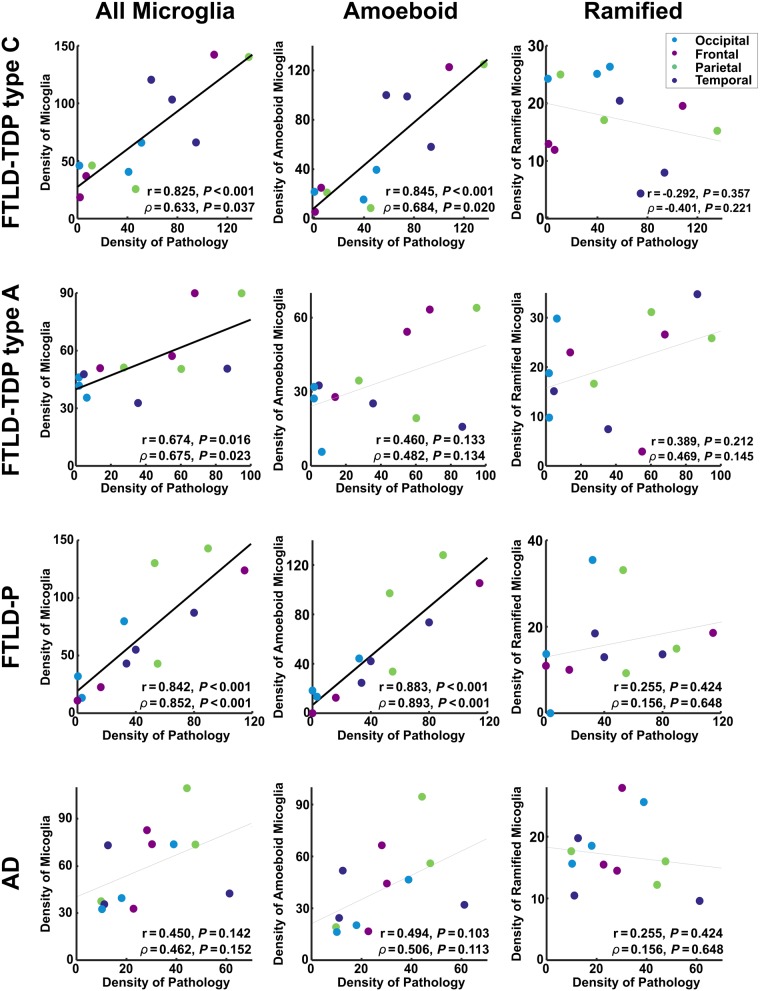
The clinical syndromes of frontotemporal dementia are clinically and neuropathologically heterogeneous, but processes such as neuroinflammation may be common across the disease spectrum. We investigated how neuroinflammation relates to the localization of tau and TDP-43 pathology, and to the heterogeneity of clinical disease. We used PET in vivo with (i) 11C-PK-11195, a marker of activated microglia and a proxy index of neuroinflammation; and (ii) 18F-AV-1451, a radioligand with increased binding to pathologically affected regions in tauopathies and TDP-43-related disease, and which is used as a surrogate marker of non-amyloid-β protein aggregation. We assessed 31 patients with frontotemporal dementia (10 with behavioural variant, 11 with the semantic variant and 10 with the non-fluent variant), 28 of whom underwent both 18F-AV-1451 and 11C-PK-11195 PET, and matched control subjects (14 for 18F-AV-1451 and 15 for 11C-PK-11195). We used a univariate region of interest analysis, a paired correlation analysis of the regional relationship between binding distributions of the two ligands, a principal component analysis of the spatial distributions of binding, and a multivariate analysis of the distribution of binding that explicitly controls for individual differences in ligand affinity for TDP-43 and different tau isoforms. We found significant group-wise differences in 11C-PK-11195 binding between each patient group and controls in frontotemporal regions, in both a regions-of-interest analysis and in the comparison of principal spatial components of binding. 18F-AV-1451 binding was increased in semantic variant primary progressive aphasia compared to controls in the temporal regions, and both semantic variant primary progressive aphasia and behavioural variant frontotemporal dementia differed from controls in the expression of principal spatial components of binding, across temporal and frontotemporal cortex, respectively. There was a strong positive correlation between 11C-PK-11195 and 18F-AV-1451 uptake in all disease groups, across widespread cortical regions. We confirmed this association with post-mortem quantification in 12 brains, demonstrating strong associations between the regional densities of microglia and neuropathology in FTLD-TDP (A), FTLD-TDP (C), and FTLD-Pick's. This was driven by amoeboid (activated) microglia, with no change in the density of ramified (sessile) microglia. The multivariate distribution of 11C-PK-11195 binding related better to clinical heterogeneity than did 18F-AV-1451: distinct spatial modes of neuroinflammation were associated with different frontotemporal dementia syndromes and supported accurate classification of participants. These in vivo findings indicate a close association between neuroinflammation and protein aggregation in frontotemporal dementia. The inflammatory component may be important in shaping the clinical and neuropathological patterns of the diverse clinical syndromes of frontotemporal dementia.

Keywords: microglia; neuropathology; primary progressive aphasia; semantic dementia; tau imaging.


Figures

Figure 1
Figure 1
Regional ligand binding by group. Unthresholded regional t-scores for each disease group compared to the control group for 11C-PK-11195 BPND on the left and 18F-AV-1451 BPND on the right.
Figure 2
Figure 2
Scatter plot of the regional mean BPND for 11C-PK-11195 against regional mean BPND of 18F-AV-1451 by disease group. For each disease group raw values are demonstrated on the left with values adjusted for non-specific signal strength through subtraction of the regional control mean shown on the right.
Figure 3
Figure 3
First four principal components for 11C-PK-11195 and 18F-AV-1451. 18F-AV-1451 component 5 was also retained by Cattell’s criterion but was not strongly weighted to any region and did not discriminate groups so is omitted here for parsimony. The bottom row shows, for each principal component (PC), the difference between each patient group and controls, adjusted for age and sex in the repeated measures ANOVA. Error bars span ± 1 SEM (standard error of the mean for the patient group). Significance in post hoc tests: ***P <0.001, **P <0.01, *P <0.05.
Figure 4
Figure 4
Pairwise classification accuracy for each ligand. 11C-PK-11195 (left), 18F-AV-1451 (middle), and using combined data (right). The graphs represent a 2D projection of the between-individual PET signal distribution dissimilarity calculated according to the squared metric stress criterion. A 10-fold cross-validated support vector machine was applied to each plot, and the classification accuracy compared to a null distribution of 1000 randomizations for non-parametric significant testing. For each comparison, percentage classification and P-value is stated. In simple terms, this means that the similarity of the distribution of ligand binding across the brain for each individual was assessed irrespective of the absolute magnitude of binding (and therefore not determined by differences in ligand affinity for different pathological subtypes). Note how in the top left plot (nfvPPA versus svPPA for 11C-PK-11195) two groups of patients are clearly separated. By contrast, in the second column third row (bvFTD versus nfvPPA for 18F-AV-1451) the points are intermingled, with only chance-level classification.
Figure 5
Figure 5
Immunohistochemistry from cases with FTLD-TDP43 types A and C, FTLD-P (Pick’s disease), and Alzheimer’s disease (AD) at Braak stage V. Areas of low (visual cortex BA17/18) and high (temporal cortex, BA21/22) disease burden are shown. Scale bars = 100 µm. Representative micrographs from the same location on adjacent sections stained for the relevant protein aggregate (phosphorylated-tau or TDP43) and CD68 (expressed by microglia), respectively.
Figure 6
Figure 6
The relationship between protein aggregation and microglia in each post-mortem sample. Densities are quantified as the number of microglia or pathological inclusions per square millimetre. Each point represents a single brain region in a single individual. The Pearson correlation (r), and the partial correlation (ρ) after factoring out the density of cell nuclei are shown for each relationship, along with the corresponding P-value. Trend lines are emboldened when both correlation and partial correlation were significant at α < 0.05.

References

    1. Baker SL, Harrison TM, Maaß A, La Joie R, Jagust W.. Effect of off-target binding on 18F-Flortaucipir variability in healthy controls across the lifespan. J Nucl Med 2019. - PMC - PubMed
    1. Banati RB. Visualising microglial activation in vivo. Glia 2002; 206–17. - PubMed
    1. Ben Haim Carrillo-de Sauvage BL, Ceyzériat M-A, Escartin K.. C. Elusive roles for reactive astrocytes in neurodegenerative diseases. Front Cell Neurosci 2015; 9: 1–27. - PMC - PubMed
    1. Bevan-Jones RW, Cope TE, Jones SP, Passamonti L, Hong YT, Fryer T, et al.[18F]AV-1451 binding is increased in frontotemporal dementia due to C9orf72 expansion. Ann Clin Transl Neurol 2018b; 5: 1292–6. - PMC - PubMed
    1. Bevan-Jones WR, Cope TE, Jones PS, Passamonti L, Hong YT, Fryer T, et al.In vivo evidence for pre-symptomatic neuroinflammation in a MAPT mutation carrier. Ann Clin Transl Neurol 2019; 6: 373–8. - PMC - PubMed

Publication types