. 2020 Oct;52(5):2071-2084.
doi: 10.3758/s13428-020-01376-6.

The ASL-CDI 2.0: An updated, normed adaptation of the MacArthur Bates Communicative Development Inventory for American Sign Language

Affiliations

The ASL-CDI 2.0: An updated, normed adaptation of the MacArthur Bates Communicative Development Inventory for American Sign Language

Naomi K Caselli et al. Behav Res Methods. 2020 Oct.

Abstract

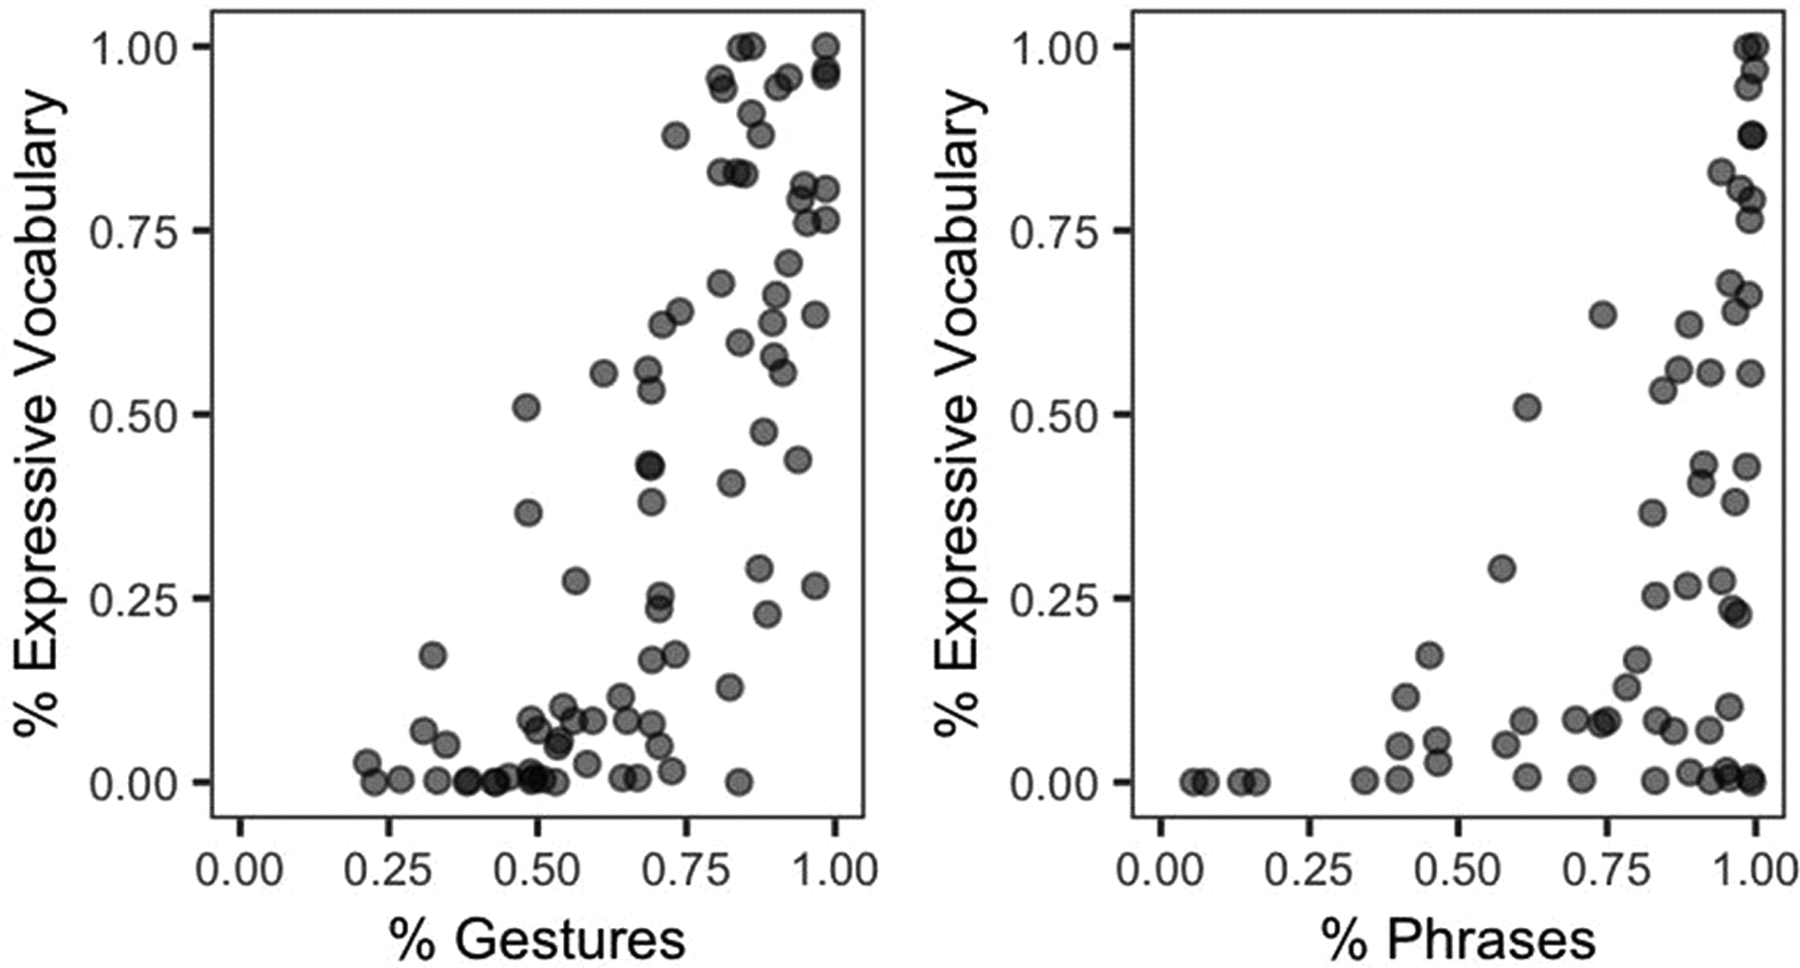
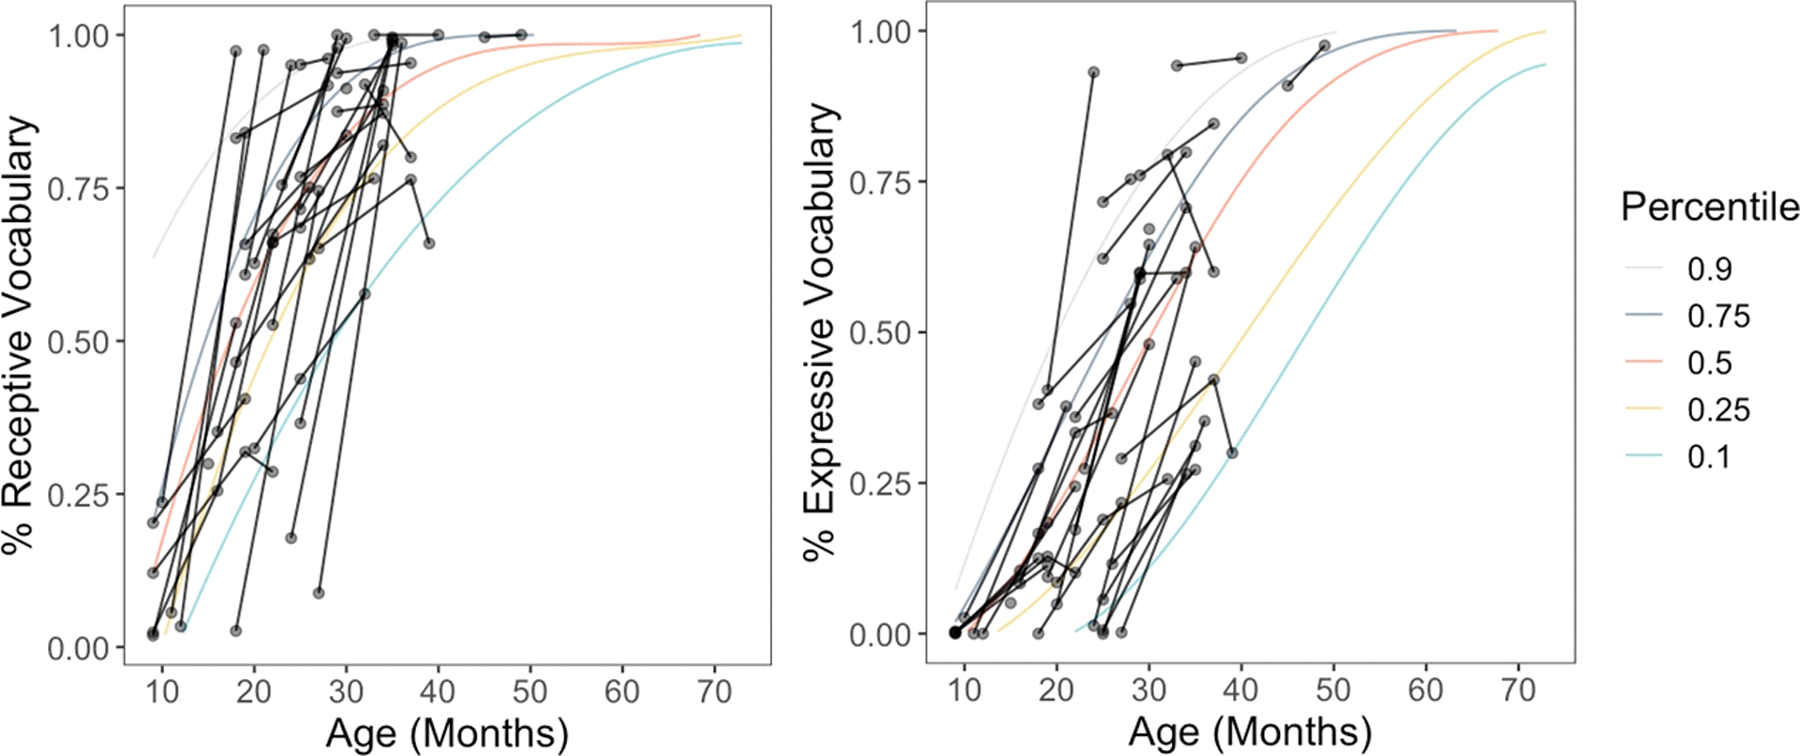
Vocabulary is a critical early marker of language development. The MacArthur Bates Communicative Development Inventory has been adapted to dozens of languages, and provides a bird's-eye view of children's early vocabularies which can be informative for both research and clinical purposes. We present an update to the American Sign Language Communicative Development Inventory (the ASL-CDI 2.0, https://www.aslcdi.org ), a normed assessment of early ASL vocabulary that can be widely administered online by individuals with no formal training in sign language linguistics. The ASL-CDI 2.0 includes receptive and expressive vocabulary, and a Gestures and Phrases section; it also introduces an online interface that presents ASL signs as videos. We validated the ASL-CDI 2.0 with expressive and receptive in-person tasks administered to a subset of participants. The norming sample presented here consists of 120 deaf children (ages 9 to 73 months) with deaf parents. We present an analysis of the measurement properties of the ASL-CDI 2.0. Vocabulary increases with age, as expected. We see an early noun bias that shifts with age, and a lag between receptive and expressive vocabulary. We present these findings with indications for how the ASL-CDI 2.0 may be used in a range of clinical and research settings.

Keywords: language deprivation; sign language; vocabulary acquisition.


Figures

Figure 1.
Figure 1.
Distribution of ages in the normative sample.
Figure 2.
Figure 2.
Sample item on the picture-matching task (left) and picture-naming task (right). The same illustrations were used in the picture-naming task. In this case, the target for the picture-matching question was TREE, and for the picture-naming question was BIRD
Figure 3.
Figure 3.
The proportion of signs on the in-person test that the parent accurately reported on the ASL-CDI 2.0.
Figure 4.
Figure 4.
The relationship between expressive vocabulary size (proportion of signs the child can produce) and the proportion gestures they produce (left) and phrases they understand (right). The gestures reflect an average of all five sections on the gestures form.
Figure 5.
Figure 5.
The relationship between the proportion of signs children were reported as knowing and their ages. Lines indicate the 10th, 25th, 50th, 75th, and 90th percentiles, and were generated using the gcrq function in the package quantregGrowth. Individual dots represent a single ASL-CDI 2.0 report (longitudinal data are reported here).These graphs are based on a different set of calculations than the reference levels, and are not intended to be used to classify children’s vocabularies as within/above/below the normal range.
Figure 6.
Figure 6.
The relationship between the proportion of signs children were reported as knowing and their ages over time. The colored lines are the same as those in Figure 5, and indicate the 10th, 25th, 50th, 75th, and 90th percentiles. Each yellow dot represents a single ASL-CDI 2.0 report, and the black lines connect the reports corresponding to a single child to illustrate the child’s growth in vocabulary over time.
Figure 7.
Figure 7.
The relationship between the proportion of gestures and phrases children were reported as knowing to their ages. Lines indicate the 10th, 25th, 50th, 75th, and 90th percentiles, and were generated using the gcrq function in the package quantregGrowth. Individual dots represent individual children. These graphs are based on a different set of calculations than the reference levels, and are not intended to be used to classify children’s performance as within/above/below the normal range.
Figure 8.
Figure 8.
The proportion of all the signs on the ASL-CDI 2.0 in a child’s expressive vocabulary relative to the proportion of signs of a particular semantic category in a child’s expressive vocabulary. Black diagonal lines indicates the expected relationship if there were no bias for or against that category. Yellow lines that fall above the black line indicate that this category is overrepresented in children’s vocabularies, and Yellow lines that fall below the black line indicate that this category is underrepresented in children’s vocabularies. Individual dots represent individual children. Plots and analysis technique were modeled after Frank et al. (2019).
Figure 9.
Figure 9.
The proportion of all the signs on the ASL-CDI in a child’s expressive vocabulary relative to the proportion of signs of a particular syntactic category in a child’s expressive vocabulary. Black diagonal line indicates the expected relationship if there were no bias for that category. The plot on the left is the data from the current study, and the plot on the right is the ASL-CDI 1.0 from Anderson & Reilly, (2002) as reported by Caselli and Pyers (2017). The patterns in the two datasets are the same. The yellow lines fall slightly above the black lines, indicating that nouns are slightly overrepresented in children who have small vocabularies. The red lines fall slightly below the black lines, indicating that verbs are slightly underrepresented in children who have small vocabularies. The blue lines fall below the black lines, indicating that function words are underrepresented in children’s vocabularies. Plots and analysis technique were modeled after Frank et al., (2019).
Figure 10.
Figure 10.
The relationship between scores on the entire set of items on the ASL-CDI 2.0 and a randomly sampled subset of 10, 30, 100, and 500 words for both receptive and expressive vocabulary

Similar articles

Cited by

References

    1. Anderson D, & Reilly J (2002). The MacArthur communicative development inventory: normative data for American Sign Language. Journal Of Deaf Studies And Deaf Education, 7(2), 83–106. - PubMed
    1. Bates E, Marchman V, Thal D, Fenson L, Dale P, Reznick JS, … & Hartung J (1994). Developmental and stylistic variation in the composition of early vocabulary. Journal Of Child Language, 21(1), 85–123. - PubMed
    1. Bornstein MH, Cote LR, Maital S, Painter K, Park SY, Pascual L, … & Vyt A (2004). Cross-linguistic analysis of vocabulary in young children: Spanish, Dutch, French, Hebrew, Italian, Korean, and American English. Child Development, 75(4), 1115–1139. - PubMed
    1. Bottoms A, Fieldsteel Z, Spurgeon E, & Lieberman A (2017, Nov.). Object and event labelling in American Sign Language input to young deaf children. Poster presented at the 42nd Boston University Conference on Language Development, Boston, MA.
    1. Caselli NK, Sehyr ZS, Cohen-Goldberg AM, & Emmorey K (2017). ASL-LEX: A lexical database of American Sign Language. Behavior Research Methods, 49(2), 784–801. - PMC - PubMed

Publication types

LinkOut - more resources