. 2020 Feb 28:11:88.
doi: 10.3389/fphar.2020.00088. eCollection 2020.

Compound C Reducing Interferon Expression by Inhibiting cGAMP Accumulation

Affiliations

Compound C Reducing Interferon Expression by Inhibiting cGAMP Accumulation

Junzhong Lai et al. Front Pharmacol. .

Abstract

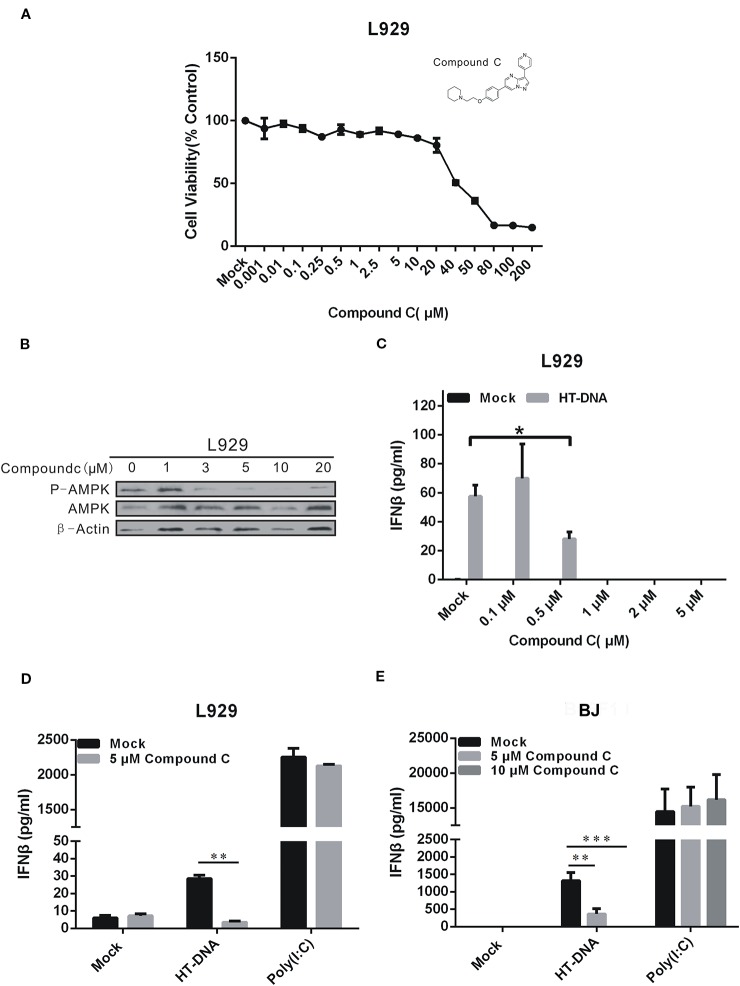
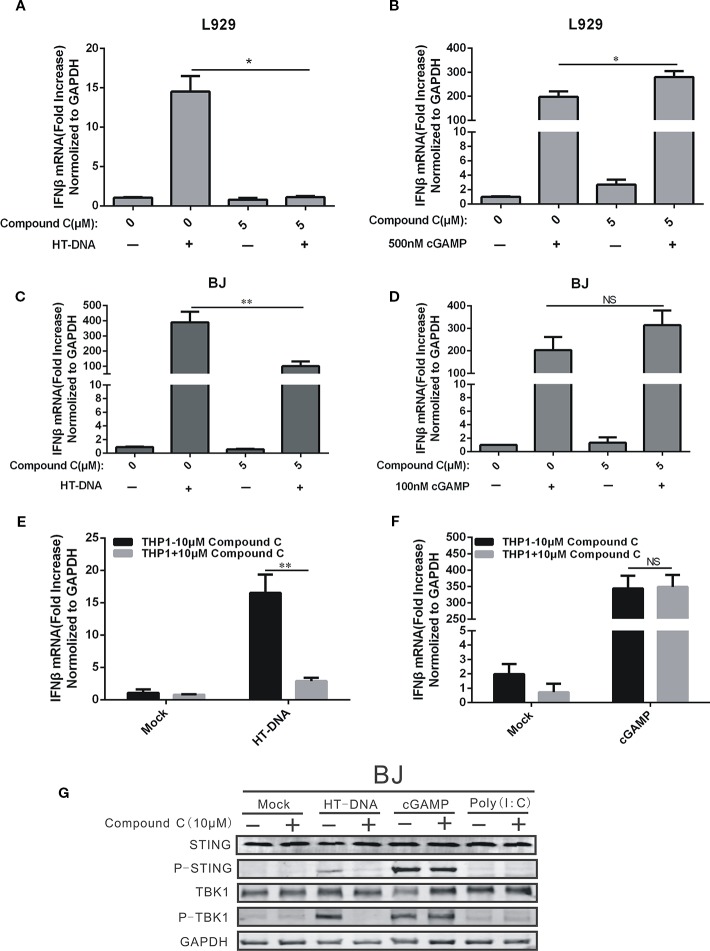
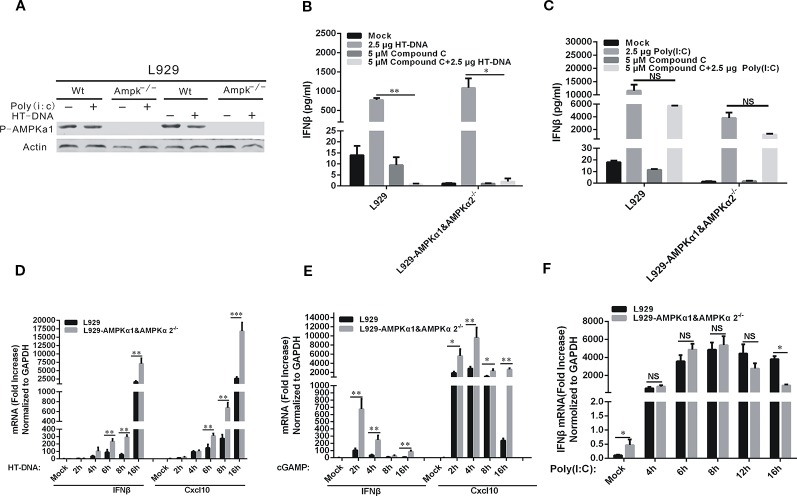
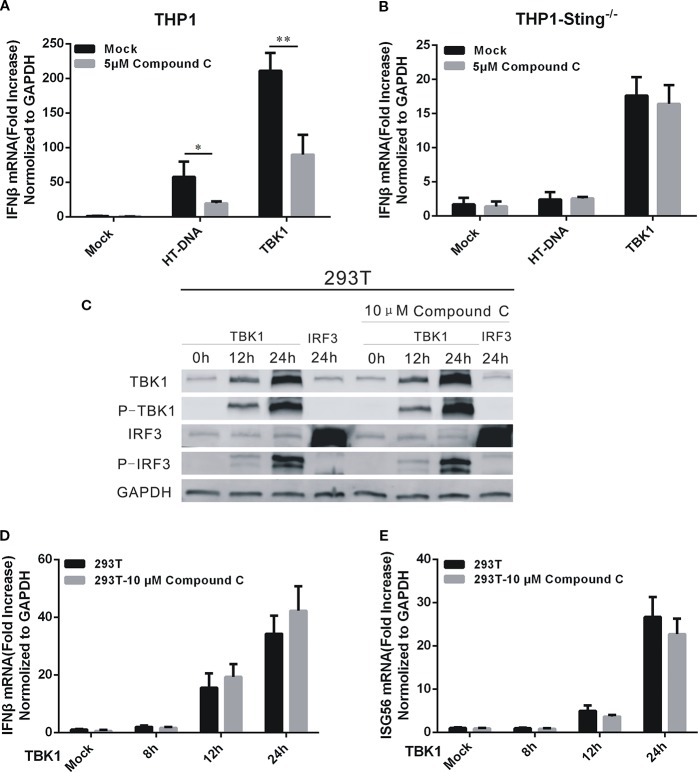
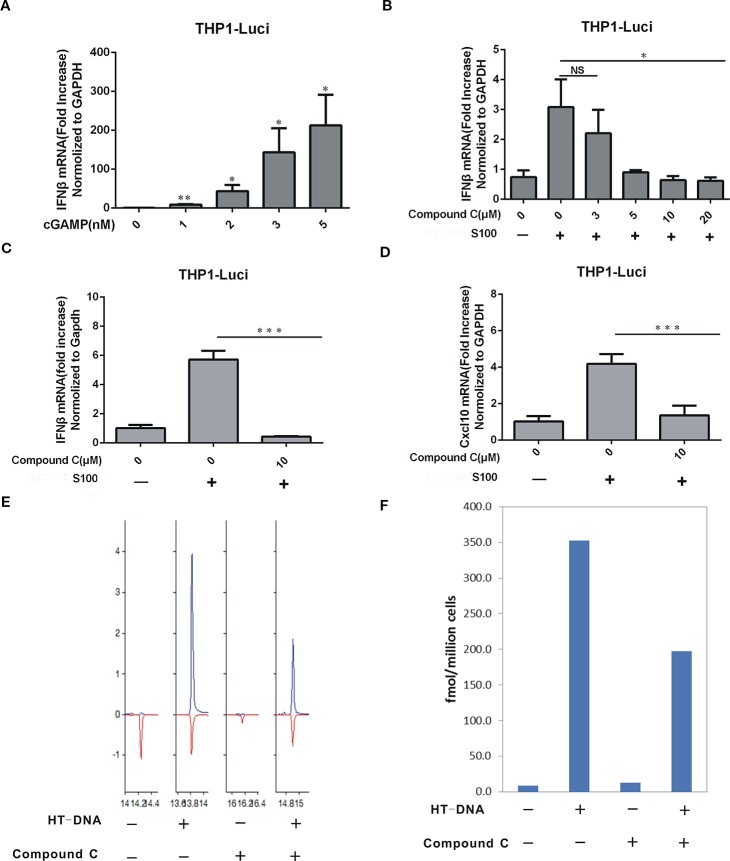
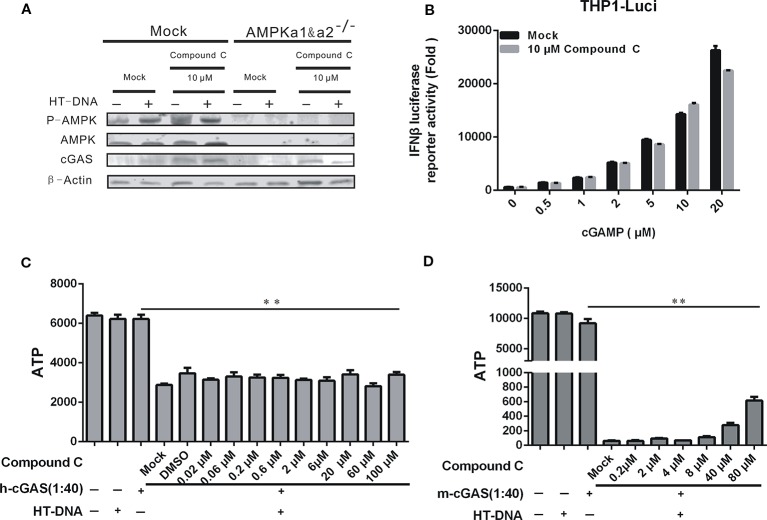
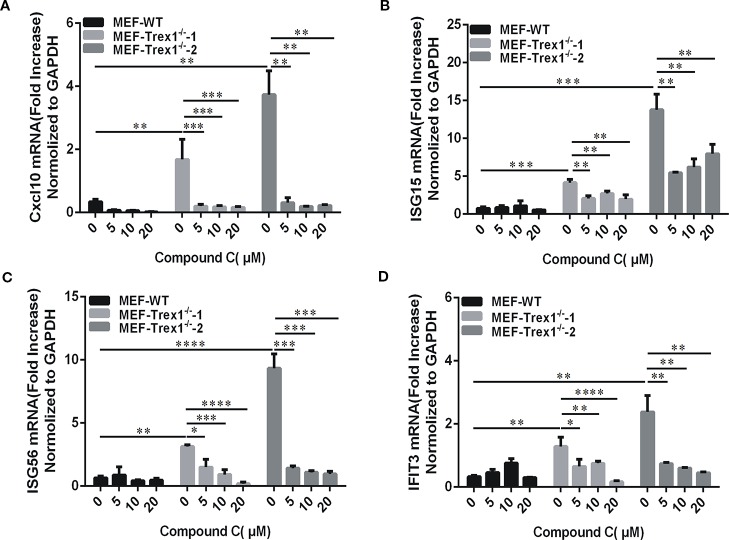
Cyclic GMP-AMP (cGAMP) synthase (cGAS) is a major DNA sensor responsible for cytosolic DNA-mediated innate immune response. Inhibition of cGAS may be an effective strategy for treating autoimmune diseases such as Aicardi-Goutieres syndrome and systemic lupus erythematosus. Compound C (also known as Dorsomorphin) has been annotated as a potent and reversible inhibitor for AMPKs as well as ALK protein kinases. Here, we report a new function of Compound C which can suppress dsDNA-dependent type I interferon induction. These effects were not dependent on the activities of AMPK proteins. In vitro assays and liquid chromatograph-mass spectrometry data show that Compound C has the capability of reducing cGAMP accumulation, suggesting that Compound C may function as a modulator involved in the cGAS-STING-mediated DNA sensing pathway. Furthermore, Compound C is able to rescue the autoimmune phenotypes in a mouse model carrying the Trex1 gene deficiency. These data demonstrate a new and inverse correlation between Compound C and type I interferon production in response to dsDNA signaling.

Keywords: DNA sensing; cGAMP; cGAS; compound C; dorsomorphin; type I interferon.


Figures

Figure 1
Figure 1
Compound C inhibited type I IFN production in dsDNA signaling. (A) L929 cells were treated with the different doses of Compound C for 24 h, and subjected to the CCK-8 assay. (B) Compound C inhibited the AMP-activated protein kinase (AMPK) activity as tested by Western blotting. (C) Enzyme-Linked Immunosorbent Assay (ELISA) analyses of IFNβ expression in L929 cells. The cells were transfected with HT-DNA after treated with the different doses of Compound C for 1 h. (D, E) ELISA analyses of IFNβ expression in L929 and BJ cells. The cells were transfected with HT-DNA and poly (I:C) after treated with indicate doses of Compound C. The experiments were performed at least three times. The statistical analyses were performed by Student’s-t test and the data are presented as mean ± SD (n = 3, * P < 0.05, **P < 0.01,***P < 0.001).
Figure 2
Figure 2
Compound C suppressed the expression of IFNβ by transfected dsDNA, but not cGAMP. (A, C, E) RT-qPCR analyses of IFNβ expression in L929 (A), BJ (C), THP1 (E) cells. The cells were transfected with HT-DNA after treated with indicated doses of Compound C. (B, D, F) RT-qPCR analyses of IFNβ expression in L929 (B), BJ (D), THP1 (F) cells. The cells were transfected with poly (I:C) after treated with indicated doses of Compound C for 1 h. (G) Western blot analyses of STING, P-STING, TBK1, P-TBK1, and GAPDH expression in BJ cells. The cell was transfected with HT-DNA, cGAMP and poly (I:C) after treated with indicate doses of Compound C. The experiments were performed at least three times. Data in bar graphs are presented as mean ± SD (n = 3−5) with asterisks indicating significant changes (NS Nonsignificance, *P < 0.05, **P < 0.01).
Figure 3
Figure 3
Compound C inhibited the dsDNA-dependent pathway which was not dependent on the activity of AMP-activated protein kinases (AMPKs). (A) Western blot analyses of phorsphorylated AMPK in L929 wild-type and L929-AMPK-/- cells. The cells were transfected with HT-DNA and poly (I:C). (B, C) RT-qPCR analyses of IFNβ expression in L929 and L929-AMPK-/- cells. The cells were transfected with HT-DNA (B) or poly (I:C) (C) after treated with indicated dose of Compound C. (D–F) RT-qPCR analyses of IFNβ and CXCL10 expression in L929 wild-type and L929-AMPK-/- cells. The cells were transfected HT-DNA (D), cGAMP (E); Analyses of IFNβ expression in L929 wild-type and L929-AMPK-/- cells. The cells were transfected with poly (I:C) (F). The experiments were performed at least three times. Data in bar graphs are presented as mean ± SD (n = 5) with asterisks indicating significant changes between the indicated bars (NS, Nonsignificance, * P < 0.05, **P < 0.01,***P < 0.001).
Figure 4
Figure 4
The target of Compound C was in the upstream of TBK1. (A, B) RT-qPCR analyses of IFNβ expression levels in THP1 wild-type (A) and THP1-STING-/- (B) cells. The cells were transfected with HT-DNA and pcDNA 3.1-TBK1-Flag after treated with indicated dose of Compound C. (C) Western blot analyses of TBK1, p-TBK1, IRF3, and p-IRF3 expression in 293T cells. The 293T cells were treated with 10 μM Compound C followed by transfection with pcDNA3.1-TBK1-Flag and pcDNA3.1-IRF3-Flag. (D, E) RT-qPCR analyses of IFNβ (D) and ISG56 (E) expression in 293T cells. The 293T cells were treated with 10 μM Compound C followed by transfection with pcDNA3.1-TBK1-Flag for 12 h and 24 h, respectively. The experiments were performed at least three times. The statistical analyses were performed by Student’s-t test and the data are presented as mean ± SD (n = 3) with asterisks indicating significant changes (* P < 0.05, **P < 0.01).
Figure 5
Figure 5
Compound C lowered the cGAMP level. (A) RT-qPCR analyses of IFNβ induction in THP1-ISG-liciferase cells. The cells were treated with the increasing amounts of cGAMP. (B) RT-qPCR analyses of IFNβ induction in THP1-ISG-liciferase cells. The cells were treated with the S100 fractions which were extracted from the BJ cells transfected with HT-DNA after treated with indicated doses of Compound C for 1h. (C, D) RT-qPCR analyses of IFNβ (C), CXCL10 (D) expression in THP1-ISG-liciferase cells treated with the S100 fractions which were extracted from the BJ cells transfected with HT-DNA after treated with indicated doses of Compound C for 1h. (E, F) LC-MS analyses of the content of cGAMP in the S100 fractions which were extracted from the BJ cells transfected with HT-DNA after treated with 10 μM Compound C. The experiments were performed at least three times. Data in bar graphs are presented as mean ± SD (n = 3−5) with asterisks indicating significant changes (NS, Nonsignnificant, * P < 0.05, **P < 0.01,***P < 0.001).
Figure 6
Figure 6
The inhibitory effect of Compound C on cGAS-STING signaling was not dependent on the cGAS enzymatic activity. (A) Western blot analyses of p-AMPK, AMPK, and cGAS expression in L929 wild-type and L929-AMPK-/- cells. The cells were transfected with HT-DNA and poly (I:C) after treated with indicated doses of Compound C. (B) Enzyme-Linked Immunosorbent Assay (ELISA) analyses of IFNβ expression in THP1-Luci cells following stimulation by cGAMP at the different concentrations for 16 h with or without 5 μM Compound C treatments. (C, D) The cGAS enzyme activity was evaluated by the (ATP consumption. The experiments were performed at least three times. Data in bar graphs are presented as mean ± SD (n = 3−5) with asterisks indicating significant changes (**P < 0.01).
Figure 7
Figure 7
Compound C is active in cells loss of Trex1 gene. (A–D) RT-qPCR analyses of CXCL10 (A), ISG15 (B), ISG56(C), and IFIT3 (D) expression in mouse embryonic fibroblast (MEF) wild-type and MEF-Trex1-/- cells. The cells were treated with indicated doses of Compound C for 3 h. The experiments were performed at least three times. Data in bar graphs are presented as mean ± SD (n = 3) with asterisks indicating significant changes (*P < 0.05, **P < 0.01, ***P < 0.001, ****P < 0.0001).

References

    1. Abe T., Barber G. N. (2014). Cytosolic-DNA-mediated, STING-dependent proinflammatory gene induction necessitates canonical NF-κB activation through TBK1. J. Virol. 88 (10), 5328–5341. 10.1128/JVL00037-14 - DOI - PMC - PubMed
    1. Abe T., Harashima A., Xia T., Konno H., Konno K., Morales A., et al. (2013). STING recognition of cytoplasmic DNA instigates cellular defense. Mol. Cell 50 (1), 5. 10.1016/j.molcel.2013.01.039 - DOI - PMC - PubMed
    1. Ablasser A., Goldeck M., Cavlar T., Deimling T., Witte G., Röhl I., et al. (2013). cGAS produces a 2 [prime]-5 [prime]-linked cyclic dinucleotide second messenger that activates STING. Nature 498 (7454), 380–384. 10.1038/nature12306 - DOI - PMC - PubMed
    1. Ablasser A., Hemmerling I., Schmid-Burgk J. L., Behrendt R., Roers A., Hornung V. (2014). TREX1 deficiency triggers cell-autonomous immunity in a cGAS-dependent manner. J. Immunol. 192 (12), 5993–5997. 10.4049/jimmunol.1400737 - DOI - PubMed
    1. Ahn J., Gutman D., Saijo S., Barber G. N. (2012). STING manifests self DNA-dependent inflammatory disease. Proc. Natl. Acad. Sci. 109 (47), 19386–19391. 10.1073/pnas.1215006109 - DOI - PMC - PubMed