. 2020 Mar 3;11(9):828-845.
doi: 10.18632/oncotarget.27492.

Glypican-1 in human glioblastoma: implications in tumorigenesis and chemotherapy

Affiliations

Glypican-1 in human glioblastoma: implications in tumorigenesis and chemotherapy

Eduardo Listik et al. Oncotarget. .

Abstract

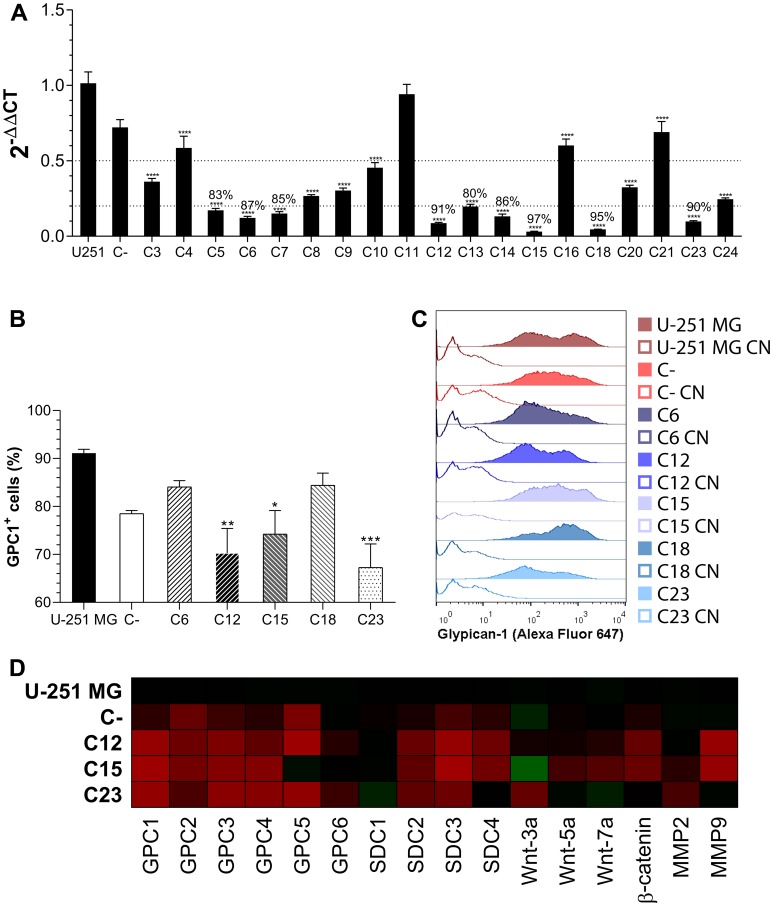
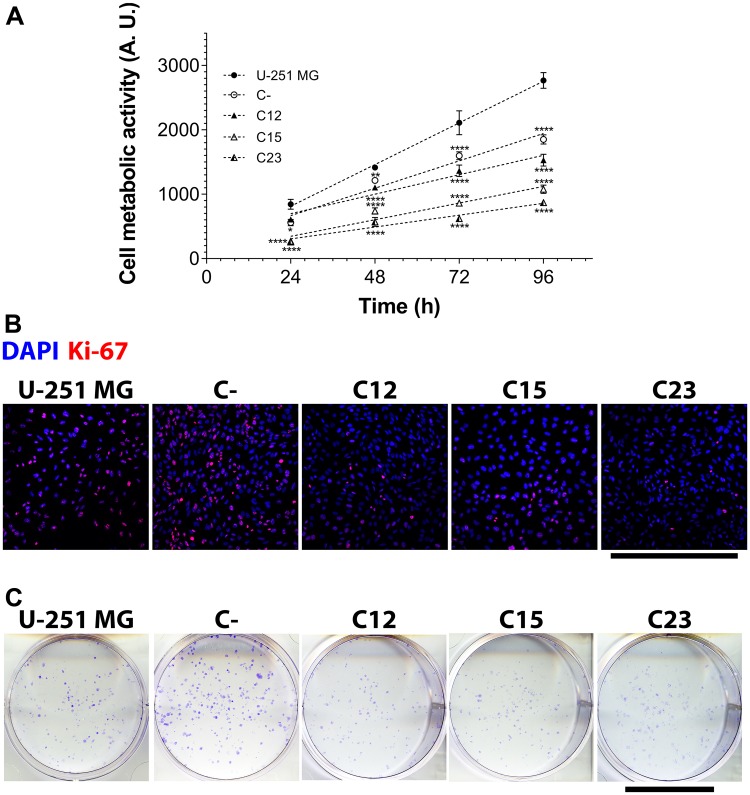
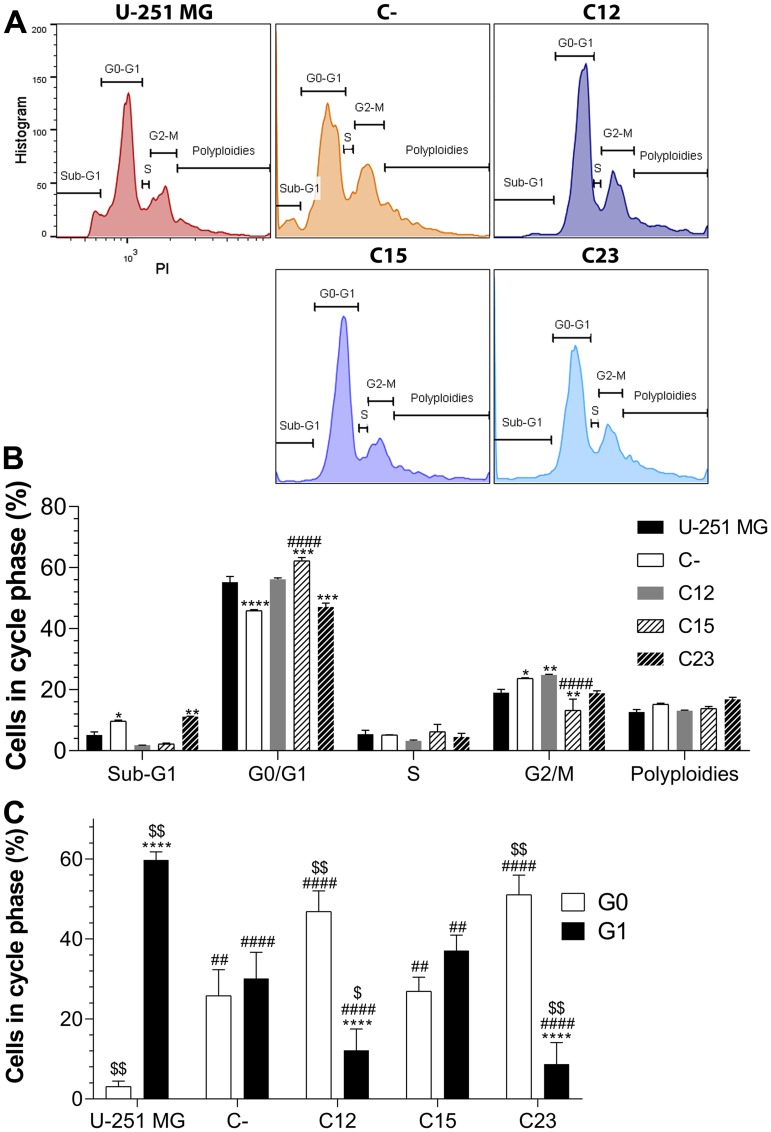
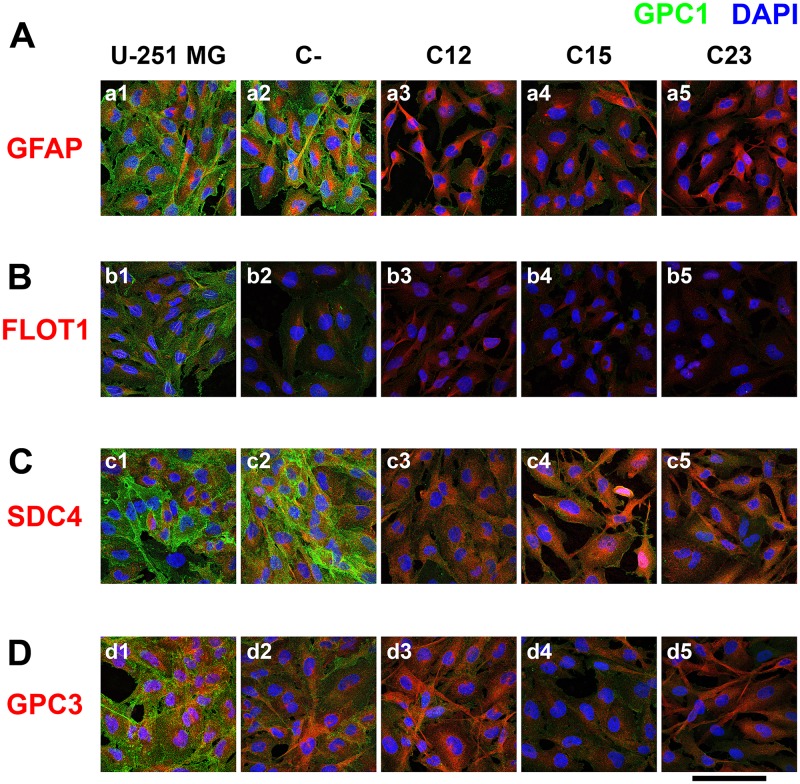
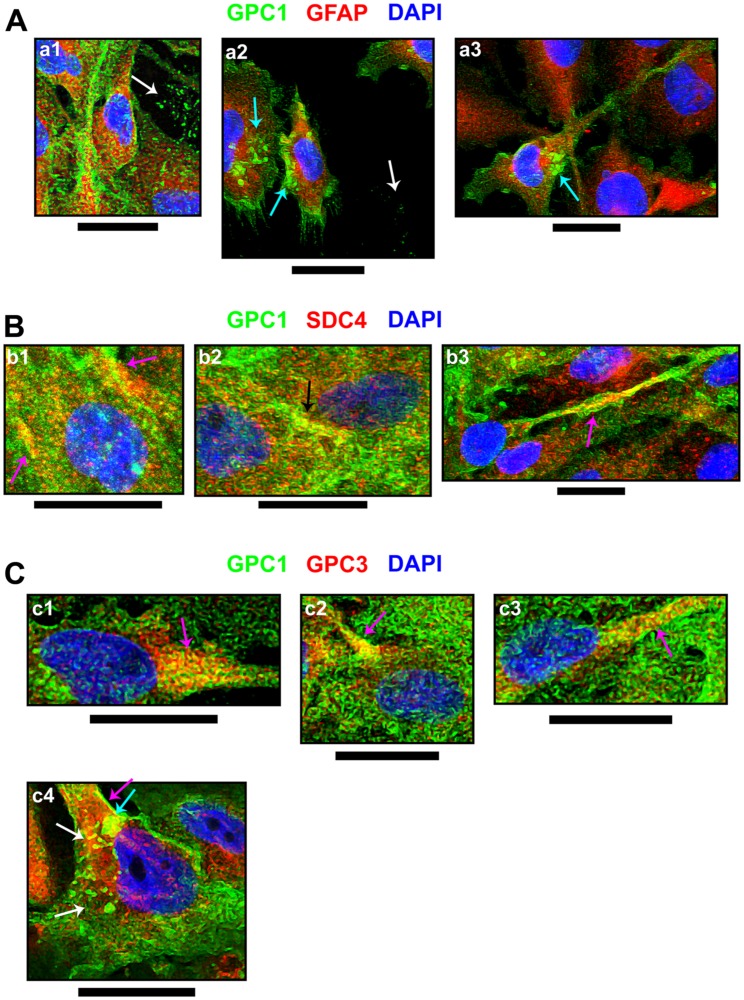
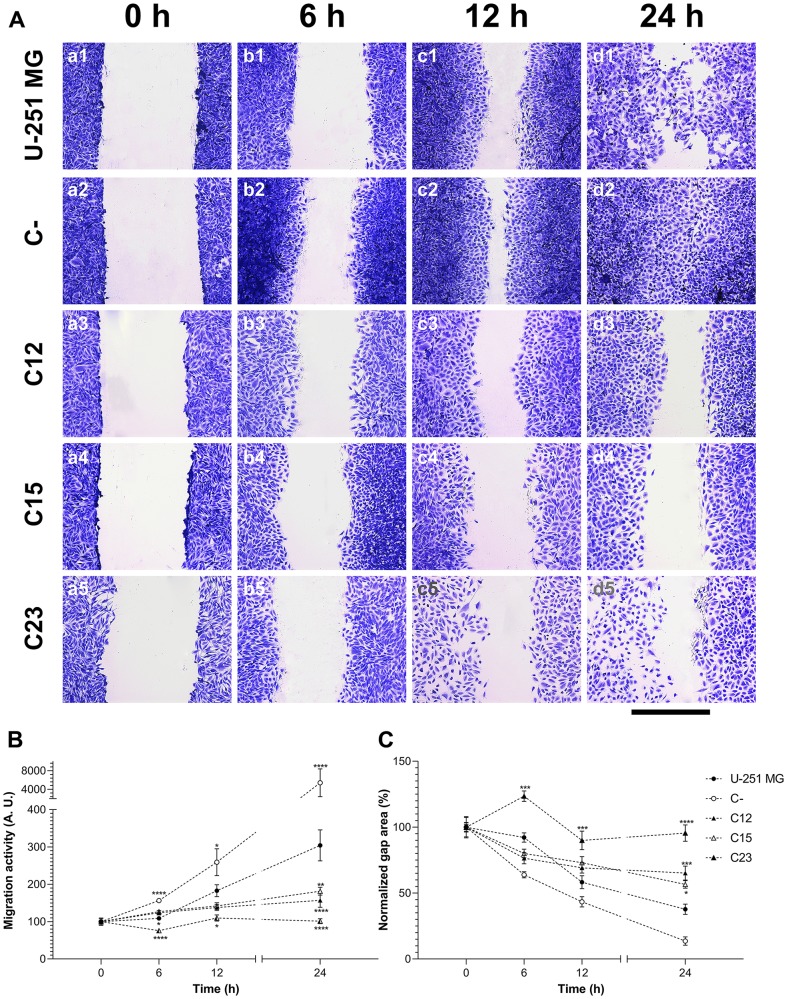
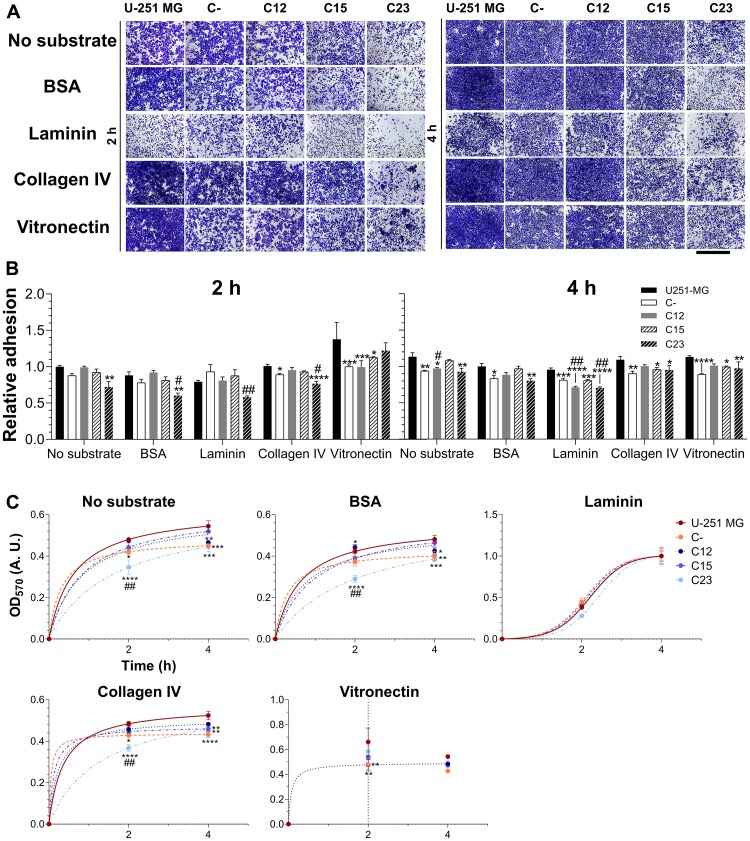
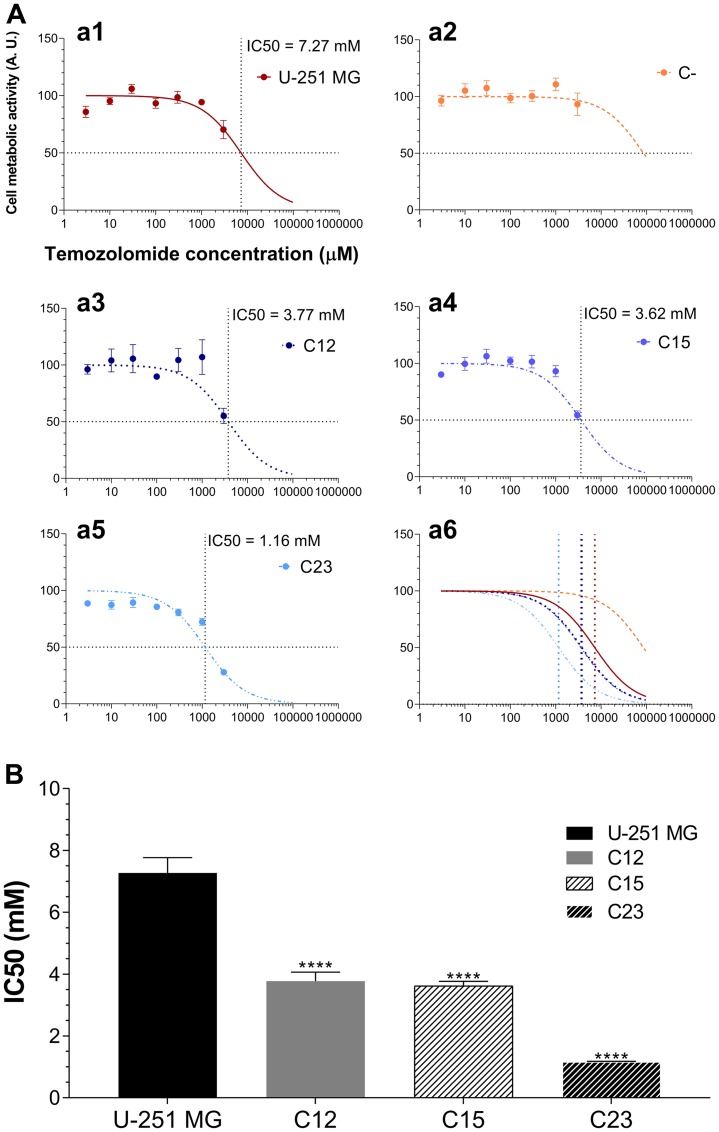
Glioblastoma is one of the most common malignant brain tumors, with which patients have a mean survival of 24 months. Glypican-1 has been previously shown to be overexpressed in human glioblastoma and to be negatively correlated with patient's survival. This study aimed to investigate how glypican-1 influences the tumoral profile of human glioblastoma using in vitro cell line models. By downregulating the expression of glypican-1 in U-251 MG cells, we observed that the cellular growth and proliferation were highly reduced, in which cells were significantly shifted towards G0 as opposed to G1 phases. Cellular migration was severely affected, and glypican-1 majorly impacted the affinity towards laminin-binding of glioblastoma U-251 MG cells. This proteoglycan was highly prevalent in glioblastoma cells, being primarily localized in the cellular membrane and extracellular vesicles, occasionally with glypican-3. Glypican-1 could also be found in cell-cell junctions with syndecan-4 but was not identified in lipid rafts in this study. Glypican-1-silenced cells were much more susceptible to temozolomide than in U-251 MG itself. Therefore, we present evidence not only to support facts that glypican-1 is an elementary macromolecule in glioblastoma tumoral microenvironment but also to introduce this proteoglycan as a promising therapeutic target for this lethal tumor.

Keywords: chemotherapy resistance; glioblastoma; glypican-1; temozolomide; tumorigenesis.


Conflict of interest statement

CONFLICTS OF INTEREST The authors report no competing interests.

Figures

Figure 1
Figure 1. GPC1 knock-down clone selection.
(A) All generated monoclonal cell lines had the GPC1 expression quantified by RT-qPCR. Dotted lines represent 50% and 80% of GPC1 silencing, respectively and, when more than 80% of gene silencing was achieved, the percentage reduction is indicated. (B) Flow cytometry assessment of GPC1 in control GBM cells and the five most GPC1-silenced clones. This representation shows the fraction of GPC1+ cells for each group. (C) Representative histograms of GPC1 fluorescence intensity distribution. Unstained samples are represented by unfilled curves (controls, CN). (D) Transcriptional profile of membrane-bound HSPG, selected Wnt ligands, and MMPs that were assessed by RT-qPCR. The heatmap of 2-ΔΔCt was generated, in which significant comparisons are not indicated but are commented on in the text. Gradients of red indicate diminished expression, and of green heightened expression in relation to U-251 MG. All data are plotted as mean ± SEM. The one-way ANOVA with the Dunnett’s post-hoc test was performed, and statistically significant comparisons are marked as follows: * p < 0.05, ** p < 0.01, *** p 0.001 and **** p < 0.0001 vs. U-251 MG. The sample size was n = 6 for RT-qPCR and n = 5 for flow cytometry.
Figure 2
Figure 2. Cell metabolic activity, proliferation, and clonogenicity assays to assess GPC1 effects in GBM cells.
The experiments were performed in U-251 MG, C- (both control cell lines) and C12, C15, and C23 GPC1 knocked-down cell lines. (A) The metabolic activity assay included reaction with MTT to obtain a growth curve by assessing cell metabolic activity at 24, 48, 72, and 96 h. Linear regression was done, and the obtained parameters are exhibited in Supplementary Table 1. Data are plotted as mean ± SEM, in which the sample size was n = 14. The two-way ANOVA with Dunnett’s post-hoc test was performed, and significant comparison are marked as follows: * p < 0.05; ** p < 0.01; and **** p < 0.0001 vs. U-251 MG. (B) Cells were immunolabeled with anti-Ki-67 antibody and additionally stained with DAPI for nuclear visualization to quantify proliferating cells (Ki-67+ cells). Images were obtained with a Leica TCS SP8 CARS confocal microscope. The scale bar refers to 500 µm. (C) To investigate whether the clonogenic potential was influenced by GPC1, 400 cells were plated in 6-well plates, incubated for eight mitotic cycles, and then stained with crystal violet. Only formations with more than 50 cells were considered colonies. The scale bar indicated 2 cm.
Figure 3
Figure 3. Cell cycle analysis to assess GPC1 influence on GBM.
The experiments were performed in GBM control cells (U-251 MG, C-) and GPC1-silenced GBM cells (C12, C15, and C23). (A) Cells were stained with propidium iodide (PI) and divided between sub-G1, G0/G1, S, G2/M and polyploidies groups. Representative histograms are shown for each cell line. (B) Distribution of cells in each group and cell phases. All data are plotted as mean ± SEM, and flow cytometry was conducted in duplicate. The two-way ANOVA with Dunnett’s post-hoc test was performed, and statistically significant data are marked as follows: * p < 0.05, ** p < 0.01, *** p < 0.001, **** p < 0.0001 vs. U-251 MG; and #### p < 0.0001 vs. C-. (C) The fraction of cells in G0 and G1 phases when considering proliferation data. The sample size was n = 14. The two-way ANOVA with Bonferroni or Dunnett’s post-hoc test was done, and statistically significant comparisons are coded as follows: **** p < 0.0001 vs. G0/G1; ## p < 0.01, #### p < 0.0001 vs. U-251 MG respective phase; and $ p < 0.05, $$ p < 0.01 vs. C- respective phase.
Figure 4
Figure 4. Confocal microscopy of immunolabeled GBM control and GPC1-silenced cells for a lipid raft marker or correlated HSPGs.
U-251 MG (1), C- (2), as controls cells, and C12 (3), C15, (4) and C23 (5) GPC1-depleted cells were immunolabeled for GPC1, in green, and different other antigens, in red, such as (A) GFAP, (B) FLOT1, (C) SDC4, and (D) GPC3. The cells’ nuclei were stained with DAPI, shown in blue. The images were obtained with a Leica TCS SP8 CARS confocal microscope. The scale bar refers to 100 µm.
Figure 5
Figure 5. Cellular events indicating GPC1 and its association with SDC4 or GPC3.
From immunofluorescence assays, through confocal microscopy, special events including (A) GPC1 and its co-localization with (B) SDC4 or (C) GPC3, both in red, were imaged. GPC1 is always represented in green, and DAPI staining for cells’ nuclei is in blue. Images were obtained from U-251 MG cells (b2, b3 and c1-c4) or C- (a1-a3 and b1) as there was evident GPC1 expression in these cell lines. Arrows have the following color code: detection in extracellular vesicles (white); extracellular vesicles’ interaction with the cellular membrane (cyan); co-localization in the cell membrane (magenta); co-localization in cell-cell junctions (black). The images were obtained with a Leica TCS SP8 CARS confocal microscope. All scale bars refer to 25 µm.
Figure 6
Figure 6. Migration assessment on GBM cells to establish the effects of GPC1.
(A) U-251 MG (1), C- (2), C12 (3), C15 (4), and C23 (5) cells were submitted to the wound-healing assay to analyze migration patterns of GPC1-silenced cells (C12, C15, and C23). Cells were incubated with 10 µg/ml of mitomycin and stained with crystal violet at 0, 6, 12, and 24 h, after which images were captured. The scale bar refers to 400 µm. (B) Migration function and (C) normalized gap area were plotted for each cell line, in which the migration function is calculated from the inverse raw gap area. All data are shown as mean ± SEM and were analyzed with the two-way ANOVA with Dunnett’s post hoc test. Statistically significant comparisons are marked as follows: * p < 0.05, ** p < 0.01, *** p < 0.001, **** p < 0.0001 vs. U-251 MG.
Figure 7
Figure 7. Investigation of GPC1’s role in adhesion of GBM cells.
Control GBM cells (U-251 MG and C-) and GPC1-silenced GBM cells (C12, C15, and C23) were assessed for their adhesion properties on laminin, collagen IV and vitronectin, using, as experimental controls, the absence of substrates or BSA blocking of the dish. The experiment was conducted for 2 or 4 h before (A) staining with crystal violet and imaging through an optical microscope. The scale bar refers to 1,000 µm. (B) The dye was solubilized with 10% acetic acid, and absorbance was measured. The OD570 values were normalized to the condition of the absence of a substrate in the original cell line (U-251 MG) at the time of 2 h. (C) Otherwise, absorbance values were non-linearly fitted to three-parameter sigmoid models to inspect kinetic models for the adhesion profile for each cell line in each studied condition. Data are shown as mean ± SEM and were analyzed with either two- (in B) or one-way (in C) ANOVA with Dunnett’s post hoc test. Statistically significant comparisons are marked as follows: * p < 0.05, ** p < 0.01, *** p < 0.001, **** p < 0.0001 vs. U-251 MG; and # p < 0.05, ## p < 0.01 vs. C-.
Figure 8
Figure 8. Experiments to investigate whether GPC1 influences TMZ susceptibility in GBM cells.
(A) U-251 MG (a1), C- (a2), C12 (a3), C15 (a4), and C23 (a5) were incubated with different concentrations of TMZ ranging from 0 – 3 mM for 24 h, and the metabolic activity of the cells was assessed by the MTT assay. Experimental data was non-linear fitted to the Hill equation, the parameters of which are shown in Supplementary Table 3. The horizontal dotted line represents the 50% response and the vertical line the calculated IC50. A representation of all models together is also exhibited (a6). (B) Comparison of IC50 values after model adjustment. C-’s IC50 is not shown as the Hill equation could not be adjusted. Data are plotted as mean ± SEM and were analyzed with the one-way ANOVA with Dunnett’s post hoc test. Statistically significant comparisons are marked as follows: **** p < 0.0001 vs. U-251 MG.

Similar articles

Cited by

References

    1. Louis DN, Perry A, Reifenberger G, von Deimling A, Figarella-Branger D, Cavenee WK, Ohgaki H, Wiestler OD, Kleihues P, Ellison DW. The 2016 World Health Organization Classification of Tumors of the Central Nervous System: a summary. Acta Neuropathol. 2016; 131:803–20. 10.1007/s00401-016-1545-1. - DOI - PubMed
    1. Ostrom QT, Gittleman H, Truitt G, Boscia A, Kruchko C, Barnholtz-Sloan JS. CBTRUS Statistical Report: Primary Brain and Other Central Nervous System Tumors Diagnosed in the United States in 2011–2015. Neuro Oncol. 2018. (Suppl 4); 20:iv1–86. 10.1093/neuonc/noy131. - DOI - PMC - PubMed
    1. Davis ME. Glioblastoma: Overview of Disease and Treatment. Clin J Oncol Nurs. 2016. (Suppl 5); 20:S2–8. 10.1188/16.CJON.S1.2-8. - DOI - PMC - PubMed
    1. Iozzo RV, Sanderson RD. Proteoglycans in cancer biology, tumour microenvironment and angiogenesis. J Cell Mol Med. 2011; 15:1013–31. 10.1111/j.1582-4934.2010.01236.x. - DOI - PMC - PubMed
    1. Schaefer L, Schaefer RM. Proteoglycans: from structural compounds to signaling molecules. Cell Tissue Res. 2010; 339:237–46. 10.1007/s00441-009-0821-y. - DOI - PubMed

LinkOut - more resources