. 2020 Feb 18;11(1):2041669520903553.
doi: 10.1177/2041669520903553. eCollection 2020 Jan-Feb.

Hues of Color Afterimages

Affiliations

Hues of Color Afterimages

Jan Koenderink et al. Iperception. .

Abstract

We studied the relationship between color afterimages and complementary colors. The hues of afterimages of 24 inducer hues, uniformly distributed over the rgb color circle, were measured by an iterative method of adjustment. The judgment of equality of hue of the afterimage and a synthesized patch was effectively judged at the moment immediately after the switch-off of the inducer, when the synthesized patch went through any number of iterative adjustments. The two patches-both phenomenally present, but only one optically presented-appeared to the left and right of a fixation mark that was fixated throughout the whole procedure. Thus, both patches were present in eccentric vision. The hues of afterimages were found to be quite different from the hue of the complementary of the inducer. Almost one half of the color circle (orange to chartreuse) leads to afterimage hues in a narrow region of purples. This implies that color circles based on diametrically opposed inducer-afterimage hues are necessarily inconsistent. Yet, perhaps surprisingly, the relation between primary and afterimage hues is still approximately an involution (they are reciprocally related).

Keywords: RGB colors; afterimage; color; complementary colors; gamma correction; supplementary colors.


Figures

Figure 1.
Figure 1.
A full cycle of the adjustment procedure. Note that the figure approximates the subjective appearance of the stimuli to the observers. From top to bottom, left to right: (A) Empty screen with fixation mark (mark not on scale); (B) inducer appears as the participant hits the space bar; (C) the inducer grows less vivid; (D) the inducer often gains a complementary rim; for some observers, the inducer is not noticed any more; (E) after at least 20 s, the participant starts the next phase; the inducer vanishes and the afterimage appears; at the same time, the matching patch appears. The participant adjusts the matching patch using the arrow keys; (F and G) when this becomes hard, due to the paling of the afterimage, the participant hits the space bar; (H) the “wipeout” pattern appears for a few seconds, then the empty screen with fixation mark reappears; the participant starts a new round. The only difference is that the setting of the matching patch is retained. Only when satisfied that the match cannot be improved does the participant hit the return key, thus terminating the present trial.
Figure 2.
Figure 2.
An overview of all responses. The rows at top and bottom show the inducer hues. This matrix plot shows the hues of the afterimages indicated by the participants as a function of the inducer hue.
Figure 3.
Figure 3.
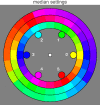
The median response for all observers (outer annulus). The inducers (inner annulus) and supplementary hues (center annulus) are shown for comparison. Color indices for the cardinal colors (notion of “cardinal colors” explained in Appendix A) are indicated, although all 24 (mostly interpolated) hues are shown. Notice the apparent clustering of the afterimage hues.
Figure 4.
Figure 4.
The medians of the difference between the hue indices (see Appendix A) of the afterimages and the corresponding supplementaries of the inducers, as a function of the inducers, for all participants. For this graph, the data were slightly smoothed; for the case of all other figures, no such smoothing was applied.
Figure 5.
Figure 5.
A shift diagram for the pooled data of all participants. The outer circle represents the hues of the supplementaries of the inducing colors, whereas the inner circle shows the corresponding hues of the afterimage. For ease of reference, corresponding points have been joined by connecting line segments.
Figure 6.
Figure 6.
The division of the hue circle induced by the three clusters. The steps along the color circle indicate the inducers. The colors of the sectors are the centers of the afterimage clusters.
Figure 7.
Figure 7.
The clusters for all participants. The large circles indicate the inducers. The small circles indicate the afterimages. This figure (together with Figure 6) serves as a convenient summary of the results.
Figure 8.
Figure 8.
Here, we show the fiducial colors of the 24-step scale on top and the hue of the afterimage of the color that has the hue of the afterimage of the fiducial color at the bottom. It shows that the relation is fairly close to an involution, although admittedly only approximately.
Figure 9.
Figure 9.
Here, one half of all inducers are connected to the opposite half of the hue circle by circular arcs through the center to the median afterimage hues. This is a plot similar to Figure 9 in Wilson and Brocklebank. Different from the latter, we find no perfect “afterimage pairs” (the reciprocity issue). Thus, we split the graph in two halves to improve its legibility. Because arcs are forced to pass through the center, this graph illustrates the deviations from the supplementary hue (the antipode) especially well.
Figure A1.
Figure A1.
The RGB primaries (“parts of white”) in the chromaticity diagram. At left, we show the RGB triangle based on the “parts of white” (bluish) and the locus of most vivid hues (outline of the brownish region). At right, we indicate the skeleton structure. The red curves that connect the spectrum limits to the white point are the Goethe Kantenfarben (edge colors). These provide parts of the locus of most vivid hues. The remaining parts are band-pass Schrödinger optimal colors (green-branch) and their supplementaries, the band gap Schrödinger optimal colors (purple-branch). The spectrum limits and the complementary wavelengths of the spectrum limits are indicated in black. The latter nearly indicate the cut loci for the “parts of white.” Notice that the chromaticity diagram is a central projection from the black point, which severely distorts the geometry and fails to be intuitive to many people.
Figure A2.
Figure A2.
Left: A generic view of the RGB cube. The cube is a unique colorimetric object that depends on the choice of illuminant spectrum. The cardinal colors are located on a nonplanar polygon that surrounds the gray-axis. Center: A view of the RGB cube along the gray-axis, looking toward white. In this orthographic projection, the cardinal colors are arranged as the vertices of a regular hexagon. All full colors (defined by the maximum distance from the gray-axis) lie on the edges of the polygon and can be obtained by linear interpolation between two adjacent cardinal colors. Right: In various conventional representations, the hexagon is rendered as the “hue circle.” This is indeed a pure convention, unlike the colorimetric structure shown at center and left.

References

    1. Albertazzi L., Koenderink J., van Doorn A. (2015). Chromatic dimensions earthy, watery, airy, and fiery. Perception, 44, 1153–1178. - PubMed
    1. Anstis, S. (2017). Negative afterimages from flicker-augmented colors. i-Perception, 8(2), 1–3. doi:10.1177/2041669517699414 - PMC - PubMed
    1. Aubert H. (1865). Physiologie der netzhaut [Physiology of the retina] (p. 365). Breslau, Germany: Verlag von E.Morgenstern (fr. Aug. Schulz & Co.).
    1. Bagley M.-O., Maxfield M. S. (1986). Afterimage color perception for designers. Perceptual and Motor Skills, 63, 995–1007. - PubMed
    1. Bouma P. J. (1948). Physical aspects of colour: An introduction to the scientific study of colour stimuli and colour sensations. Eindhoven, the Netherlands: Philips Technical Library, Philips Gloeilampenfabrieken (Philips Industries) Technical and Scientific Literature Dept.

How to cite this article

    1. Koenderink J., van Doorn A., Witzel C., Gegenfurtner K. (2020). Hues of color afterimages. i-Perception, 11(1), 1–18. doi:10.1177/2041669520903553 - PMC - PubMed

LinkOut - more resources