

Application of the ARIMA model on the COVID-2019 epidemic dataset
- PMID: 32181302
- PMCID: PMC7063124
- DOI: 10.1016/j.dib.2020.105340
Application of the ARIMA model on the COVID-2019 epidemic dataset
Abstract
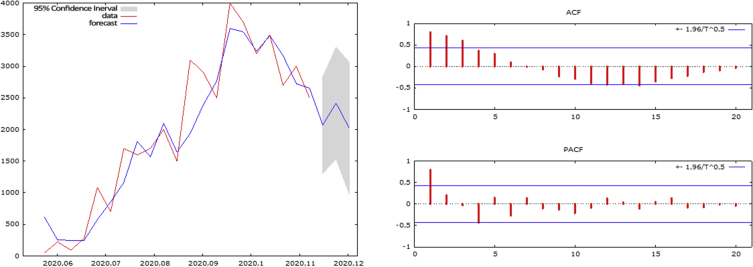
Coronavirus disease 2019 (COVID-2019) has been recognized as a global threat, and several studies are being conducted using various mathematical models to predict the probable evolution of this epidemic. These mathematical models based on various factors and analyses are subject to potential bias. Here, we propose a simple econometric model that could be useful to predict the spread of COVID-2019. We performed Auto Regressive Integrated Moving Average (ARIMA) model prediction on the Johns Hopkins epidemiological data to predict the epidemiological trend of the prevalence and incidence of COVID-2019. For further comparison or for future perspective, case definition and data collection have to be maintained in real time.
Keywords: ARIMA model; COVID-2019 epidemic; Forecast; Infection control.
© 2020 The Authors.
Figures

References
-
- Johns Hopkins University Center for Systems Science and Engineering. 2019. https://github.com/CSSEGISandData/COVID-19 - PMC - PubMed
-
- Fattah J., Ezzine L., Aman Z., El Moussami H., Lachhab A. Forecasting of demand using ARIMA model. Int. J. Eng. Bus. Manag. 2018;10
-
- Cheung Y.-W., Lai K.S. Lag order and critical values of the augmented Dickey–Fuller test. J. Bus. Econ. Stat. 1995;13:277–280.
-
- Baiocchi G., Distaso W. GRETL: econometric software for the GNU generation. J. Appl. Econom. 2003;18:105–110.
LinkOut - more resources
Full Text Sources
