. 2020 Mar 4;6(10):eaax5979.
doi: 10.1126/sciadv.aax5979. eCollection 2020 Mar.

Efficient inverse graphics in biological face processing

Affiliations

Efficient inverse graphics in biological face processing

Ilker Yildirim et al. Sci Adv. .

Abstract

Vision not only detects and recognizes objects, but performs rich inferences about the underlying scene structure that causes the patterns of light we see. Inverting generative models, or "analysis-by-synthesis", presents a possible solution, but its mechanistic implementations have typically been too slow for online perception, and their mapping to neural circuits remains unclear. Here we present a neurally plausible efficient inverse graphics model and test it in the domain of face recognition. The model is based on a deep neural network that learns to invert a three-dimensional face graphics program in a single fast feedforward pass. It explains human behavior qualitatively and quantitatively, including the classic "hollow face" illusion, and it maps directly onto a specialized face-processing circuit in the primate brain. The model fits both behavioral and neural data better than state-of-the-art computer vision models, and suggests an interpretable reverse-engineering account of how the brain transforms images into percepts.


Figures

Fig. 1
Fig. 1. Overview of the modeling framework.
(A) Schematic illustration of two alternative hypotheses about the function of ventral stream processing: the recognition or classification hypothesis (top) and the inverse graphics or inference network hypothesis (bottom). (B) Schematic of the EIG model. Rounded rectangles indicate representations; arrows or trapezoids indicate causal transformations or inferential mappings between representations. (i) The probabilistic generative model (right to left) draws an identity from a distribution over familiar and unfamiliar individuals and then, through a series of graphics stages, generates 3D shape, texture, and viewing parameters, renders a 2D image via 2.5D image-based surface representations, and places the face image on an arbitrary background. (ii) The EIG inference network efficiently inverts this generative model using a cascade of DNNs, with intermediate steps corresponding to intermediate stages in the graphics pipeline, including face segmentation and normalization (f1), inference of 3D scene properties via increasingly abstract image-based representations (convolution and pooling, f2 to f3), followed by two FCLs (f4 to f5), and finally a person identification network (f6). (iii) Schematic of ventral-stream face perception in the macaque brain, from V1 up to inferotemporal cortex (IT), including three major IT face-selective sites (ML/MF, AL, and AM), and onto downstream medial temporal lobe (MTL) areas where person identity information is likely computed. Pins indicate empirically established or suggested functional explanations for different neural stages, based on the generative and inference models of EIG. Pins attached to horizontal dashed lines indicate untested but possible correspondences.
Fig. 2
Fig. 2. Overview of the modeling framework.
(A) Image-based log-likelihood scores for a random sample of observations using the EIG network’s inferred scene parameters (layer f5) compared to a conventional MCMC-based analysis-by-synthesis method. EIG estimates are computed with no iterations (red line; pink shows min-max interval), yet achieve a higher score and lower variance than MCMC, which requires hundreds of iterations to achieve a similar mean level of inference quality (thick line; thin lines show individual runs; see also Materials and Methods). (B) Example inference results from EIG, on held-out real face scans rendered against cluttered backgrounds. Inferred scene parameters are rendered, re-posed, and re-lit using the generative model. (C) Example inference results from the EIG network applied to real-world face images. Faces have been re-rendered in a frontal pose using the generative model applied to the latent scene parameters inferred by EIG. Although the EIG recognition network is trained only on samples from the generative model, it can still generalize reasonably well to real-world faces of different genders and complexions. Re-rendered results are not perfect, but they are recognizably more similar to the corresponding input face image than to other faces. All images are public domain and fetched from the following sources (from top to bottom): http://tinyurl.com/whtumjy, http://tinyurl.com/te5vzps, http://tinyurl.com/rcof3zj, and http://tinyurl.com/u8nxz7w.
Fig. 3
Fig. 3. Inverse graphics in the brain.
(A) Inflated macaque right hemisphere showing six temporal pole face patches, including ML/MF, AL, and AM. (B) Sample FIV images consisting of 25 individuals each shown in seven poses, making a total of 175 images. These images were used in (28). Photo credit: Margaret Livingstone. (C) (i) Population-level similarity matrices for each face patch. Each matrix shows correlation coefficients of population-level responses for each image pair from the FIV image set (28). (ii) Coefficients resulting from a linear decomposition of the population similarity matrices in terms of idealized similarity matrices for view specificity, mirror symmetry, and view invariance shown in (iii), in addition to a constant background factor to account for overall mean similarity. (D) (i) Similarity matrices for each key layer of the EIG network—f3, f4, and f5—tested with FIV image set. Each image is represented as a vector of activations in the corresponding layer. (ii) Linear regression coefficients showing contribution of each idealized similarity matrix for each layer. (iii) Comparing full set of neural transformations to model transformations using these coefficients. (iv) Pearson’s r between similarity matrices arising from each of the neural populations and model layers. (E) VGG network tested using FIV image set. Subpanels follow the same convention as the EIG results. Error bars show 95% bootstrap confidence intervals (CIs; see Materials and Methods).
Fig. 4
Fig. 4. Understanding ML/MF computations using the generative model and the 2.5D (or intrinsic image) components.
(A) Similarity matrices based on raw input (R) images, attended images (Att), albedos (A), and normals (N). Colors indicate the direction of the normal of the underlying 3D surface at each pixel location. (B) Correlation coefficients between ML/MF and the similarity matrices of each image representation in (A) and f3. Error bars indicate 95% bootstrap CIs.
Fig. 5
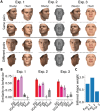
Fig. 5. Across three behavioral experiments, EIG consistently predicts human face identity matching performance.
(A) Example stimuli testing same-different judgments (same trials, rows 1 and 2; different trials, rows 3 and 4) with normal test faces (experiment 1), “sculpture” (textureless) test faces (experiment 2), and fish-eye lens distorted shadeless facial textures as test faces (experiment 3). (B) Correlations between model similarity judgments and humans’ probability of responding same. (C) Inferred weights (a value between 0 and 1 that maximized model’s recognition accuracy) of the shape properties (relative to texture properties) in the EIG model predictions for experiments 1 to 3. Error bars indicate 95% bootstrap CIs (see Materials and Methods).
Fig. 6
Fig. 6. Psychophysics of the “hollow face” effect.
On a given trial, participants saw an image of a face lit by a single light source and judged either the elevation of the light source (C and D) or the profile depth of the presented face (E and F) using a scale between 1 and 7 (see also Materials and Methods and sections S4.4 and S4.5). (A) One group of participants (depth-suppression group) was presented with images of faces that were always lit from the top, but where the shape of the face was gradually reversed from a normally shaped face (convexity = 1) to a flat surface (convexity = 0) to an inverted hollow face (convexity = −1). (B) Another group of participants (control group) was presented with images of normally shaped faces (convexity = 1) lit from one of the nine possible elevations ranging from the top of the face to the bottom. (C) Normalized average light source elevation judgments of the depth-suppression group (left), the control group (right), EIG’s lighting elevation inferences, and the ground truth light source location. (D) Average human judgments versus EIG’s lighting source elevation inferences across all 90 trials without pooling to nine bins. Pearson’s r values are shown for all trials (gray), control trials (red), and depth-suppression trials (blue). (E) Normalized average profile depth judgments of the depth-suppression group (left), control group (right), and EIG’s inferred profile depth. (F) Average human judgments versus EIG’s inferred profile depths across all 108 trials without pooling to nine bins. Pearson’s r values are shown as in (D).

References

    1. B. A. Olshausen, Perception as an inference problem, in The Cognitive Neurosciences, M. Gazzaniga, R. Mangun, Eds. (MIT Press, 2013).
    1. Yuille A., Kersten D., Vision as Bayesian inference: Analysis by synthesis? Trends Cogn. Sci. 10, 301–308 (2006). - PubMed
    1. H. Barrow, J. Tenenbaum, Recovering intrinsic scene characteristics from images, in Computer Vision Systems (Elsevier, 1978), p. 2.
    1. Brady T. F., Konkle T., Alvarez G. A., Oliva A., Visual long-term memory has a massive storage capacity for object details. Proc. Natl. Acad. Sci. U.S.A. 105, 14325–14329 (2008). - PMC - PubMed
    1. Lee T. S., Mumford D., Hierarchical bayesian inference in the visual cortex. J. Opt. Soc. Am. A 20, 1434–1448 (2003). - PubMed

Publication types

LinkOut - more resources