. 2020 Mar 4;6(10):eaay7505.
doi: 10.1126/sciadv.aay7505. eCollection 2020 Mar.

Probing biophysical sequence constraints within the transmembrane domains of rhodopsin by deep mutational scanning

Affiliations

Probing biophysical sequence constraints within the transmembrane domains of rhodopsin by deep mutational scanning

Wesley D Penn et al. Sci Adv. .

Abstract

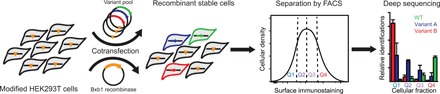
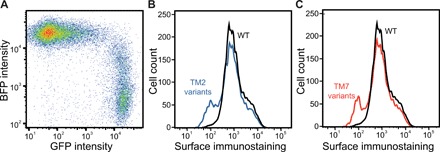
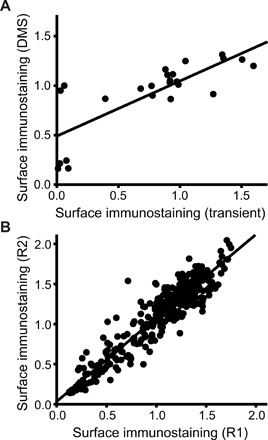
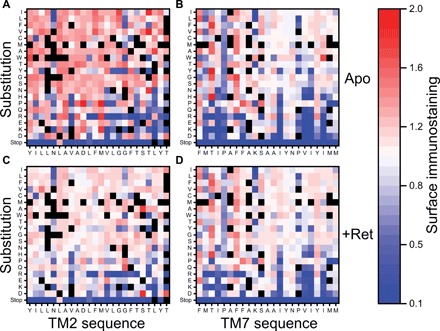
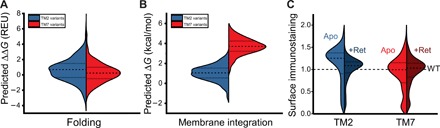
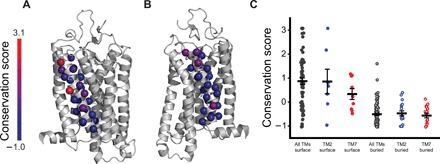
Membrane proteins must balance the sequence constraints associated with folding and function against the hydrophobicity required for solvation within the bilayer. We recently found the expression and maturation of rhodopsin are limited by the hydrophobicity of its seventh transmembrane domain (TM7), which contains polar residues that are essential for function. On the basis of these observations, we hypothesized that rhodopsin's expression should be less tolerant of mutations in TM7 relative to those within hydrophobic TM domains. To test this hypothesis, we used deep mutational scanning to compare the effects of 808 missense mutations on the plasma membrane expression of rhodopsin in HEK293T cells. Our results confirm that a higher proportion of mutations within TM7 (37%) decrease rhodopsin's plasma membrane expression relative to those within a hydrophobic TM domain (TM2, 25%). These results in conjunction with an evolutionary analysis suggest solvation energetics likely restricts the evolutionary sequence space of polar TM domains.


Figures

Fig. 1
Fig. 1. A mutational scan for the surface expression of rhodopsin variants.
A cartoon depicts the general workflow for the deep mutational scanning assay described herein. A pool of stable cells expressing single rhodopsin variants from a common genomic locus is first produced by cotransfecting a plasmid library and an expression vector for Bxb1 recombinase (23). Recombined cells are then isolated on the basis of their characteristic bicistronic enhanced green fluorescent protein (eGFP) expression. The stable library is then fractionated according to the surface immunostaining levels of expressed rhodopsin variants using fluorescence-activated cell sorting (FACS). The relative abundance of each variant within each fraction is then evaluated by deep sequencing. Sequencing data are then used to determine the relative surface immunostaining of each variant. HEK293T, human embryonic kidney 293T.
Fig. 2
Fig. 2. Characterization of stable cellular libraries expressing individual rhodopsin variants.
Recombinant stable cell lines expressing single rhodopsin variants were characterized by flow cytometry. (A) A stable HEK293T cell line bearing a single genomic attP recombination site was cotransfected with a Bxb1 expression vector and a plasmid cassette bearing an attB recombination site and a library of rhodopsin variants bearing missense and nonsense mutations in TM2, and the fluorescence profiles were analyzed by flow cytometry 4 days after transfection. A dot plot shows the distribution of single-cell fluorescence intensities among transfected cells. BFP is expressed from the unmodified genomic landing pad and serves as a marker for cells that have failed to undergo recombination. GFP is expressed as a consequence of recombination between the vector and landing pad and serves as a marker for recombinant stable cells. (B) An intact recombinant cell line expressing missense variants within TM2 were immunostained for surface rhodopsin before analysis of cellular fluorescence profiles by flow cytometry. A histogram depicts the distribution of fluorescence intensities associated with the rhodopsin immunostaining of stable cells expressing individual TM2 variants (blue). A histogram depicting the distribution of cellular fluorescence intensities associated with surface rhodopsin levels among cells expressing wild-type (WT) rhodopsin (black) is shown for reference. (C) An intact recombinant cell line expressing missense variants within TM7 was immunostained for surface rhodopsin before analysis of cellular fluorescence profiles by flow cytometry. A histogram depicts the distribution of fluorescence intensities associated with the rhodopsin immunostaining of stable cells expressing individual TM7 variants (red). A histogram depicting the distribution of cellular fluorescence intensities associated with surface rhodopsin levels among cells expressing WT rhodopsin (black) is shown for reference.
Fig. 3
Fig. 3. Validation and reproducibility of deep mutational scanning measurements.
The accuracy and precision of surface immunostaining values determined by deep mutational scanning were assessed. (A) Surface immunostaining levels associated with 12 rhodopsin variants were determined in the presence and absence of 5 μM 9-cis-retinal by deep mutational scanning (y-coordinate), normalized by the WT value, and plotted against the corresponding values determined from a flow cytometry–based analysis of transiently expressed rhodopsin variants under the same conditions (x-coordinate). A linear fit of the data (Pearson’s R = 0.78) is included for reference. (B) Deep mutational scanning measurements from two independent biological replicates for TM2 variants are shown as a representative example. Surface immunostaining values for 446 rhodopsin variants bearing mutations in TM2 were measured by deep mutational scanning and normalized relative to the value for the WT protein. Values from two representative replicate experiments (R1 and R2) are plotted against one another. A linear fit of the data (Pearson’s R = 0.95) is shown for reference.
Fig. 4
Fig. 4. Influence of mutations within TM domains 2 and 7 on the surface immunostaining of opsin and rhodopsin.
Surface immunostaning levels for rhodopsin variants bearing mutations within TMs 2 and 7 were determined by deep mutational scanning in the presence and absence of 9-cis-retinal and then normalized relative to the value of WT. Heatmaps depict the relative surface immunostaining values for opsin variants bearing each amino acid substitution (y-coordinate) at each position (x-coordinate) within TM2 (A) and TM7 (B) in the absence of retinal. Heatmaps depicting the relative surface immunostaining values for rhodopsin variants bearing each amino acid substitution within TM2 (C) and TM7 (D) in the presence of 5 μM 9-cis-retinal are also shown. Amino acids are arranged on the y-coordinate from the most hydrophobic (top) to the most polar (bottom) according to the White and von Heijne biological hydrophobicity scale (39). A value of 1.0 (white) corresponds to the surface immunostaining value for WT opsin/rhodopsin under each conditions. Variants that lack sufficient data for accurate quantification are indicated in black. Values reflect the averages from two biological replicates.
Fig. 5
Fig. 5. Distribution of mutagenic effects on the surface immunostaining and conformational stability of opsin and rhodopsin.
Trends associated with the surface immunostaining of rhodopsin variants and their predicted energetic effects on cotranslational and posttranslational folding are shown. (A) Violin plots depict the statistical distribution of the effects of all possible missense mutations within TM2 (480 total, blue) and TM7 (460 total, red) on the energetics of rhodopsin folding in Rosetta energy units as calculated using the RosettaMembrane energy scoring function (25). The shape of each distribution was defined using a kernel smoothing function. Dashed lines within the violins reflect the median value, while dotted lines within the violins reflect the positions of the 25th and 75th percentiles. Positive ΔΔG values are indicative of a destabilization of the native structure. (B) Violin plots depict the statistical distribution of the effects of all possible missense mutations within TM2 (480 total, blue) and TM7 (460 total, red) on the translocon-mediated membrane integration of the corresponding transmembrane domains, which were calculated using the ΔG predictor (20). The shape of each distribution was defined using a kernel smoothing function. Dashed lines within the violins reflect the median value, while dotted lines within the violins reflect the positions of the 25th and 75th percentiles. Positive ΔG values indicate the translocon-mediated membrane integration of the helix is unfavorable. (C) Violin plots depict the statistical distribution of surface immunostaining values associated with missense mutations within TM2 (401 total, left) or TM7 (407 total, right) in the presence (dark blue, dark red) and absence (light blue, light red) of 5 μM 9-cis-retinal. Immunostaining intensity values were determined by deep mutational scanning and were normalized relative to the value for the WT protein. The shape of each distribution was defined using a kernel smoothing function. Dashed lines within the violins reflect the median value, while dotted lines within the violins reflect the positions of the 25th and 75th percentiles. Values reflect the averages from two biological replicates.
Fig. 6
Fig. 6. Evolutionary profiling of residues within the transmembrane domains of rhodopsin.
The sequences of 468 rhodopsins were aligned and analyzed to compare the evolutionary rates of residues within each TM domain. (A) The evolutionary rates associated with each residue within TM2 were converted into conservation scores and mapped onto a structural model of rhodopsin. (B) The evolutionary rates associated with each residue within TM7 were converted into conservation scores and mapped onto a structural model of rhodopsin. (C) The conservation scores associated with the surface (closed circles) and buried (open circles) residues within all of the TM domains of rhodopsin (gray) are compared to those within TMs 2 (blue) and 7 (red), specifically. The average conservation score associated with each distribution is plotted, along with whiskers showing the standard error plotted for reference.

References

    1. Harms M. J., Thornton J. W., Evolutionary biochemistry: Revealing the historical and physical causes of protein properties. Nat. Rev. Genet. 14, 559–571 (2013). - PMC - PubMed
    1. Klesmith J. R., Bacik J.-P., Wrenbeck E. E., Michalczyk R., Whitehead T. A., Trade-offs between enzyme fitness and solubility illuminated by deep mutational scanning. Proc. Natl. Acad. Sci. U.S.A. 114, 2265–2270 (2017). - PMC - PubMed
    1. Bershtein S., Segal M., Bekerman R., Tokuriki N., Tawfik D. S., Robustness-epistasis link shapes the fitness landscape of a randomly drifting protein. Nature 444, 929–932 (2006). - PubMed
    1. Bloom J. D., Labthavikul S. T., Otey C. R., Arnold F. H., Protein stability promotes evolvability. Proc. Natl. Acad. Sci. U.S.A. 103, 5869–5874 (2006). - PMC - PubMed
    1. Olson C. A., Wu N. C., Sun R., A comprehensive biophysical description of pairwise epistasis throughout an entire protein domain. Curr. Biol. 24, 2643–2651 (2014). - PMC - PubMed

Publication types

MeSH terms

LinkOut - more resources