

Patient Exposure from Radiologic and Nuclear Medicine Procedures in the United States: Procedure Volume and Effective Dose for the Period 2006-2016
- PMID: 32181730
- PMCID: PMC9754695
- DOI: 10.1148/radiol.2020192256
Patient Exposure from Radiologic and Nuclear Medicine Procedures in the United States: Procedure Volume and Effective Dose for the Period 2006-2016
Abstract
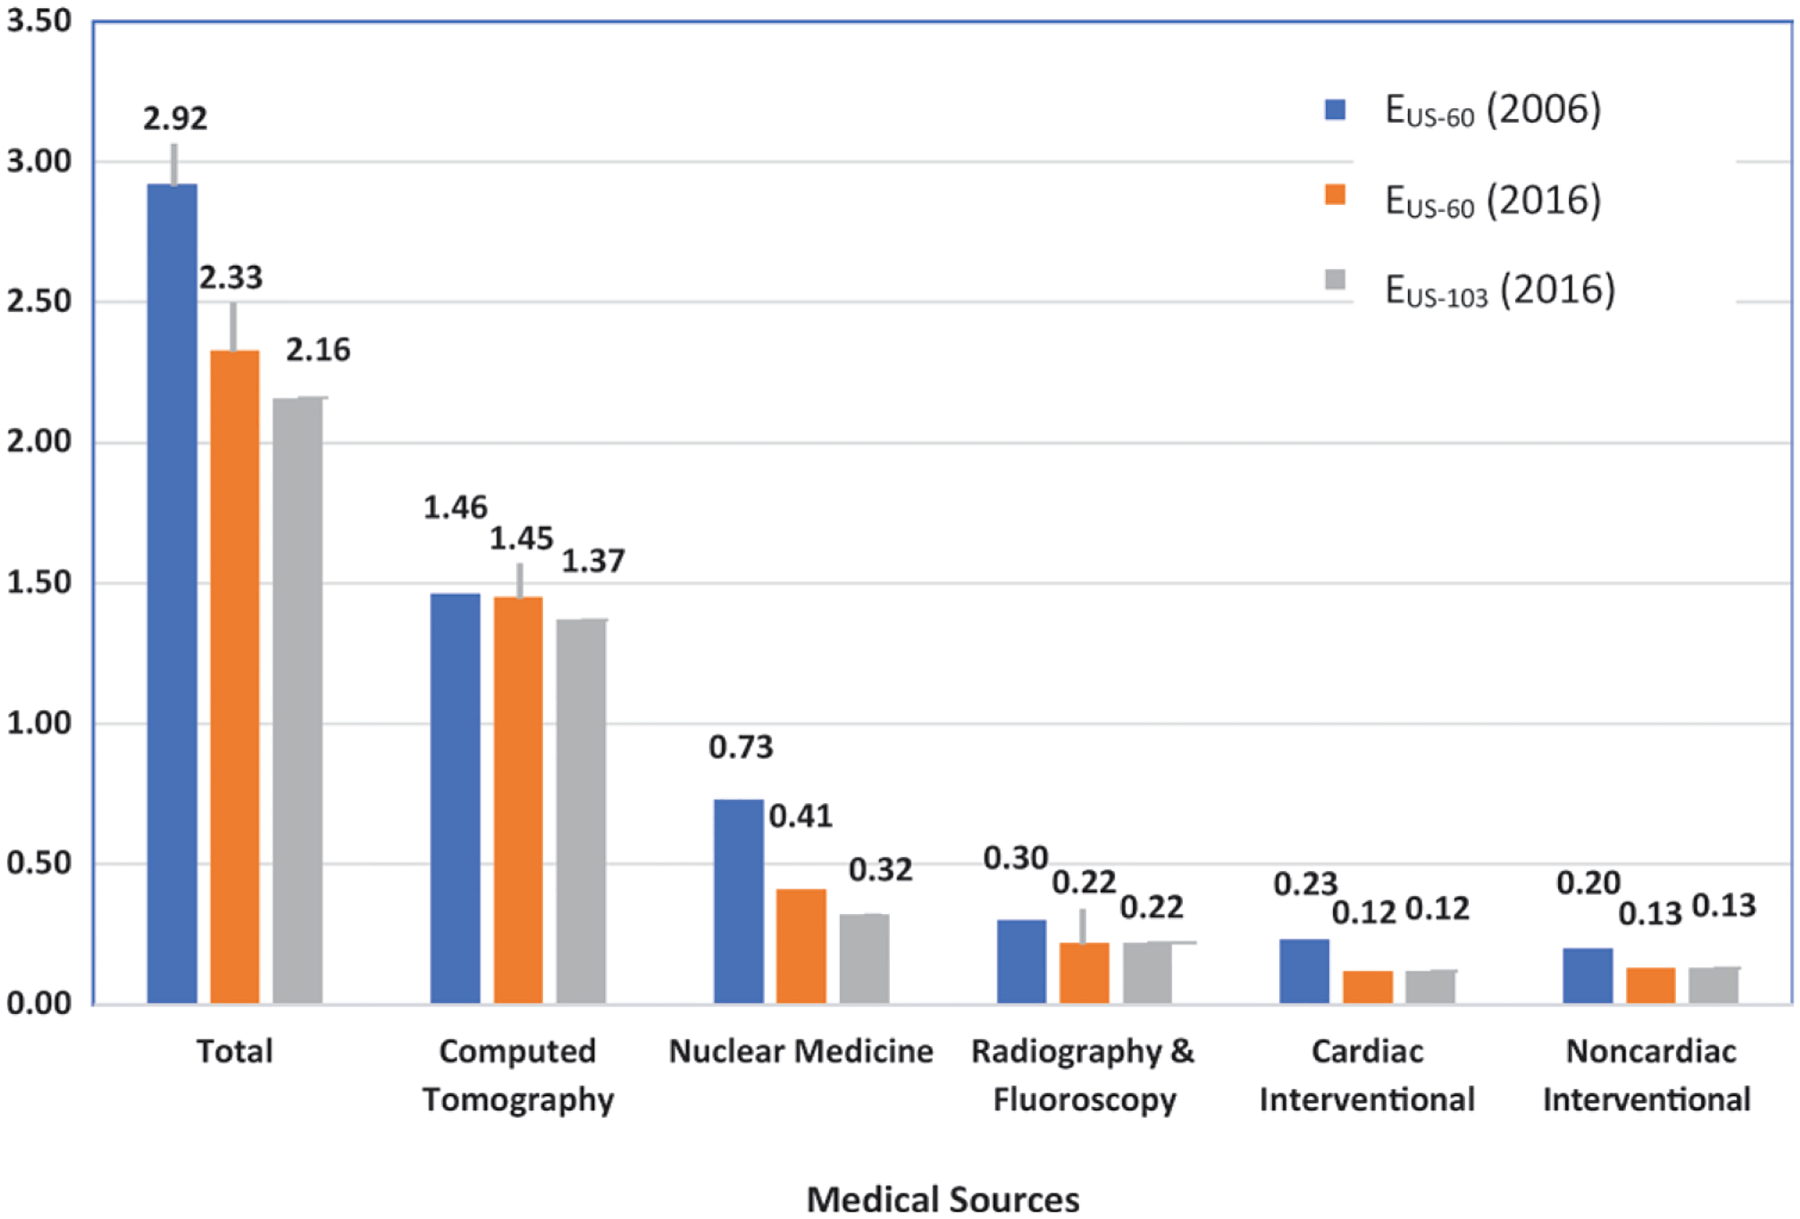
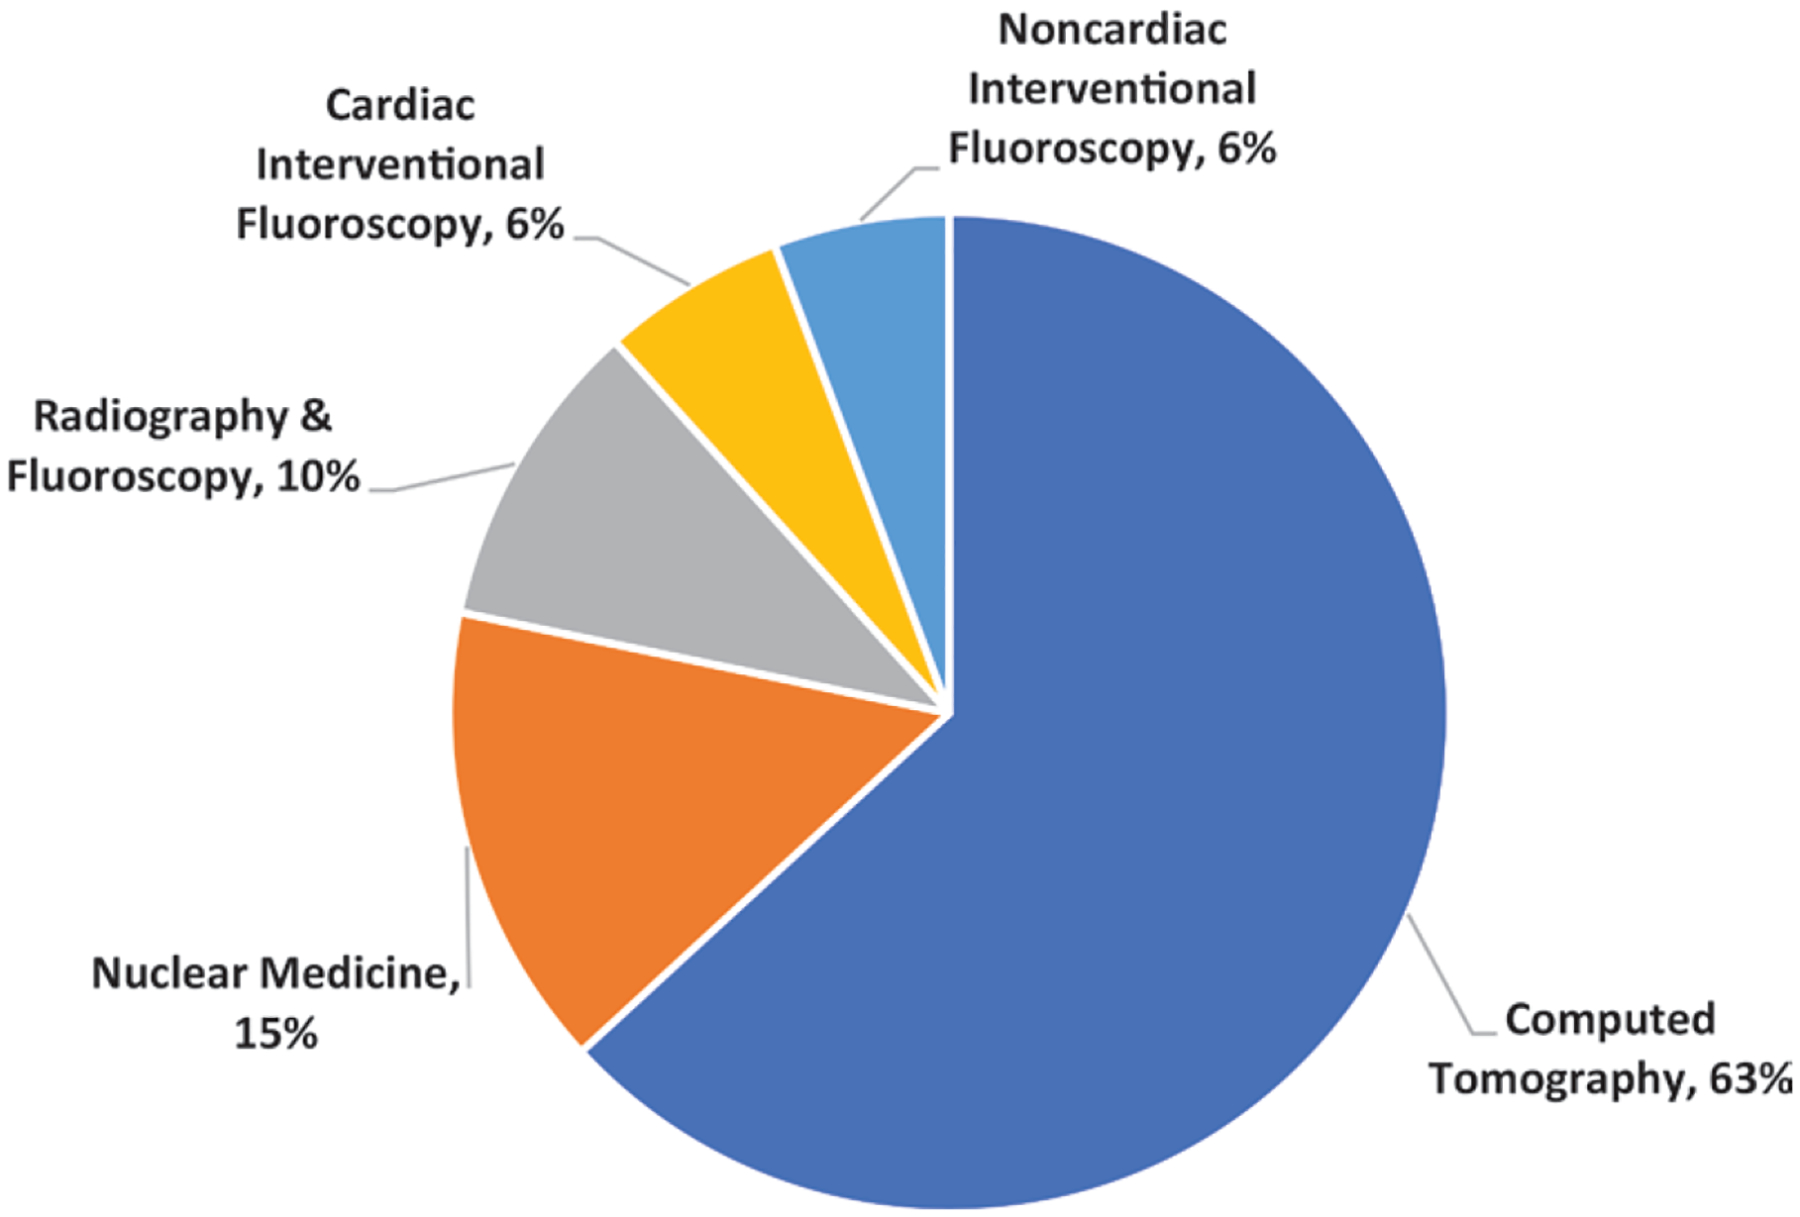
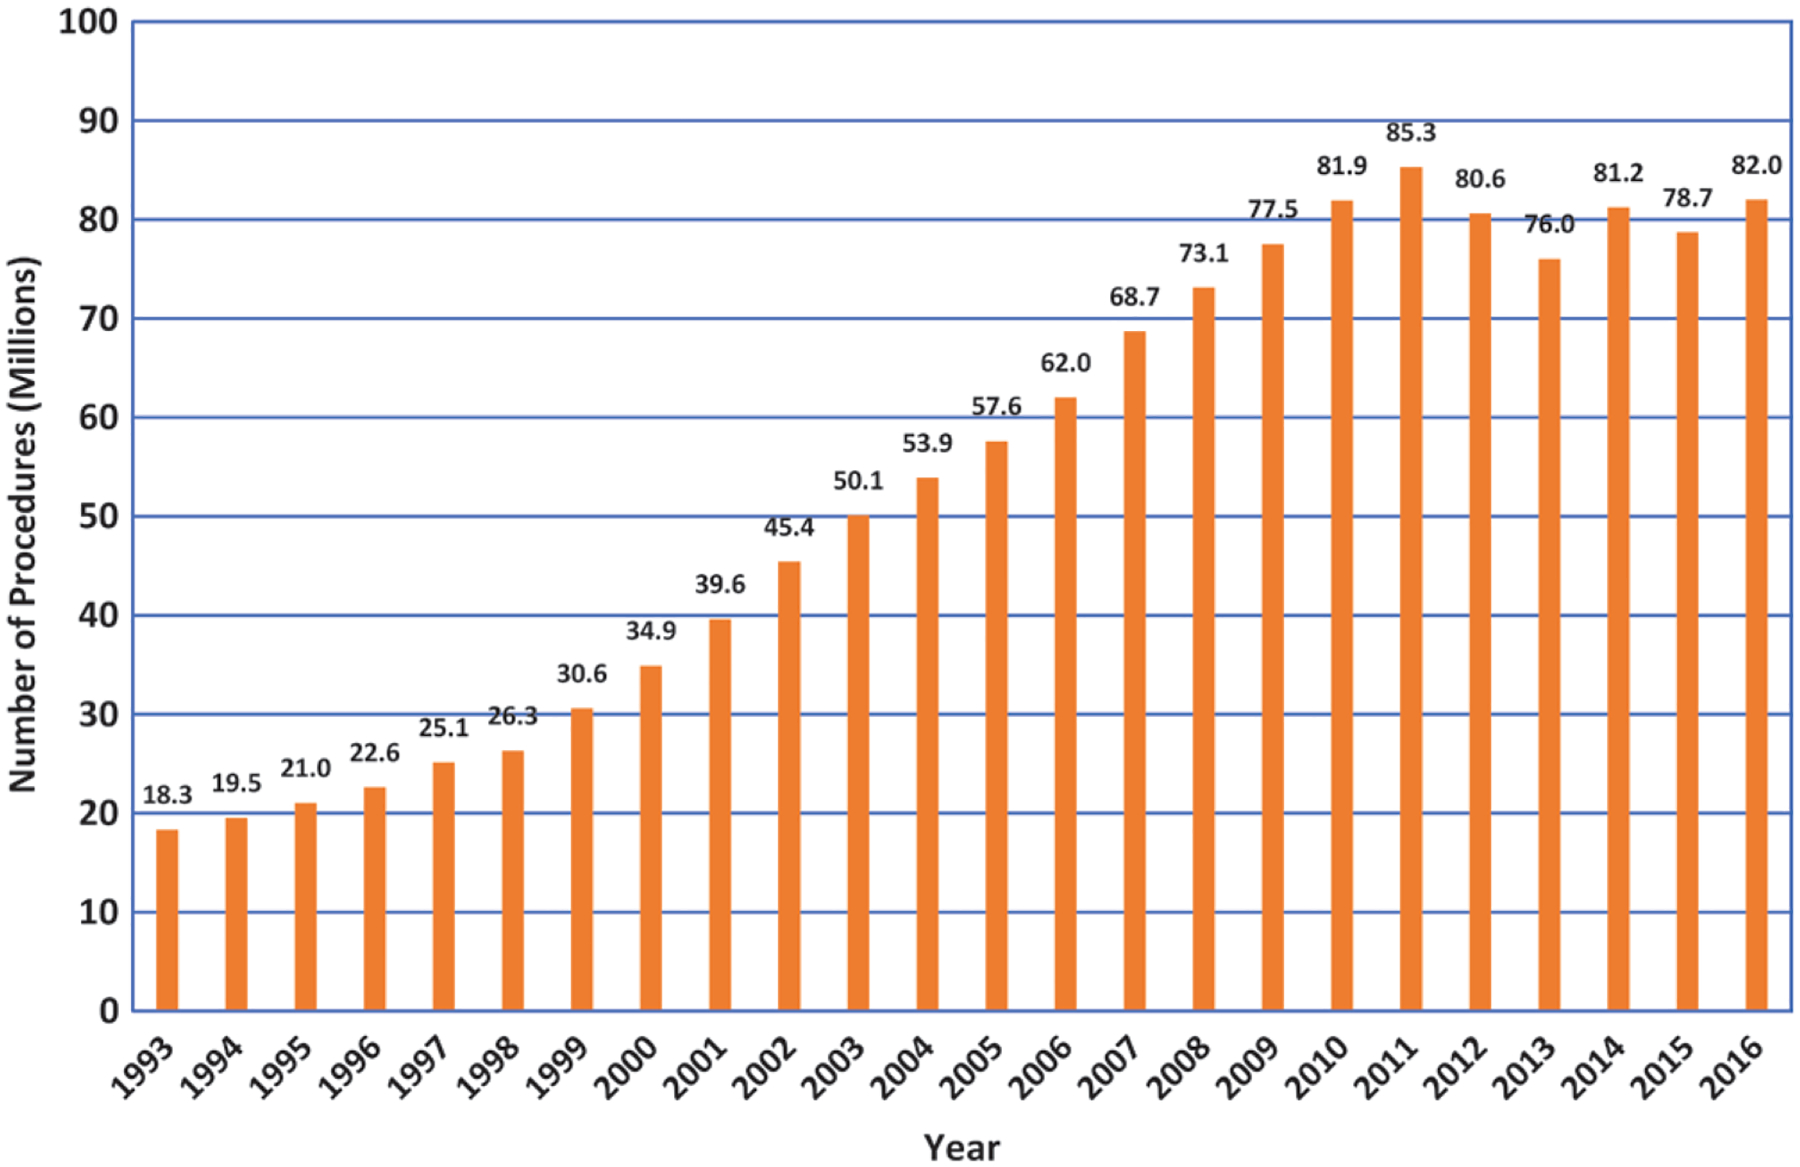
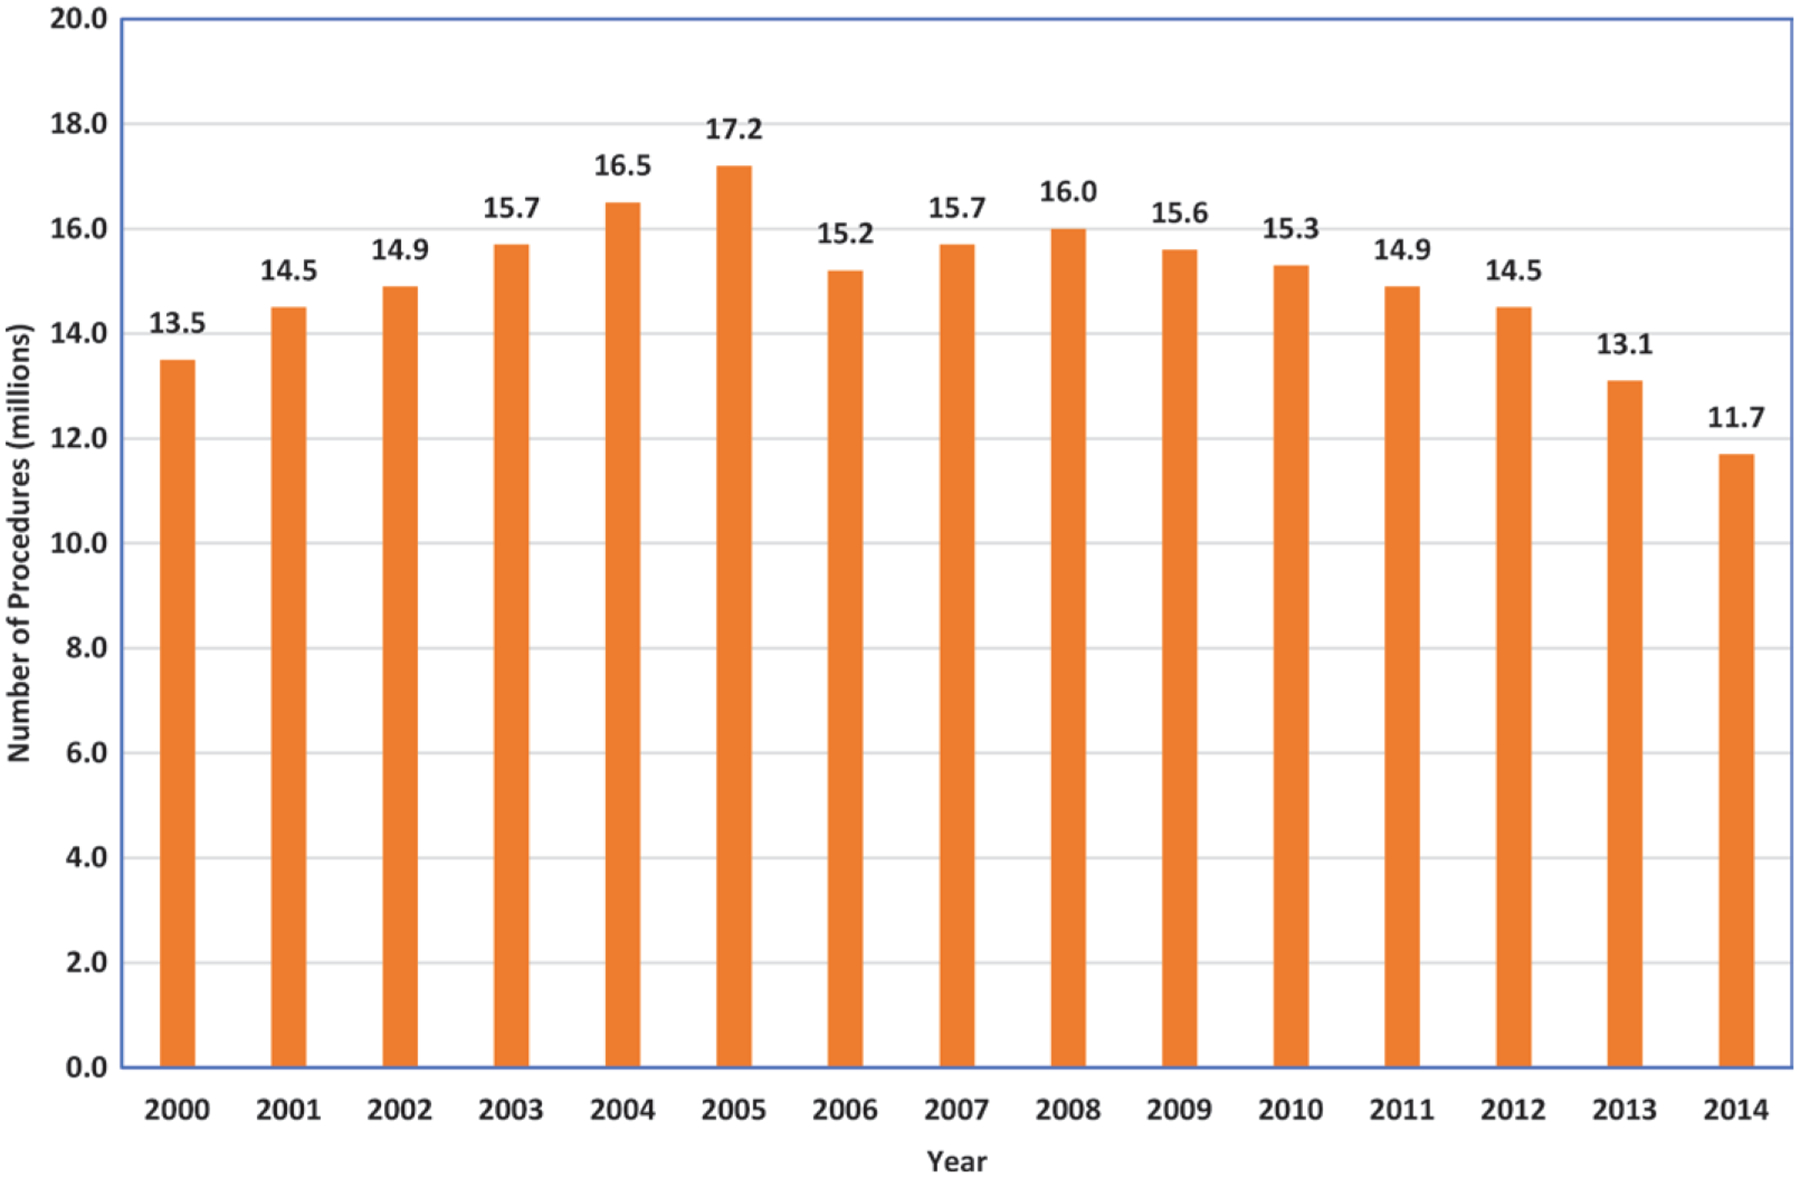
Background Comprehensive assessments of the frequency and associated doses from radiologic and nuclear medicine procedures are rarely conducted. The use of these procedures and the population-based radiation dose increased remarkably from 1980 to 2006. Purpose To determine the change in per capita radiation exposure in the United States from 2006 to 2016. Materials and Methods The U.S. National Council on Radiation Protection and Measurements conducted a retrospective assessment for 2016 and compared the results to previously published data for the year 2006. Effective dose values for procedures were obtained from the literature, and frequency data were obtained from commercial, governmental, and professional society data. Results In the United States in 2006, an estimated 377 million diagnostic and interventional radiologic examinations were performed. This value remained essentially the same for 2016 even though the U.S. population had increased by about 24 million people. The number of CT scans performed increased from 67 million to 84 million, but the number of other procedures (eg, diagnostic fluoroscopy) and nuclear medicine procedures decreased from 17 million to 13.5 million. The number of dental radiographic and dental CT examinations performed was estimated to be about 320 million in 2016. Using the tissue-weighting factors from Publication 60 of the International Commission on Radiological Protection, the U.S. annual individual (per capita) effective dose from diagnostic and interventional medical procedures was estimated to have been 2.9 mSv in 2006 and 2.3 mSv in 2016, with the collective doses being 885 000 and 755 000 person-sievert, respectively. Conclusion The trend from 1980 to 2006 of increasing dose from medical radiation has reversed. Estimated 2016 total collective effective dose and radiation dose per capita dose are lower than in 2006. © RSNA, 2020 See also the editorial by Einstein in this issue.
Conflict of interest statement
Figures
Comment in
-
Medical Radiation Exposure to the U.S. Population: The Turning Tide.Radiology. 2020 May;295(2):428-429. doi: 10.1148/radiol.2020200200. Epub 2020 Mar 17. Radiology. 2020. PMID: 32186459 Free PMC article. No abstract available.
References
-
- Population exposure to x-rays, United States, 1964, Public Health Service Publication No. 1519. Washington DC: DHEW, Public Health Service, 1966.
-
- Population exposure to x-rays, United States 1970, Department of Health Education and Welfare publication (FDA) No. 73-8047. Washington, DC: DHEW, Food and Drug Administration, Bureau of Radiological Health, 1973.
-
- Radiation Experience Data: Documentation and results of the 1980 survey of U.S. Hospitals. Department of Health and Human Services publication (FDA) No. 86-8253. Washington, DC: DHHS, Food and Drug Administration, Center for Devices and Radiological Health, 1985.
-
- Mettler FA Jr. Diagnostic radiology: Usage and trends in the United States, 1964–1980. Radiology 1987;162(1 Pt 1):263–266. - PubMed
-
- Mettler FA Jr, Bhargavan M, Faulkner K, et al. Radiologic and nuclear medicine studies in the United States and worldwide: Frequency, radiation dose, and comparison with other radiation sources—1950–2007. Radiology 2009;253(2):520–531. - PubMed
MeSH terms
Grants and funding
LinkOut - more resources
Full Text Sources
Medical
