. 2020 Apr 9;5(7):e134359.
doi: 10.1172/jci.insight.134359.

Leptin receptor-expressing nucleus tractus solitarius neurons suppress food intake independently of GLP1 in mice

Affiliations

Leptin receptor-expressing nucleus tractus solitarius neurons suppress food intake independently of GLP1 in mice

Wenwen Cheng et al. JCI Insight. .

Abstract

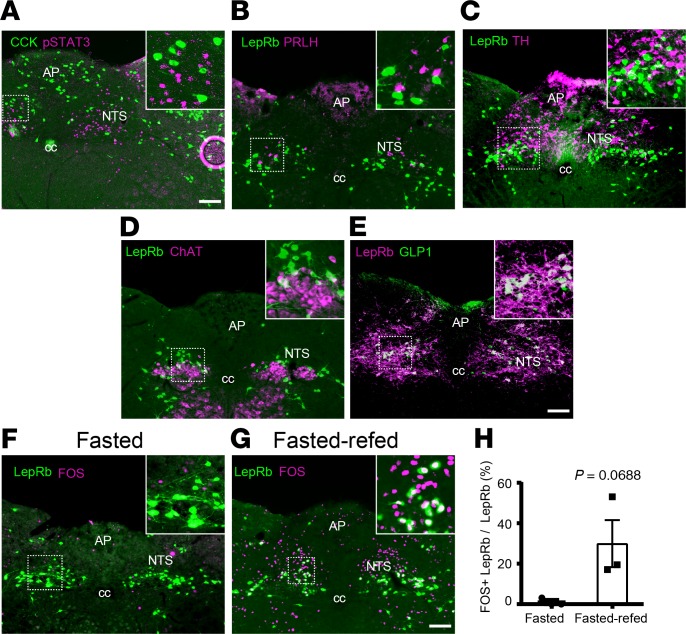
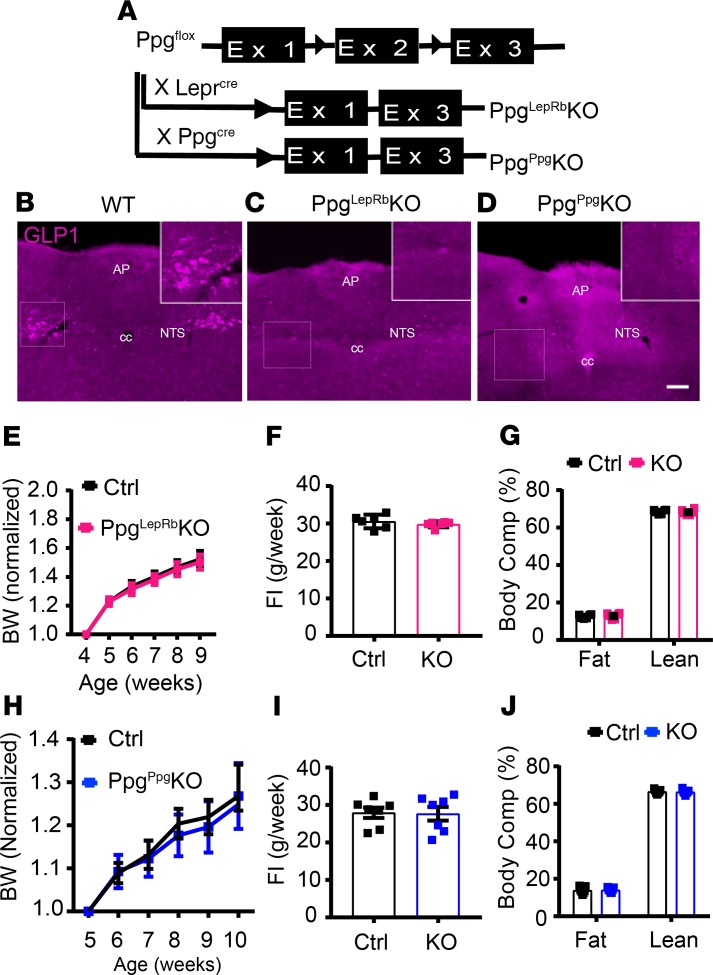
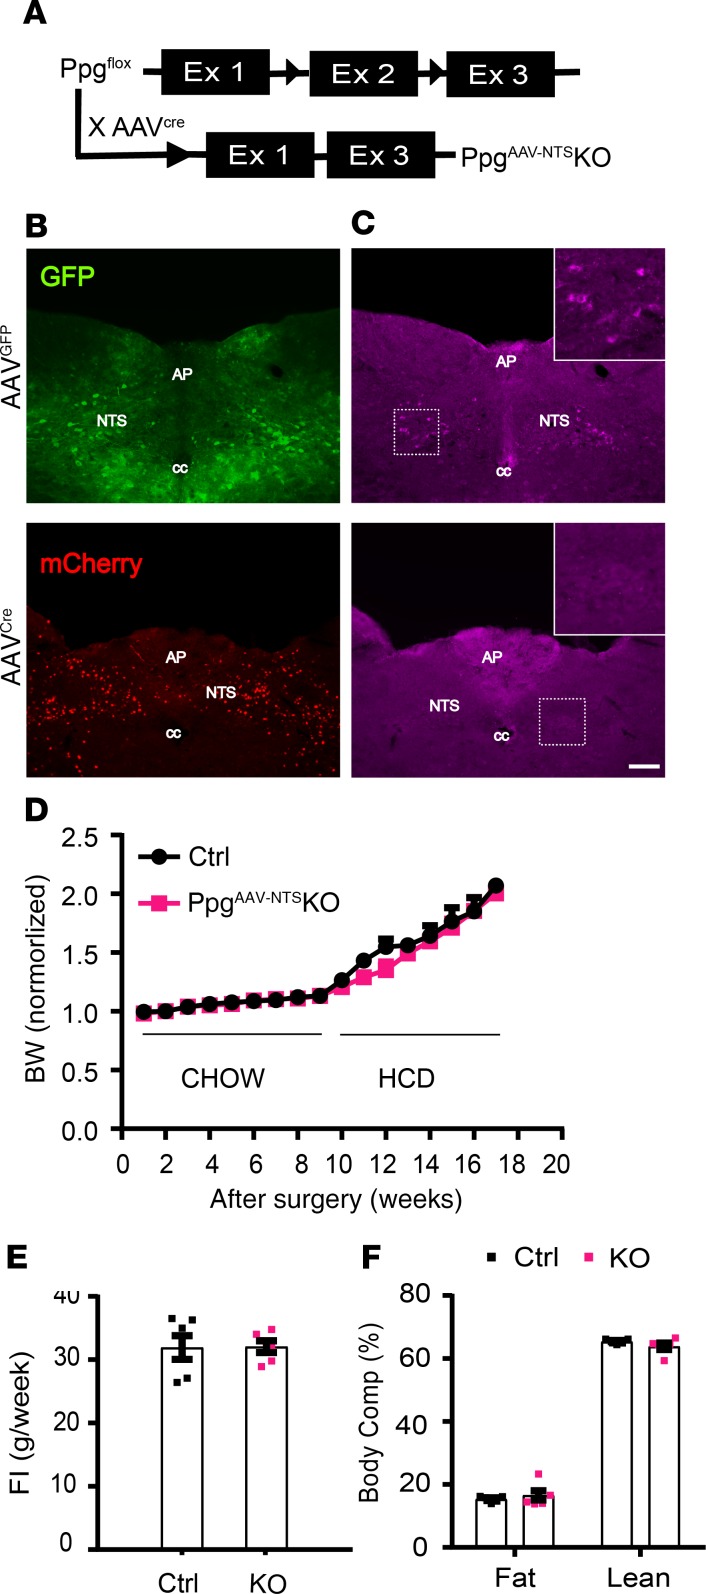
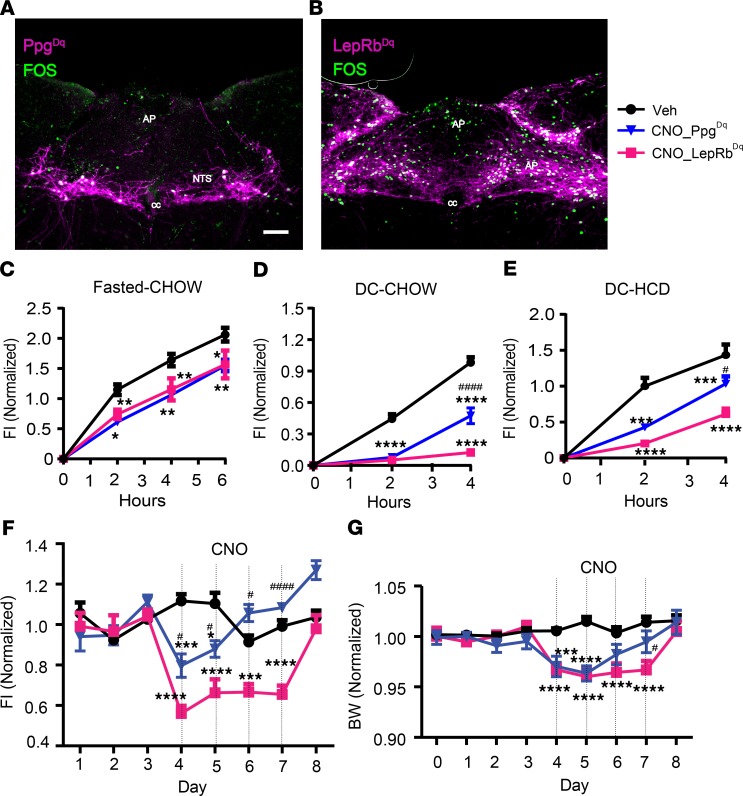
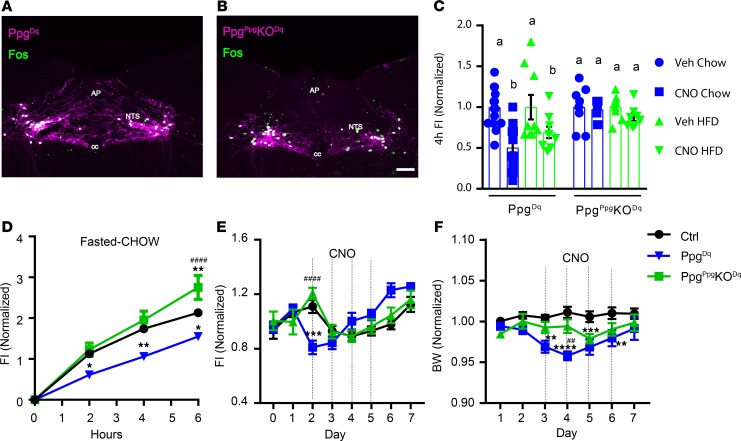
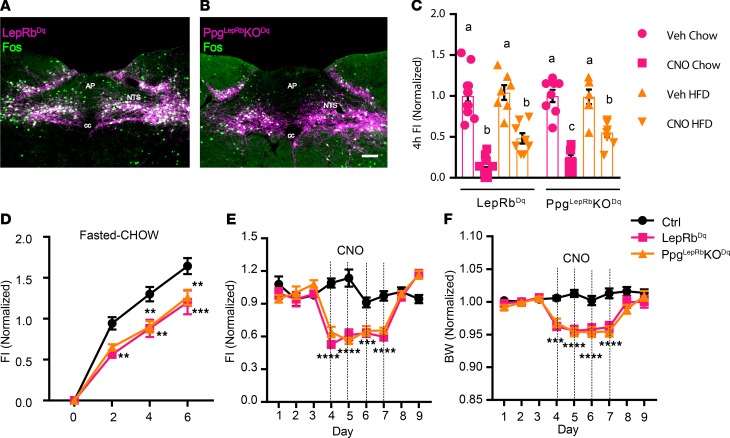
Leptin receptor-expressing (LepRb-expressing) neurons of the nucleus tractus solitarius (NTS; LepRbNTS neurons) receive gut signals that synergize with leptin action to suppress food intake. NTS neurons that express preproglucagon (Ppg) (and that produce the food intake-suppressing PPG cleavage product glucagon-like peptide-1 [GLP1]) represent a subpopulation of mouse LepRbNTS cells. Using Leprcre, Ppgcre, and Ppgfl mouse lines, along with Designer Receptors Exclusively Activated by Designer Drugs (DREADDs), we examined roles for Ppg in GLP1NTS and LepRbNTS cells for the control of food intake and energy balance. We found that the cre-dependent ablation of NTS Ppgfl early in development or in adult mice failed to alter energy balance, suggesting the importance of pathways independent of NTS GLP1 for the long-term control of food intake. Consistently, while activating GLP1NTS cells decreased food intake, LepRbNTS cells elicited larger and more durable effects. Furthermore, while the ablation of NTS Ppgfl blunted the ability of GLP1NTS neurons to suppress food intake during activation, it did not impact the suppression of food intake by LepRbNTS cells. While Ppg/GLP1-mediated neurotransmission plays a central role in the modest appetite-suppressing effects of GLP1NTS cells, additional pathways engaged by LepRbNTS cells dominate for the suppression of food intake.

Keywords: Endocrinology; Leptin; Metabolism; Obesity; Peptides.


Conflict of interest statement

Conflict of interest: CJR is an employee of AstraZenica LLC.

Figures

Figure 1
Figure 1. Colocalization of neuronal markers with LepRbNTS neurons.
(A–D) Representative images showing LepRbNTS neurons (using leptin-induced pSTAT3-IR [A, purple] or GFP-IR in LepRbeGFP mice [B–D, green]) and CCK (GFP-IR in CCKeGFP mice; A, green), PRLH (B, purple), TH (C, purple), and choline acetyltransferase (ChAT, D, purple). (E) Representative image showing colocalization of NTS GLP1-IR (purple) with LepRb (mCherry-IR in AAVFlex-mCherry transduced Leprcre mice, green). All panels are representative of n ≥ 3 similar images. (F–H) LepRbeGFP mice were fasted overnight (F) or fasted overnight and then re-fed for 2 hours (G) before perfusion for the detection of LepRb (GFP, green) and FOS (purple). F and G show representative images (from n = 3 cases). (H) Colocalization of LepRb and FOS is shown. Data are shown as mean ± SEM; P value by unpaired 2-tailed t test is shown. AP, area postrema; cc, central canal. Scale bars: 150 μm.
Figure 2
Figure 2. Ablation of Ppg in LepRbNTS and GLP1NTS neurons.
(A) Schematic diagram showing the cross of Ppgfl with Leprcre and Ppgcre mice to generate PpgLepRbKO and PpgGLP1-NTSKO (PpgppgKO) mice. (B–D) Representative images showing GLP1-IR (purple) in WT (B), PpgLepRbKO (C), and PpgppgKO mice (D). All panels are representative of n ≥ 3 similar images. (E–J) Body weight (measurements for each animal are normalized to its own baseline weight) (E and H), food intake (FI) from the 12th week of age (F and I), and body composition at approximately 16 weeks of age (G and J) are shown for PpgLepRbKO and PpgppgKO mice (data are from both sexes; data for each sex separately are shown in Supplemental Figure 1, A–H). Data are shown as mean ± SEM; n = 11–19 (E), n = 6 (G and F), n = 7 (H–J). All comparisons not significant using 2-way ANOVA with Sidak’s multiple comparisons test (E and H) or unpaired 2-tailed t test (F, G, I, and J). AP, area postrema; cc, central canal. Scale bars: 150 μm.
Figure 3
Figure 3. Viral-mediated Ppg KO in the NTS.
(A) Schematic diagram showing deletion of NTS Ppg by delivering mCherry-tagged AAVcre (AAVcre-mCherry) into the NTS of Ppgfl mice. (B and C) Representative images of GFP-IR in mice injected with AAVGFP (top panel, green) or mCherry-IR in AAVcre-mCherry (bottom panel, red) (B); GLP1-IR (purple) for similar mice is shown in C. All panels are representative of n ≥ 10 similar images. (D) Weekly body weight change on chow and HFD (measurements for each animal were normalized to its baseline weight). (E and F) Food intake is shown for the 8th week after surgery (E), and body composition is shown for 2 months after surgery (F). Data are from male animals; female body weight data are shown in Supplemental Figure 1I. Data are shown as mean ± SEM; D (n = 11–13), E (n = 6) and F (n = 5). All comparisons, P > 0.05 using repeated measures 2-way ANOVA with Sidak’s multiple comparisons test (D) and 2-tailed unpaired t test (E and F). AP, area postrema; cc, central canal. Scale bar: 150 μm.
Figure 4
Figure 4. Activation of LepRbNTS or GLP1NTS neurons suppressed food intake and body weight.
(A and B) Representative images of DREADD-hM3Dq-mCherry (purple) and FOS-IR (green) in CNO-treated (1 mg/kg i.p., 2 hours) Ppgcre (A) and Leprcre (B) mice subjected to the injection of AAVhM3Dq into the GLP1NTS-Dq (PpgDq) and LepRbNTS-Dq (LepRbDq) mice, respectively. All panels are representative of n ≥ 3 similar images. AP, area postrema; cc, central canal. Scale bar: 150 μm. (C–E) Food intake following vehicle (Veh) or CNO (1 mg/kg i.p.) treatment of PpgDq and LepRbDq mice during refeeding following a fast (C; n = 5 and 8 in PpgDq and LepRbDq groups, respectively) or at the onset of the dark cycle (DC) on normal chow (D, n = 13 and 20 in PpgDq and LepRbDq groups, respectively) or HFD (E, n = 6 and 5 PpgDq and LepRbDq groups, respectively). (F and G) Daily food intake (F) and body weight relative to baseline (G) (n = 5–6 [F], 11–13 [G] in PpgDq and LepRbDq groups, respectively) during multiday treatment with CNO (1 mg/kg, i.p., bid). Data are from both sexes; for data separated by sex, see Supplemental Figure 1, J–N. Data are shown as mean ± SEM. Two-way ANOVA with Tukey’s multiple comparisons test was performed for each time point in each panel; *P < 0.05, **P < 0.01, ***P < 0.001, ****P < 0.0001 for CNO groups compared with vehicle. #P < 0.05, ####P < 0.0001 for comparisons between CNO groups. Scale bar: 150 μm.
Figure 5
Figure 5. GLP1NTS neurons require Ppg to mediate the suppression of food intake.
Representative images of DREADD-hM3Dq-mCherry (purple) and FOS-IR (green) in CNO-treated (1 mg/kg i.p., 2 hours) Ppgcre (A) and PpgGLP1-NTSKO (PpgPpgKO) (B) mice subjected to the injection of AAVhM3Dq into the NTS (Ppg-Dq and PpgPpgKO-Dq mice, respectively). All panels are representative of n ≥ 3 similar images. AP, area postrema; cc, central canal. Scale bars: 150 μm. (C) Food intake in Ppg-Dq and PpgPpgKO-Dq mice during the first 4 hours of the dark cycle with chow or HFD, as indicated; n = 19 (chow) or 9 (HFD) in Ppg-Dq and n = 8 (both chow and HFD) in PpgPpgKO-Dq groups. (D) Food intake in vehicle-treated (Veh-treated) or CNO-treated (1 mg/kg i.p.) Ppg-Dq and PpgPpgKO-Dq mice following an overnight fast; n = 13, 5, and 8 in Veh, Ppg-Dq, and PpgPpgKO-Dq groups, respectively. (E and F) Daily food intake (E) and body weight (F) relative to baseline during multiday treatment with CNO (1 mg/kg, i.p., bid); n = 10, 8, and 8 in Veh, Ppg-Dq, and PpgPpgKO-Dq groups, respectively. Data are from both sexes; for data separated by sex, see Supplemental Figure 2, A–D. Data are shown as mean ± SEM. Two-way ANOVA with Sidak’s multiple comparisons test was performed for chow and HCD conditions (separately) in C. Two-way ANOVA with Tukey’s multiple comparisons test was performed for D–F. Different letters indicate difference (P < 0.05) in C. (D–F) *P < 0.05, **P < 0.01, ***P < 0.001, ****P < 0.0001 versus Veh. ##P < 0.01, ####P < 0.0001 for Ppg-Dq versus PpgPpgKO-Dq.
Figure 6
Figure 6. NTS Ppg is not required for the suppression of food intake by LepRbNTS neurons.
Representative images of DREADD-hM3Dq-mCherry (purple) and FOS-IR (green) in CNO-treated (1 mg/kg i.p., 2 hours) Leprcre (A) and PpgLepRbKO (B) mice subjected to the injection of AAVhM3Dq into the NTS (LepRbNTS-Dq and PpgLepRbKO-Dq mice, respectively). All panels are representative of n ≥ 3 similar images. AP, area postrema; cc, central canal. Scale bars: 150 μm. (C) Food intake in LepRbNTS-Dq and PpgLepRbKO-Dq mice during the first 4 hours of the dark cycle with Chow or HFD, as indicated; n = 14 (chow) or 8 (HFD) in Ppg-Dq groups, n = 8 (both chow and HFD) in PpgLepRbKO-Dq groups. (D) Food intake in vehicle-treated (Veh-treated) or CNO-treated (1 mg/kg i.p.) LepRbNTS-Dq and PpgLepRbKO-Dq mice following an overnight fast; n = 7, 11, and 8 in Veh, LepRbNTS-Dq, and PpgLepRbKO-Dq groups, respectively. (E and F) Daily food intake (E) and body weight relative to baseline (F) during multiday treatment with CNO (1 mg/kg, i.p., bid); n = 12, 13, and 9 in Veh, LepRbNTS-Dq, and PpgLepRbKO-Dq groups, respectively. Data are from both sexes; for data separated by sex, see Supplemental Figure 2, E–H. Data are shown as mean ± SEM. Two-way ANOVA with Sidak’s multiple comparisons was performed for chow and HCD conditions (separately) in C. Two-way ANOVA analysis with Tukey’s multiple comparisons test was performed for D–F. Different letters indicate difference (P < 0.05) in C. (D–F) **P < 0.01, ***P < 0.001, ****P < 0.0001 versus Veh.

References

    1. Schwartz GJ. Integrative capacity of the caudal brainstem in the control of food intake. Philos Trans R Soc Lond, B, Biol Sci. 2006;361(1471):1275–1280. doi: 10.1098/rstb.2006.1862. - DOI - PMC - PubMed
    1. Grill HJ, Hayes MR. The nucleus tractus solitarius: a portal for visceral afferent signal processing, energy status assessment and integration of their combined effects on food intake. Int J Obes (Lond) 2009;33(Suppl_1):S11–S15. - PubMed
    1. Berthoud HR. Interactions between the “cognitive” and “metabolic” brain in the control of food intake. Physiol Behav. 2007;91(5):486–498. doi: 10.1016/j.physbeh.2006.12.016. - DOI - PubMed
    1. Huo L, Maeng L, Bjørbaek C, Grill HJ. Leptin and the control of food intake: neurons in the nucleus of the solitary tract are activated by both gastric distension and leptin. Endocrinology. 2007;148(5):2189–2197. doi: 10.1210/en.2006-1572. - DOI - PubMed
    1. Morton GJ, et al. Leptin action in the forebrain regulates the hindbrain response to satiety signals. J Clin Invest. 2005;115(3):703–710. doi: 10.1172/JCI22081. - DOI - PMC - PubMed

Publication types