. 2020 Jul 1;130(7):3467-3482.
doi: 10.1172/JCI129401.

Bile acid metabolism is altered in multiple sclerosis and supplementation ameliorates neuroinflammation

Affiliations

Bile acid metabolism is altered in multiple sclerosis and supplementation ameliorates neuroinflammation

Pavan Bhargava et al. J Clin Invest. .

Abstract

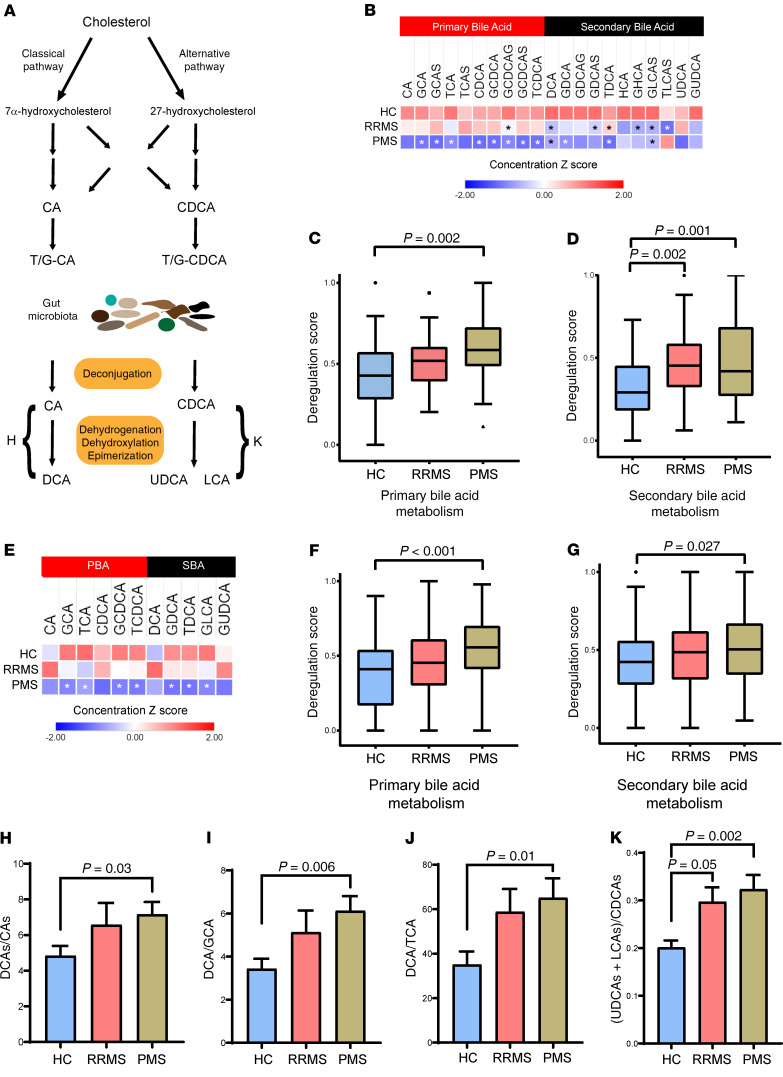
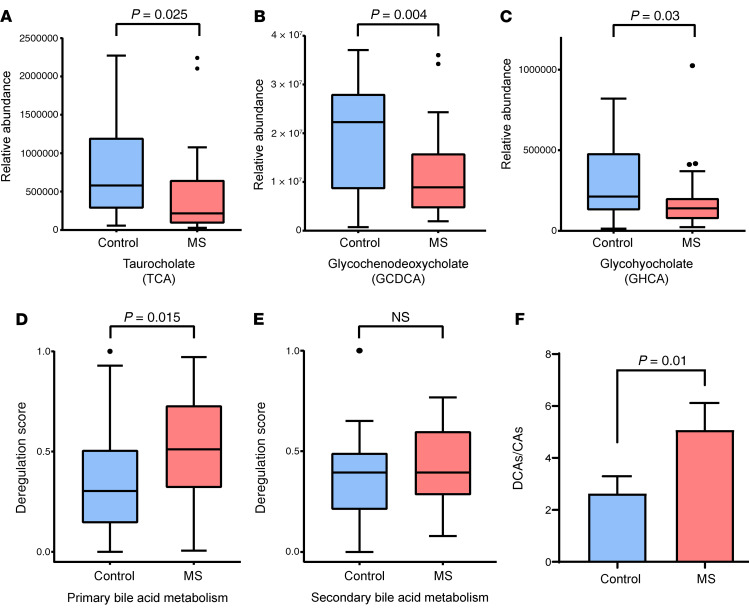
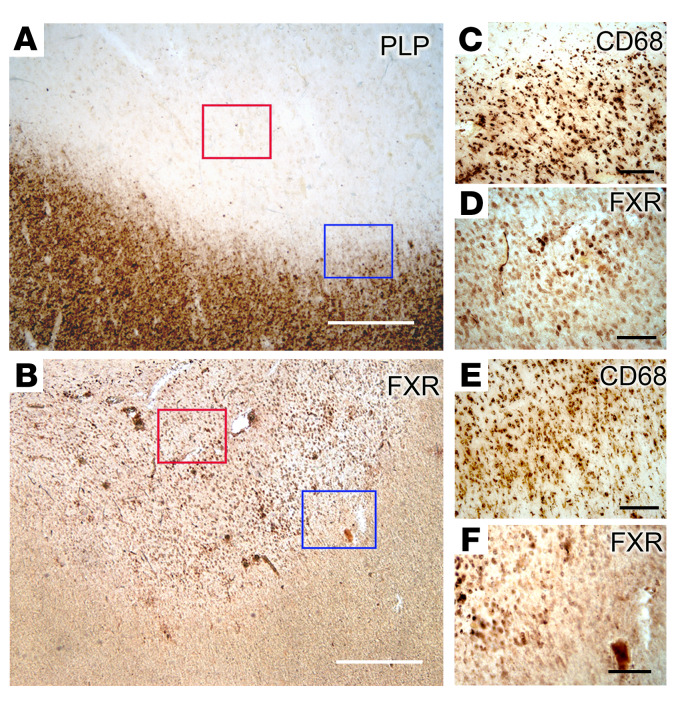
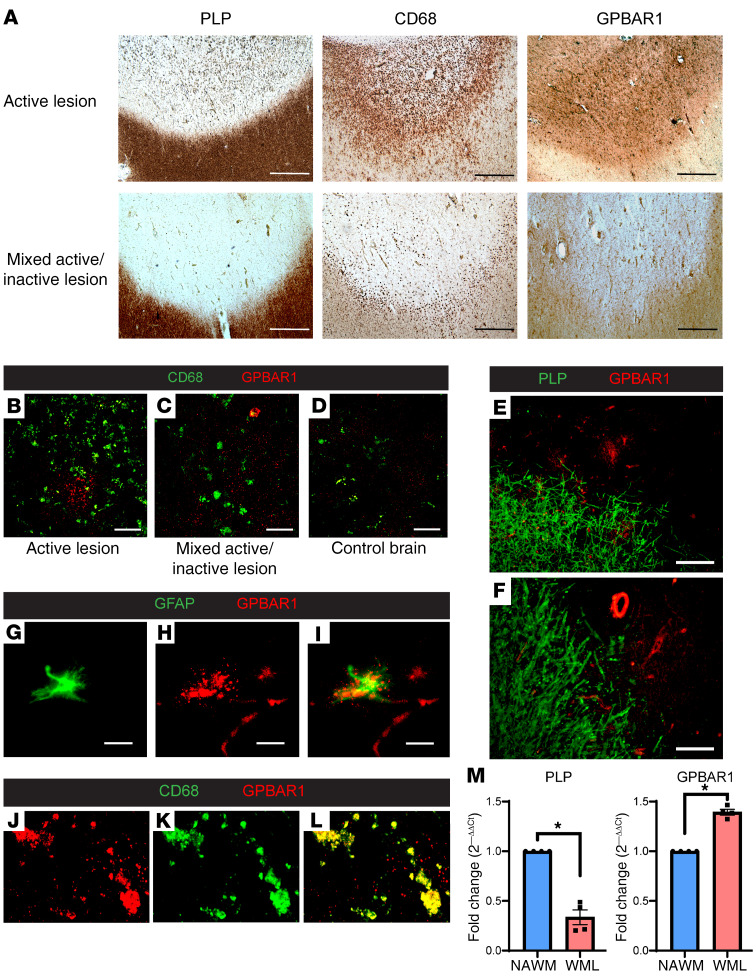
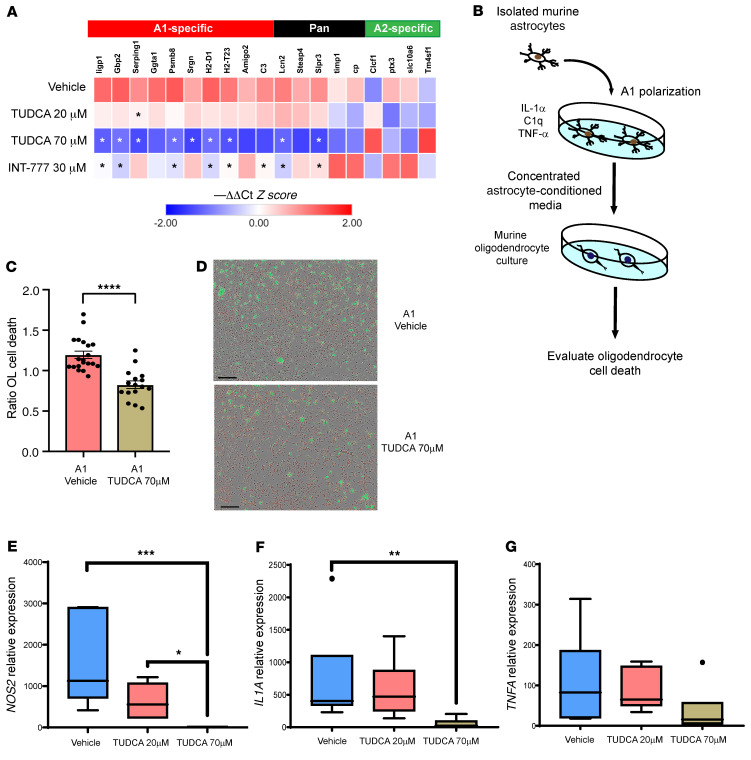
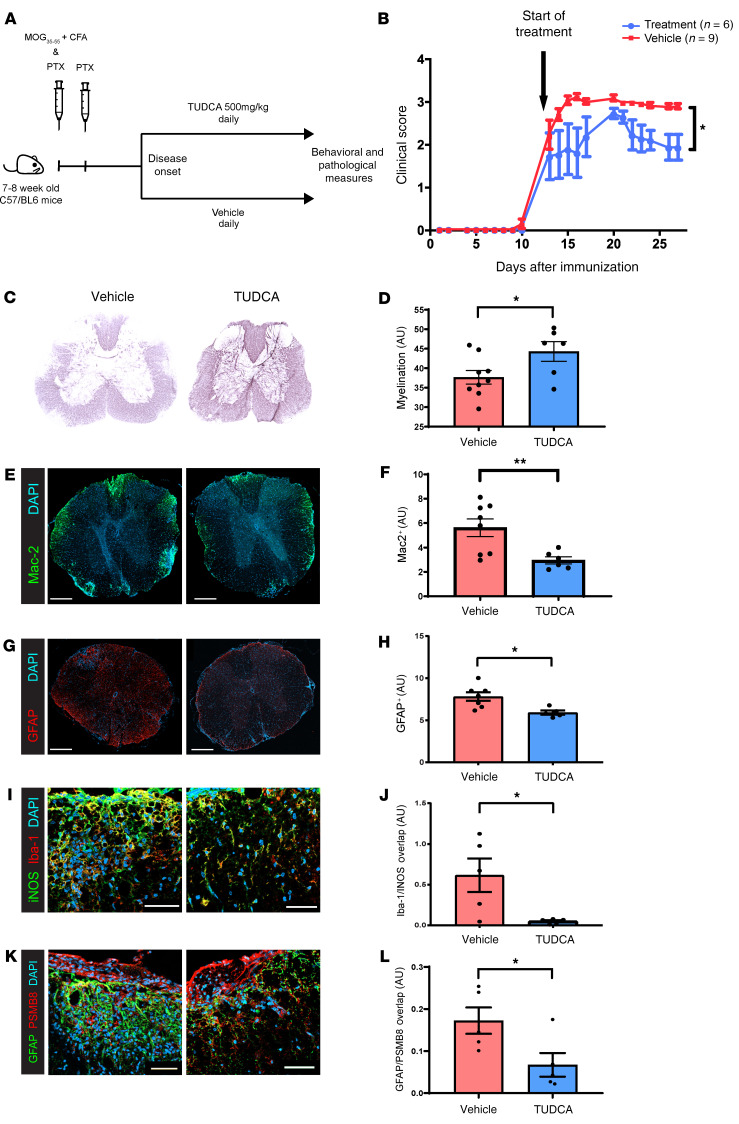
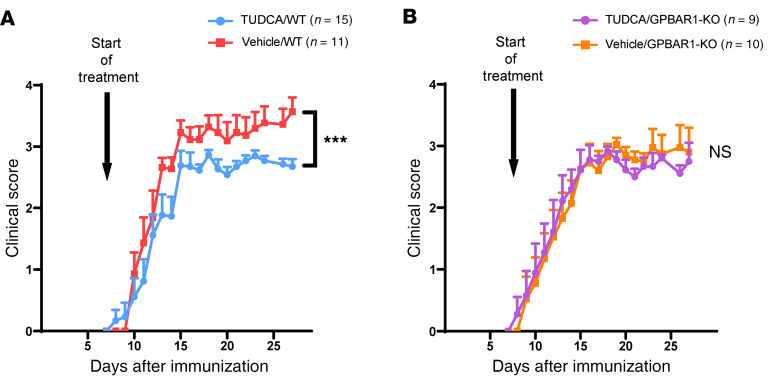
Multiple sclerosis (MS) is an inflammatory demyelinating disorder of the CNS. Bile acids are cholesterol metabolites that can signal through receptors on cells throughout the body, including in the CNS and the immune system. Whether bile acid metabolism is abnormal in MS is unknown. Using global and targeted metabolomic profiling, we identified lower levels of circulating bile acid metabolites in multiple cohorts of adult and pediatric patients with MS compared with controls. In white matter lesions from MS brain tissue, we noted the presence of bile acid receptors on immune and glial cells. To mechanistically examine the implications of lower levels of bile acids in MS, we studied the in vitro effects of an endogenous bile acid, tauroursodeoxycholic acid (TUDCA), on astrocyte and microglial polarization. TUDCA prevented neurotoxic (A1) polarization of astrocytes and proinflammatory polarization of microglia in a dose-dependent manner. TUDCA supplementation in experimental autoimmune encephalomyelitis reduced the severity of disease through its effects on G protein-coupled bile acid receptor 1 (GPBAR1). We demonstrate that bile acid metabolism was altered in MS and that bile acid supplementation prevented polarization of astrocytes and microglia to neurotoxic phenotypes and ameliorated neuropathology in an animal model of MS. These findings identify dysregulated bile acid metabolism as a potential therapeutic target in MS.

Keywords: Metabolism; Multiple sclerosis; Neurodegeneration; Neuroscience.


Conflict of interest statement

Conflict of interest: PB has received honoraria from Sanofi Genzyme, and GSK and has received research funding from EMD Serono and Amylyx Pharmaceuticals. EMM has received research support from Biogen, Genzyme, Teva Pharmaceutical Industries, and Sun Pharma. EW has received personal compensation from the American Academy of Neurology (AAN), the Corpus, and research support from Roche, Biogen Idec, and Novartis. PAC has received personal compensation from Biogen and Disarm Therapeutics, as well as research support from Annexon Biosciences, Biogen, MedImmune, and Novartis.

Figures

Figure 1
Figure 1. Bile acid metabolism is altered in MS.
(A) Overview of bile acid metabolism. (B) Heatmap of mean standardized bile acid metabolite concentrations derived from untargeted metabolomic profiling in the discovery cohort consisting of patients with RRMS (n = 56), patients with PMS (n = 52), and HCs (n = 50). Multiple bile acid metabolites in both primary and secondary bile acid metabolism pathways were lower in the MS groups compared with controls. Asterisks denote significant differences compared with HCs based on multivariate linear regression models adjusted for age, sex, and race (P < 0.05). (C) Box plots of pathway deregulation scores for primary bile acid metabolism in the discovery cohort demonstrated significant abnormality in the PMS group compared with controls. For all box plots, the center line indicates the median, the box indicates the 25th and 75th percentiles, the whiskers indicate 1.5 × IQR, and the dots indicate outliers. (D) Box plots of pathway deregulation scores for secondary bile acid metabolism in the discovery cohort show significant abnormality in the RRMS and PMS groups compared with the control group. P values for C and D were derived from multivariate linear regression models adjusted for age, sex, and race. (E) Heatmap of mean standardized bile acid metabolite concentrations derived from targeted metabolomic profiling in the validation cohort consisting of patients with RRMS (n = 50), patients with PMS (n = 125), and HCs (n = 75). Multiple bile acid metabolites in both primary and secondary bile acid metabolism pathways were lower in the MS groups compared with the control group. Asterisks denote significant differences as in B. (F) Box plots of pathway deregulation scores for primary bile acid metabolism in the validation cohort demonstrate significant abnormality in the PMS group compared with controls. (G) Box plots of pathway deregulation scores for secondary bile acid metabolism in the validation cohort show significant abnormality in the PMS group compared with controls. P values in F and G were derived as in C and D. (H) An increase in the DCA (sum of all DCA metabolites) to CA (sum of all CA metabolites) metabolite ratio was noted in the PMS group compared with the control group. The ratios of DCA to individual conjugated CA metabolites were also higher in the PMS group (I and J). (K) The ratio of the sum of UDCA and LCA metabolites to the sum of CDCA metabolites was higher in the PMS group compared with the control group. Data in HK represent the mean ± SEM, and P values were determined using a linear regression model.
Figure 2
Figure 2. Bile acid metabolism is altered in pediatric-onset MS.
(AC) Box plots of individual bile acid metabolites in the pediatric-onset MS and control groups (n = 31 each), demonstrating lower metabolite levels in the MS group. (D) Box plots of pathway deregulation scores for primary bile acid metabolism in patients with pediatric-onset MS and controls, demonstrating significant abnormality in the metabolic pathway in the pediatric MS group. (E) Box plots of pathway deregulation scores for secondary bile acid metabolism in patients with pediatric-onset MS and controls. (F) An increase in the ratio of DCA (sum of all DCA metabolites) to CA (sum of all CA metabolites) metabolites was noted in the MS group. For all box plots, the center line indicates the median, the box indicates the 25th and 75th percentiles, the whiskers indicate 1.5 × IQR, and the dots represent outliers. The P values for AE were derived from multivariate linear regression models adjusted for age, sex, and race. In F, error bars represent the SEM, and the P value was determined using a 2-tailed, unpaired Student’s t test.
Figure 3
Figure 3. The FXR, a nuclear bile acid receptor, is detected in demyelinating lesions in PMS brains.
(A) Immunohistochemistry for PLP identified a WML in an MS brain. (B) Numerous FXR+ cells were detected within the lesion. (C) CD68 staining showed numerous CD68+ macrophages within the center of the lesion (red boxes from A and B), consistent with an active lesion. (D) Numerous FXR+ cells were detected within the center of the lesion, corresponding to the CD68+ macrophages. (E) Several CD68+ cells were also noted at the edge of the lesion (blue boxes from A and B). (F) Numerous FXR+ cells were also observed within the edge of the lesion shown in E. Scale bars: 500 μm (A and B); 100 μm (CF).
Figure 4
Figure 4. The cell-surface bile acid receptor GPBAR1 is detected in demyelinating lesions in PMS brains.
(A) Immunohistochemistry for PLP and CD68 identified an active and a mixed active/inactive MS WML, with GPBAR1+ cells detected within both of these lesions. Comparison of GPBAR1 staining (red) in an active lesion (B), a mixed active/inactive lesion (C), and control brain (D) revealed increased staining in MS lesions compared with control white matter. Double immunostaining for PLP (green) and GPBAR1 (red) shows the presence of GPBAR1+ cells (E) and vessels (F) in areas of demyelination. (GI) Double immunostaining using GFAP (green) and GPBAR1 (red) demonstrates GPBAR1 staining in GFAP+ astrocytes in MS lesions. (JL) Double immunostaining with CD68 (green) and GPBAR1 (red) demonstrates GPBAR1 staining in CD68+ macrophages in MS lesions. (M) Comparison of PLP and GPBAR1 gene expression in MS WML and NAWM revealed decreased PLP expression within the lesions with increased expression of GPBAR1, similar to findings noted on immunohistochemistry (n = 4 in each group). Scale bars: 200 μm (A); 100 μm (BF); 20 μm (GI). *P < 0.05, by 2-tailed Mann-Whitney U test. Data in M represent the mean ± SEM.
Figure 5
Figure 5. Endogenous bile acid blocks the neurotoxic polarization of astrocytes and proinflammatory polarization of microglia.
(A) Astrocytes were isolated from neonatal mouse brains using ACSA2 bead selection and were polarized to an inflammatory phenotype using a cocktail of IL-1α, TNF-α, and C1q for 24 hours in the presence or absence of TUDCA or the GPBAR1 agonist INT-777. qPCR of genes associated with various astrocyte phenotypes revealed that expression of multiple A1-specific genes was significantly downregulated in the 70-μM TUDCA condition compared with vehicle. Downregulation of several A1-specific genes with INT-777 treatment was also noted, but to a lesser degree than with 70-μM TUDCA . Data were derived from 3 independent experiments with 6 biological replicates. Groups were compared using a Kruskal-Wallis test with Dunn’s multiple comparisons test, and asterisks represent P < 0.05. (B) Schema showing concentration of ACM from A0 (nonpolarized), A1 plus vehicle, and A1 plus 70-μM TUDCA conditions and testing of the effects on viability of murine oligodendrocytes over a 24-hour period. (C) Oligodendrocyte (OL) cell death was reduced with 70-μM TUDCA ACM compared with vehicle (normalized to cell death from A0 ACM). Data were derived from 3 independent biological replicates and represent the mean ± SEM. ****P < 0.001, by unpaired, 2-tailed Student’s t test. (D) Representative images reveal oligodendrocyte death. ACM from the 2 conditions showed greater cell death (green) in the vehicle-treated condition than in the 70-μM TUDCA–treated condition. Scale bars: 200 μm. (E) Microglia were isolated from neonatal mouse brains using CD11b bead selection and polarized to an inflammatory M1 phenotype by treatment with LPS and IFN-γ in the presence or absence of differing doses of TUDCA. RNA was then isolated to determine the expression of the NOS2 gene, which is a marker of M1 polarization, and showed reduced expression of the gene under TUDCA-treated conditions compared with vehicle. Gene expression levels were also compared for IL1A (F) and TNFA (G), which are factors produced by microglia critical for A1 polarization, under the different treatment conditions. Expression of IL1A was significantly reduced, with a similar trend for TNFA, under the 70-μM TUDCA condition compared with vehicle. Data in EG were derived from 4 independent experiments with 6 biological replicates. *P < 0.05, **P < 0.01, and ***P < 0.005, by 1-way ANOVA with Dunnett’s test for multiple comparisons. For the box plots in EG, the center line indicates the median, the boxes indicate the 25th and 75th percentiles, the whiskers indicate 1.5 × IQR, and the dots indicate outliers.
Figure 6
Figure 6. TUDCA supplementation ameliorates EAE.
(A) Eight- to 9-week-old female C57/BL6 mice were subcutaneously immunized with MOG35–55 and CFA in addition to intraperitoneal injection of pertussis toxin (PTX) on day 0 and day 2. Mice were then monitored for signs of EAE and, at disease onset, were randomized to oral gavage with either TUDCA or vehicle until day 28 after immunization. (B) Behavioral scores demonstrate that TUDCA treatment resulted in reduced severity of EAE disease. Data were derived from a representative experiment of 1 of 3 independent experiments and represent the mean ± SEM. *P < 0.05, by Mann-Whitney U test. (C and D) Representative images of Black-gold staining of spinal cords of mice with EAE treated with either TUDCA or vehicle show reduced demyelination with TUDCA treatment. Quantification is shown in the plot in D. (E and F) Immunostaining for infiltrating myeloid cells (Mac-2+) demonstrated reduced infiltration in the TUDCA-treated group compared with the control. Quantification is shown in the plot in F. (G and H) Staining for GFAP showed reduced astrocytosis in the TUDCA-treated group compared with the control. This is quantified in the plot in H. (I and J) Staining for Iba-1 and iNOS shows a decrease in INOS+Iba-1+ cells (M1 macrophages/microglia) in the TUDCA-treated group compared with the control. Quantification is shown in the plot in J. (K and L) Images show a reduced number of PSMβ8+GFAP+ cells (neurotoxic A1 astrocytes) in the TUDCA-treated group compared with the control. This is quantified in the plot in L. Scale bars: 200 μm (E and G); 50 μm (I and K). *P < 0.05 and **P < 0.005, by unpaired, 2-tailed Student’s t test (D, F, H, J, and L). Data represent the mean ± SEM (D, F, H, J, and L).
Figure 7
Figure 7. Therapeutic effect of TUDCA supplementation in EAE is dependent on GPBAR1.
Nine- to 11-week-old female WT or GPBAR1-KO C57/BL6 mice were subcutaneously immunized with MOG35–55 and CFA in addition to intraperitoneal injection of PTX on day 0 and day 2. Mice were then monitored for signs of EAE, and at disease onset, the mice were randomized to oral gavage with either 500 mg/kg TUDCA or vehicle until day 28 after immunization. (A) Behavioral scores showed that TUDCA treatment resulted in reduced severity of EAE in WT mice. (B) No significant difference was noted in EAE severity between the 2 treatment groups in GPBAR1-KO mice. Individual data points are shown along with the mean ± SEM. Data were derived from 2 independent experiments. ***P < 0.001, by Mann-Whitney U test.

References

    1. Reich DS, Lucchinetti CF, Calabresi PA. Multiple sclerosis. N Engl J Med. 2018;378(2):169–180. doi: 10.1056/NEJMra1401483. - DOI - PMC - PubMed
    1. Isobe N, et al. An ImmunoChip study of multiple sclerosis risk in African Americans. Brain. 2015;138(Pt 6):1518–1530. - PMC - PubMed
    1. International Multiple Sclerosis Genetics Consortium (IMSGC) et al. Evidence for polygenic susceptibility to multiple sclerosis--the shape of things to come. Am J Hum Genet. 2010;86(4):621–625. doi: 10.1016/j.ajhg.2010.02.027. - DOI - PMC - PubMed
    1. Ascherio A, et al. Vitamin D as an early predictor of multiple sclerosis activity and progression. JAMA Neurol. 2014;71(3):306–314. doi: 10.1001/jamaneurol.2013.5993. - DOI - PMC - PubMed
    1. Bhargava P, Calabresi PA. Metabolomics in multiple sclerosis. Mult Scler. 2016;22(4):451–460. doi: 10.1177/1352458515622827. - DOI - PubMed

Publication types