

Comparative Study
doi: 10.1056/NEJMc2004973.
Epub 2020 Mar 17.
Aerosol and Surface Stability of SARS-CoV-2 as Compared with SARS-CoV-1
Affiliations
- PMID: 32182409
- PMCID: PMC7121658
- DOI: 10.1056/NEJMc2004973
Item in Clipboard
Comparative Study
Aerosol and Surface Stability of SARS-CoV-2 as Compared with SARS-CoV-1
N Engl J Med.
.
No abstract available
Figures
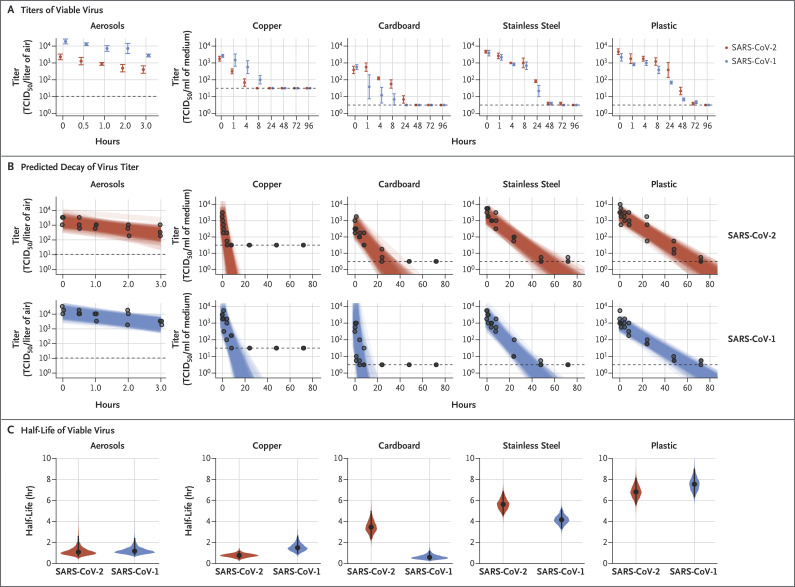
As shown in Panel A, the titer of aerosolized viable virus is expressed in 50% tissue-culture infectious dose (TCID50) per liter of air. Viruses were applied to copper, cardboard, stainless steel, and plastic maintained at 21 to 23°C and 40% relative humidity over 7 days. The titer of viable virus is expressed as TCID50 per milliliter of collection medium. All samples were quantified by end-point titration on Vero E6 cells. Plots show the means and standard errors ( bars) across three replicates. As shown in Panel B, regression plots indicate the predicted decay of virus titer over time; the titer is plotted on a logarithmic scale. Points show measured titers and are slightly jittered (i.e., their horizontal positions are modified by a small random amount to reduce overlap) along the time axis to avoid overplotting. Lines are random draws from the joint posterior distribution of the exponential decay rate (negative of the slope) and intercept (initial virus titer) to show the range of possible decay patterns for each experimental condition. There were 150 lines per panel, including 50 lines from each plotted replicate. As shown in Panel C, violin plots indicate posterior distribution for the half-life of viable virus based on the estimated exponential decay rates of the virus titer. The dots indicate the posterior median estimates, and the black lines indicate a 95% credible interval. Experimental conditions are ordered according to the posterior median half-life of SARS-CoV-2. The dashed lines indicate the limit of detection, which was 3.33×100.5 TCID50 per liter of air for aerosols, 100.5 TCID50 per milliliter of medium for plastic, steel, and cardboard, and 101.5 TCID50 per milliliter of medium for copper.
Update of
-
Aerosol and surface stability of HCoV-19 (SARS-CoV-2) compared to SARS-CoV-1.medRxiv [Preprint]. 2020 Mar 13:2020.03.09.20033217. doi: 10.1101/2020.03.09.20033217. medRxiv. 2020. Update in: N Engl J Med. 2020 Apr 16;382(16):1564-1567. doi: 10.1056/NEJMc2004973. PMID: 32511427 Free PMC article. Updated. Preprint. No abstract available.
Comment in
-
Stability and Viability of SARS-CoV-2.N Engl J Med. 2020 May 14;382(20):1962-1963. doi: 10.1056/NEJMc2007942. Epub 2020 Apr 13. N Engl J Med. 2020. PMID: 32283575 Free PMC article. No abstract available.
-
Stability and Viability of SARS-CoV-2.N Engl J Med. 2020 May 14;382(20):1963. doi: 10.1056/NEJMc2007942. Epub 2020 Apr 13. N Engl J Med. 2020. PMID: 32283576 No abstract available.
-
Stability and Viability of SARS-CoV-2.N Engl J Med. 2020 May 14;382(20):1963-1964. doi: 10.1056/NEJMc2007942. Epub 2020 Apr 13. N Engl J Med. 2020. PMID: 32283577 No abstract available.
-
Stability and Viability of SARS-CoV-2.N Engl J Med. 2020 May 14;382(20):1964. doi: 10.1056/NEJMc2007942. Epub 2020 Apr 13. N Engl J Med. 2020. PMID: 32283578 No abstract available.
-
Stability and Viability of SARS-CoV-2.N Engl J Med. 2020 May 14;382(20):1964-1965. doi: 10.1056/NEJMc2007942. Epub 2020 Apr 13. N Engl J Med. 2020. PMID: 32283579 No abstract available.
-
Minimally Invasive Surgery at the Time of COVID-19: The OR Staff Needs Protection.J Minim Invasive Gynecol. 2020 Jul-Aug;27(5):1221. doi: 10.1016/j.jmig.2020.04.010. Epub 2020 Apr 12. J Minim Invasive Gynecol. 2020. PMID: 32294548 Free PMC article. No abstract available.
-
Airborne Transmission Route of COVID-19: Why 2 Meters/6 Feet of Inter-Personal Distance Could Not Be Enough.Int J Environ Res Public Health. 2020 Apr 23;17(8):2932. doi: 10.3390/ijerph17082932. Int J Environ Res Public Health. 2020. PMID: 32340347 Free PMC article.
-
Putting some context to the aerosolization debate around SARS-CoV-2.J Hosp Infect. 2020 Jun;105(2):381-382. doi: 10.1016/j.jhin.2020.04.040. Epub 2020 Apr 30. J Hosp Infect. 2020. PMID: 32360356 Free PMC article. No abstract available.
-
Slit-lamp evaluation during SARS-CoV-2 pandemic: safety first!Graefes Arch Clin Exp Ophthalmol. 2020 Dec;258(12):2865-2866. doi: 10.1007/s00417-020-04729-1. Epub 2020 May 4. Graefes Arch Clin Exp Ophthalmol. 2020. PMID: 32367288 Free PMC article. No abstract available.
-
COVID-19 pandemic and the stethoscope: Do not forget to sanitize.Heart Lung. 2020 Jul-Aug;49(4):350. doi: 10.1016/j.hrtlng.2020.03.017. Epub 2020 Apr 11. Heart Lung. 2020. PMID: 32402598 Free PMC article. No abstract available.
-
Cash, currency and COVID-19.Postgrad Med J. 2020 Jul;96(1137):427-428. doi: 10.1136/postgradmedj-2020-138006. Epub 2020 May 13. Postgrad Med J. 2020. PMID: 32404495 Free PMC article. No abstract available.
-
COVID-19 pandemic - let's not forget surfaces.J Hosp Infect. 2020 Aug;105(4):790-791. doi: 10.1016/j.jhin.2020.05.022. Epub 2020 May 20. J Hosp Infect. 2020. PMID: 32445775 Free PMC article. No abstract available.
-
Cling film for mobile phones to prevent cross-infection during the COVID-19 pandemic.J Am Acad Dermatol. 2020 Oct;83(4):e285-e287. doi: 10.1016/j.jaad.2020.06.1008. Epub 2020 Jul 2. J Am Acad Dermatol. 2020. PMID: 32622135 Free PMC article. No abstract available.
-
Exaggerated risk of transmission of COVID-19 by fomites.Lancet Infect Dis. 2020 Aug;20(8):892-893. doi: 10.1016/S1473-3099(20)30561-2. Epub 2020 Jul 3. Lancet Infect Dis. 2020. PMID: 32628907 Free PMC article. No abstract available.
-
Stability of SARS-CoV-2 on environmental surfaces and in human excreta.J Hosp Infect. 2021 Jan;107:105-107. doi: 10.1016/j.jhin.2020.10.021. Epub 2020 Nov 1. J Hosp Infect. 2021. PMID: 33137445 Free PMC article. No abstract available.
-
Characterization of handheld disinfectant sprayers for effective surface decontamination to mitigate severe acute respiratory coronavirus virus 2 (SARS-CoV-2) transmission.Infect Control Hosp Epidemiol. 2021 Jul;42(7):901-903. doi: 10.1017/ice.2020.1423. Epub 2021 Jan 13. Infect Control Hosp Epidemiol. 2021. PMID: 33436119 Free PMC article. No abstract available.
-
Indoor air quality and COVID-19.Public Health. 2021 Feb;191:1-2. doi: 10.1016/j.puhe.2020.04.047. Epub 2020 May 7. Public Health. 2021. PMID: 33460881 Free PMC article. No abstract available.
References
-
- Coronavirus disease (COVID-2019) situation reports. Geneva: World Health Organization, 2020. (https://www.who.int/emergencies/diseases/novel-coronavirus-2019/situatio...).
Publication types
MeSH terms
Substances
Grants and funding
LinkOut - more resources
Full Text Sources
Other Literature Sources
Medical
Miscellaneous