. 2020 Mar 13;12(3):667.
doi: 10.3390/cancers12030667.

The Bradykinin-BDKRB1 Axis Regulates Aquaporin 4 Gene Expression and Consequential Migration and Invasion of Malignant Glioblastoma Cells via a Ca2+-MEK1-ERK1/2-NF-κB Mechanism

Affiliations

The Bradykinin-BDKRB1 Axis Regulates Aquaporin 4 Gene Expression and Consequential Migration and Invasion of Malignant Glioblastoma Cells via a Ca2+-MEK1-ERK1/2-NF-κB Mechanism

Ding-Ping Sun et al. Cancers (Basel). .

Abstract

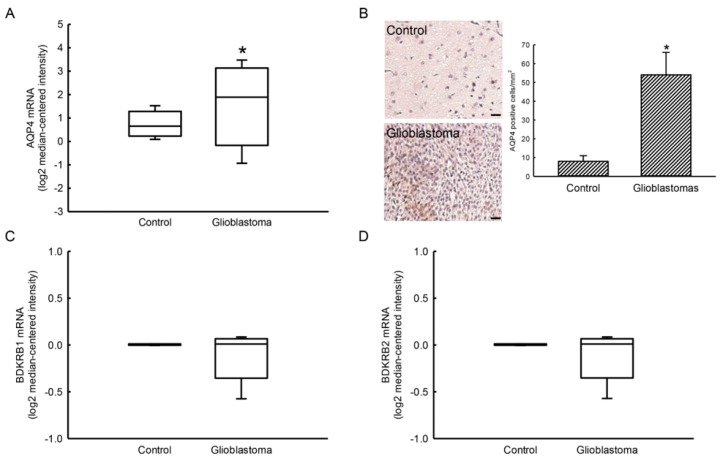
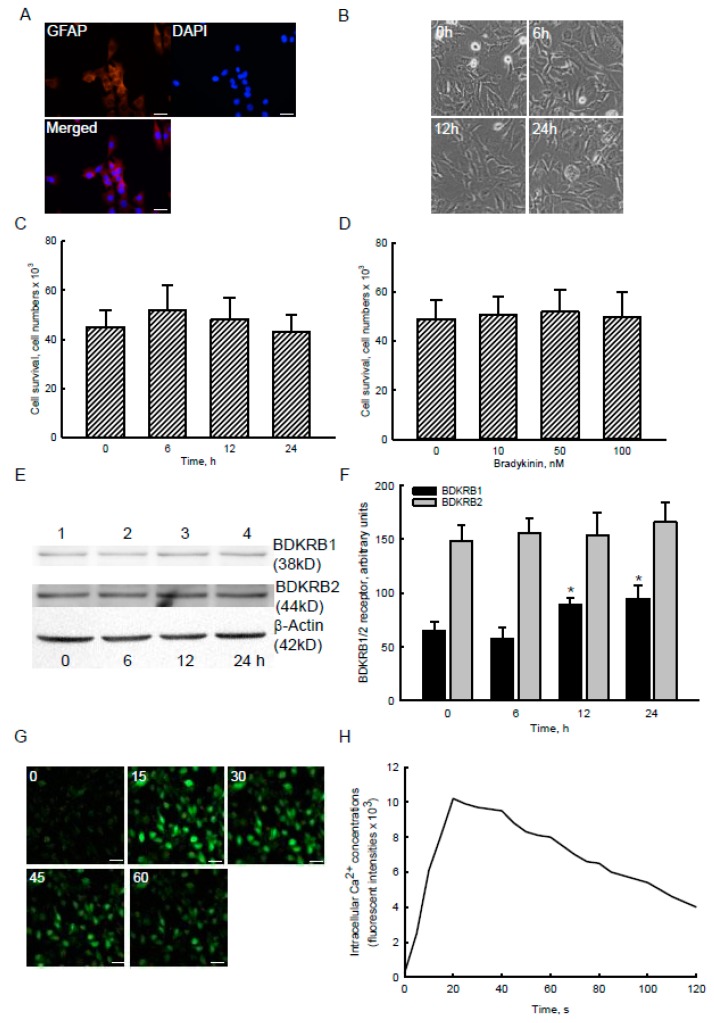
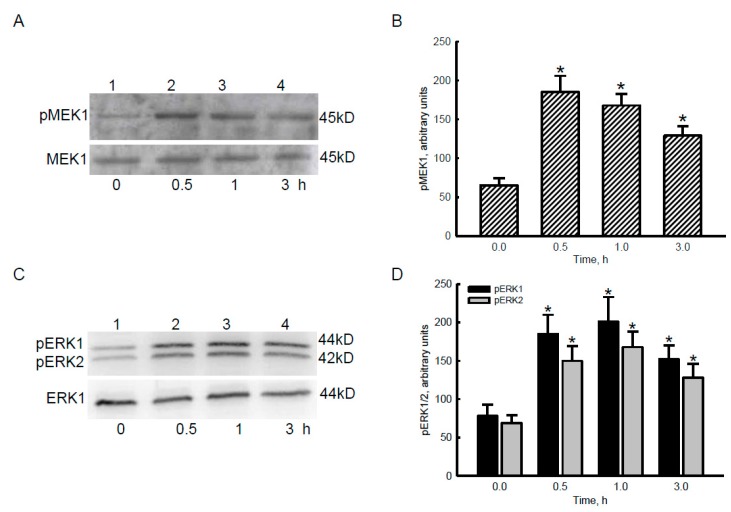
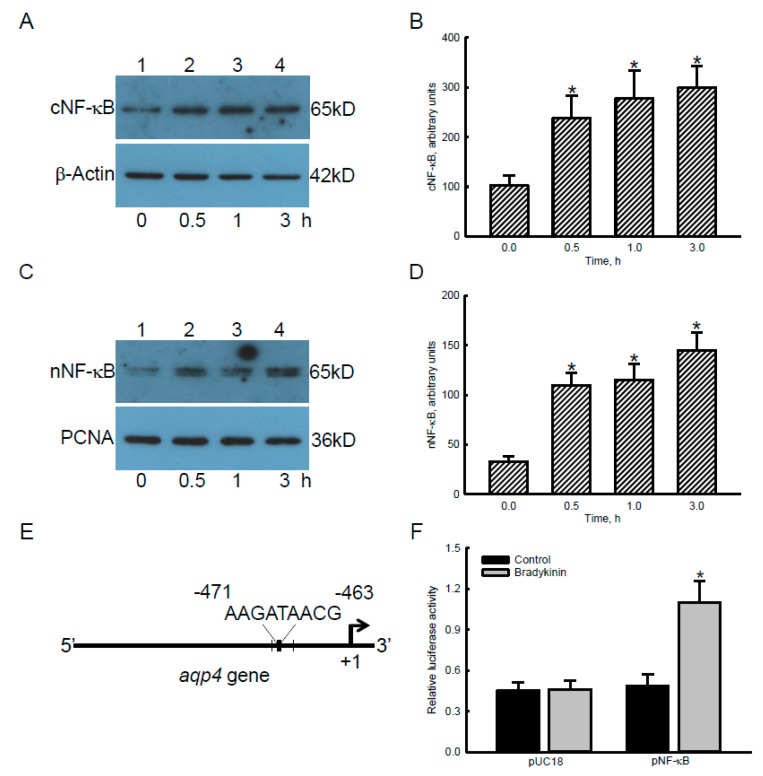
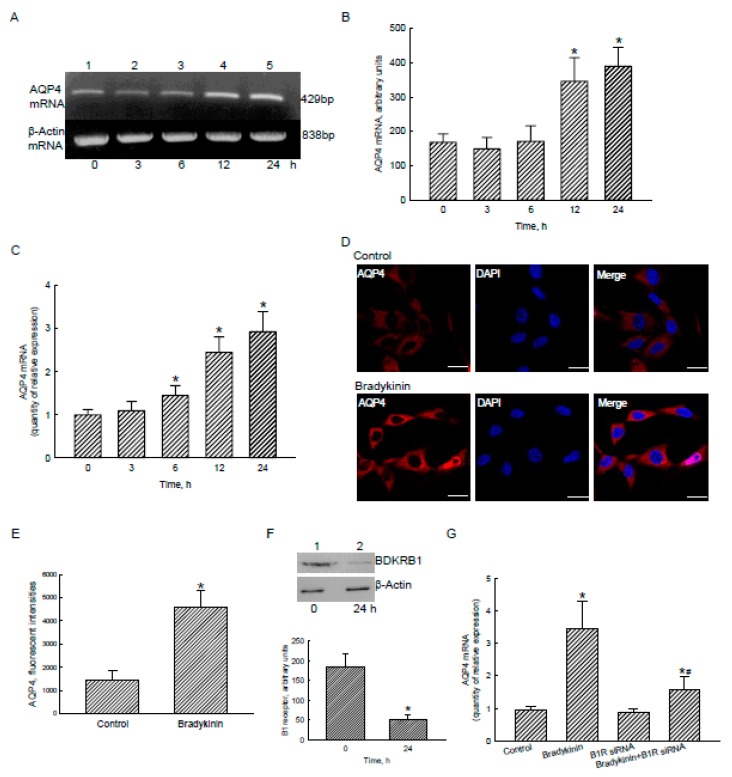
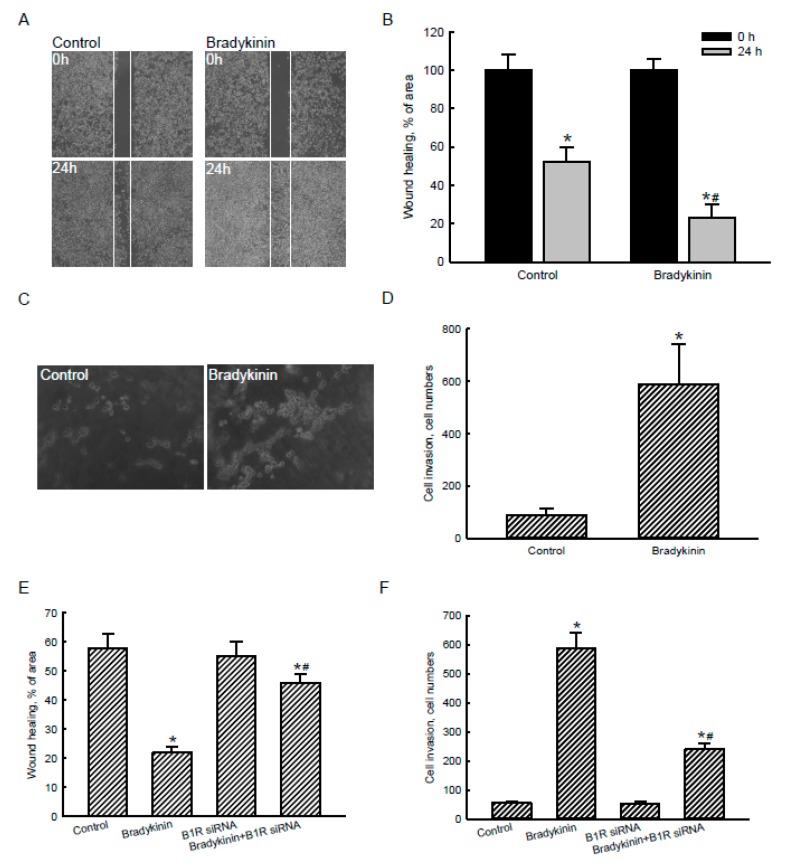
Glioblastoma multiforme (GBM) is the most common form of brain tumor and is very aggressive. Rapid migration and invasion of glioblastoma cells are two typical features driving malignance of GBM. Bradykinin functionally prompts calcium influx via activation of bradykinin receptor B1/B2 (BDKRB1/2). In this study, we evaluated the roles of bradykinin in migration and invasion of glioblastoma cells and the possible mechanisms. Expressions of aquaporin 4 (AQP4) mRNA and protein were upregulated in human glioblastomas. Furthermore, exposure of human U87 MG glioblastoma cells to bradykinin specifically increased levels of BDKRB1. Successively, bradykinin stimulated influx of calcium, phosphorylation of MEK1 and extracellular signal-regulated kinase (ERK)1/2, translocation and transactivation of nuclear factor-kappaB (NF-κB), and expressions of AQP4 mRNA and protein. Concomitantly, migration and invasion of human glioblastoma cells were elevated by bradykinin. Knocking-down BDKRB1 concurrently decreased AQP4 mRNA expression and cell migration and invasion. The bradykinin-induced effects were further confirmed in murine GL261 glioblastoma cells. Therefore, bradykinin can induce AQP4 expression and subsequent migration and invasion through BDKRB1-mediated calcium influx and subsequent activation of a MEK1-ERK1/2-NF-κB pathway. The bradykinin-BDKRB1 axis and AQP4 could be precise targets for treating GBM patients.

Keywords: MEK1-ERK1/2-NF-κB; aquaporin 4; bradykinin-BDKRB1 axis; calcium influx; cell migration/invasion; glioblastoma.


Conflict of interest statement

All authors of this paper declare that they have no conflict of interest.

Figures

Figure 1
Figure 1
Expression of aquaporin-4 (AQP4) and bradykinin receptor (BDKR) B1/2 mRNAs or proteins in human glioblastomas and normal brain tissues. Expression of AQP4 mRNA in human normal brains (Control, n = 37) and glioblastomas (Glioblastoma, n = 542) was mined in The Cancer Genome Atlas (TCGA) database (A). An immunohistochemical analysis of AQP4 in human meningioma (Control) and glioblastoma (Glioblastoma) tissues was carried out (B). Representative images are shown. The signals were quantified and statistically analyzed (C). Each value represents the mean ± standard deviation (SD) for n = 3. Expression of BDKRB1/2 mRNAs from controls (n = 37) and glioblastomas (n = 582) were searched using TCGA cohort (D). An asterisk (*) indicates that a value significantly (p < 0.05) differed from the respective control. Scale bar, 50 μm.
Figure 2
Figure 2
Effects of bradykinin on viability, levels, and functions of bradykinin receptor (BDKR) B1/2 in human malignant glioblastoma cells. Human U87 MG glioblastoma cells were stained with a fluorescent 4’,6-diamidino-2-phenylindole (DAPI) dye and reacted with a monoclonal antibody against glial fibrillary acidic protein (GFAP), a biomarker of astrocytes (A). Fluorescent signals were observed and analyzed using confocal microscopy. U87 MG cells were treated with 100 nM bradykinin for 6, 12, and 24 h or with 10, 50, and 100 nM bradykinin for 24 h. Cell morphologies were observed and photographed using a light microscope (B). Cell survival was analyzed using a trypan blue exclusion method (C,D). Levels of BDKRB1 and BDKRB2 were immunodetected (E, top two panels). β-Actin was analyzed as an internal control (bottom panel). These protein bands were quantified and statistically analyzed (F). After exposure to bradykinin and Fluo3, dynamic changes in levels of intracellular calcium (Ca2+) were immediately observed and recorded by confocal microscopy (G). Marked enhancement of fluorescent signals showed the increased intensities of intracellular Ca2+ following bradykinin treatment (H). Each value represents the mean ± standard deviation (SD) for n = 9. Representative immunoblots and confocal images are shown. An asterisk (*) indicates that a value significantly (p < 0.05) differed from the respective control. Scale bar, 20 μm.
Figure 3
Figure 3
Effects of bradykinin on phosphorylation of mitogen-activated protein kinase kinase (MEK)1 and extracellular signal-regulated kinase (ERK1)/2 in human malignant glioblastoma cells. Human U87 MG glioblastoma cells were treated with 100 nM bradykinin for 0.5, 1, and 3 h. Levels of phosphorylated (p)-MEK1and p-ERK1/2 were immunodetected (A,C, top panels). Amounts of MEK1 and ERK1 were analyzed as the internal controls (bottom panels). These protein bands were quantified and statistically analyzed (B,D). Each value represents the mean ±standard deviation (SD) for n = 9. An asterisk (*) indicates that a value significantly (p < 0.05) differed from the respective control. Representative immunoblots are shown.
Figure 4
Figure 4
Effects of bradykinin on levels, translocation, and transactivation activity of nuclear factor-kappaB (NF-κB) in human malignant glioblastoma cells. Human U87 MG glioblastoma cells were treated with 100 nM bradykinin for 0.5, 1, and 3 h. Levels of cytosolic (c) and nuclear (n) NF-κB were immunodetected (A,C, top panels). Amounts of β-actin and proliferating cell nuclear antigen (PCNA) were analyzed as internal controls for the cytosolic and nuclear proteins, respectively (bottom panels). These protein bands were quantified and statistically analyzed (B,D). A schematic diagram indicates the NF-κB-specific DNA binding element (−463 to −471) in the 5’-promoter region of the aqp4 gene (E). The NF-κB luciferase reporter plasmids (pNF-κB) and pUC18 control plasmids (pUC18) were transfected into human U87 MG cells. Transactivation activity of NF-κB was assayed with a reporter gene assay (F). Each value represents the mean ± standard deviation (SD), n = 9. An asterisk (*) indicates that a value significantly (p < 0.05) differed from the respective control. Representative immunoblots are shown.
Figure 5
Figure 5
Effects of bradykinin on aquaporin-4 (AQP4) mRNA and protein expressions in human malignant glioblastoma cells. Human U87 MG glioblastoma cells were treated with 100 nM bradykinin for 3, 6, 12, and 24 h. Levels of AQP4 mRNA were analyzed using an RT-PCR (A, top panel). Amounts of β-actin mRNA were examined as an internal control (bottom panel). These DNA bands were quantified and statistically analyzed (B). Expression of AQP4 mRNA was further quantified using a real-time polymerase chain reaction (PCR) analysis (C). Human U87 MG cells were exposed to bradykinin for 24 h. Levels and distribution of AQP4 were immunodetected (D, left panel). The nucleus was stained with 4’,6-diamidino-2-phenylindole (DAPI) (middle panel). The merged signals are shown in the right panel (D) and were quantified and statistically analyzed (E). Expression of the bradykinin receptor (BDKR) B1 was knocked-down using RNA interference. Control cells received scrambled siRNA. Levels of BDKRB1 were immunodetected (F, top panel). β-Actin was immunodetected as an internal control. These protein bands were quantified and statistically analyzed (bottom panel). Human U87 MG cells were pretreated with BDKRB1 siRNA and then exposed to bradykinin. Expression of AQP4 mRNA was quantified with a real-time PCR (G). Each value represents the mean ± standard deviation (SD), n = 9. Symbols * and # indicate that the values significantly (p < 0.05) differed from the control and BDKRB1 siRNA-treated groups, respectively. Representative DNA agarose gels, confocal images, and immunoblots are shown. Scale bar, 5 μm.
Figure 6
Figure 6
Effects of bradykinin on the migration and invasion of human malignant glioblastoma cells. Human U87 MG glioblastoma cells were treated with 100 nM bradykinin for 24 h. A wound-healing assay was carried out to determine migration of U87 MG cells (A). Cell migration was quantified by analyzing the blank area (B). In parallel, invasion by U87 MG cells was further analyzed using a Matrigel-based invasion assay (C). Invading cells were counted and statistically analyzed (D). Human U87 MG cells were pretreated with bradykinin receptor B1 (BDKRB1) siRNA and then exposed to bradykinin. Wound-healing (E) and Matrigel-invasion (F) assays were performed, and results were statistically analyzed. Each value represents the mean ± standard deviation (SD), n = 9. Symbols * and # indicate that the values significantly (p < 0.05) differed from the control and BDKRB1 siRNA-treated groups, respectively. Representative morphological images are shown.

Similar articles

Cited by

References

    1. Louis D.N., Perry A., Reifenberger G., Von Deimling A., Figarella-Branger D., Cavenee W.K., Ohgaki H., Wiestler O.D., Kleihues P., Ellison D.W. The 2016 World Health Organization classification of tumors of the central nervous system: A summary. Acta Neuropathol. 2016;131:803–820. doi: 10.1007/s00401-016-1545-1. - DOI - PubMed
    1. Sturm D., Bender S., Jones D.T., Lichter P., Grill J., Becher O., Hawkins C., Majewski J., Jones C., Costello J.F., et al. Paediatric and adult glioblastoma: Multiform (epi)genomic culprits emerge. Nat. Rev. Cancer. 2014;14:92–107. doi: 10.1038/nrc3655. - DOI - PMC - PubMed
    1. Stupp R., Mason W.P., Van Den Bent M.J., Weller M., Fisher B., Taphoorn M.J.B., Belanger K., Brandes A.A., Marosi C., Bogdahn U., et al. Radiotherapy plus concomitant and adjuvant temozolomide for glioblastoma. New Engl. J. Med. 2005;352:987–996. doi: 10.1056/NEJMoa043330. - DOI - PubMed
    1. Hottinger A.F., Pacheco P., Stupp R. Tumor treating fields: A novel treatment modality and its use in brain tumors. Neuro Oncol. 2016;18:1338–1349. doi: 10.1093/neuonc/now182. - DOI - PMC - PubMed
    1. Chen X., Zhang M., Gan H., Wang H., Lee J.H., Fang D., Kitange G.J., He L., Hu Z., Parney I.F., et al. A novel enhancer regulates MGMT expression and promotes temozolomide resistance in glioblastoma. Nat. Commun. 2018;9:2949. doi: 10.1038/s41467-018-05373-4. - DOI - PMC - PubMed

LinkOut - more resources