Multicenter Study
. 2020 Mar 13;12(3):760.
doi: 10.3390/nu12030760.

Relationships between Neonatal Nutrition and Growth to 36 Weeks' Corrected Age in ELBW Babies-Secondary Cohort Analysis from the Provide Trial

Affiliations
Multicenter Study

Relationships between Neonatal Nutrition and Growth to 36 Weeks' Corrected Age in ELBW Babies-Secondary Cohort Analysis from the Provide Trial

Barbara E Cormack et al. Nutrients. .

Abstract

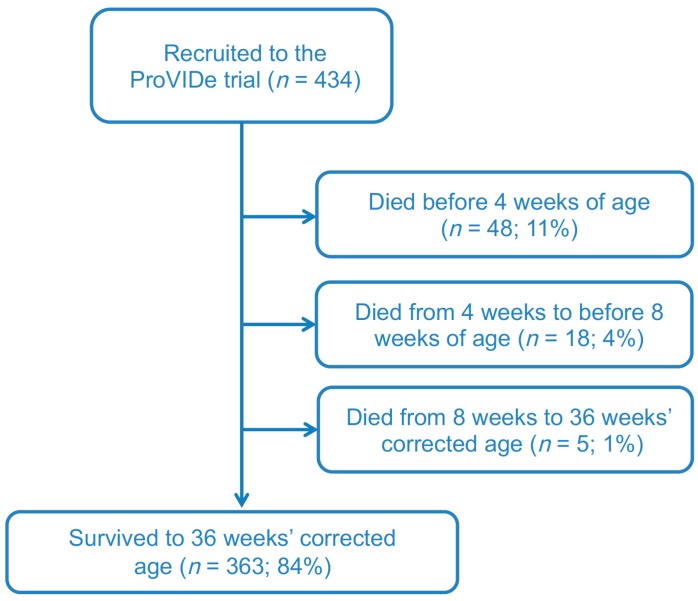
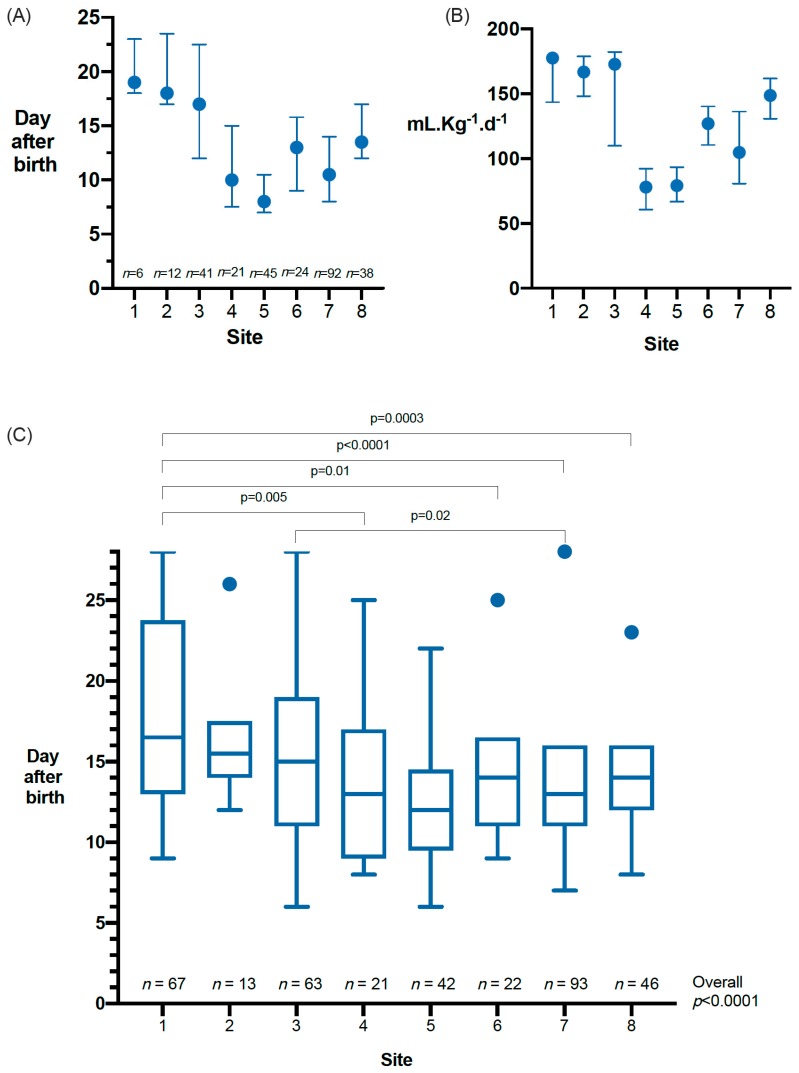
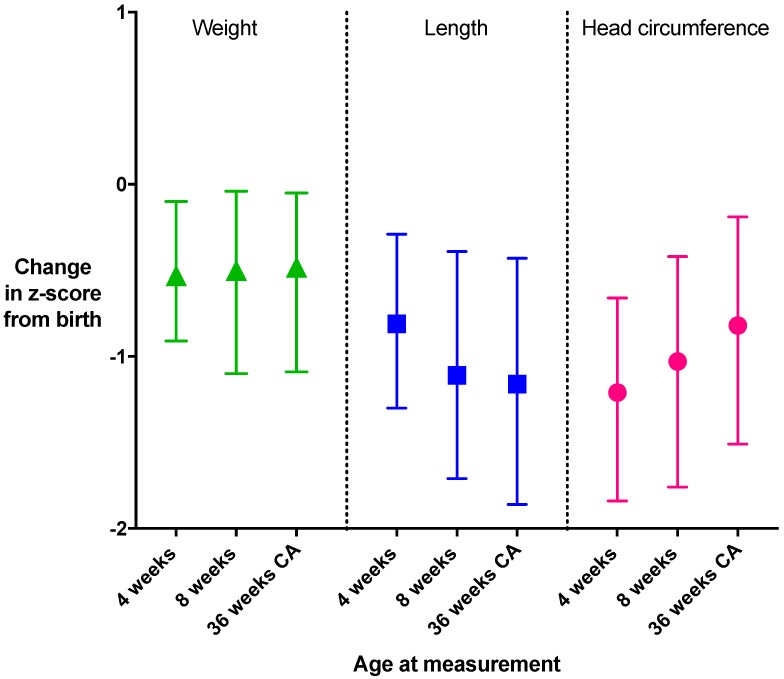
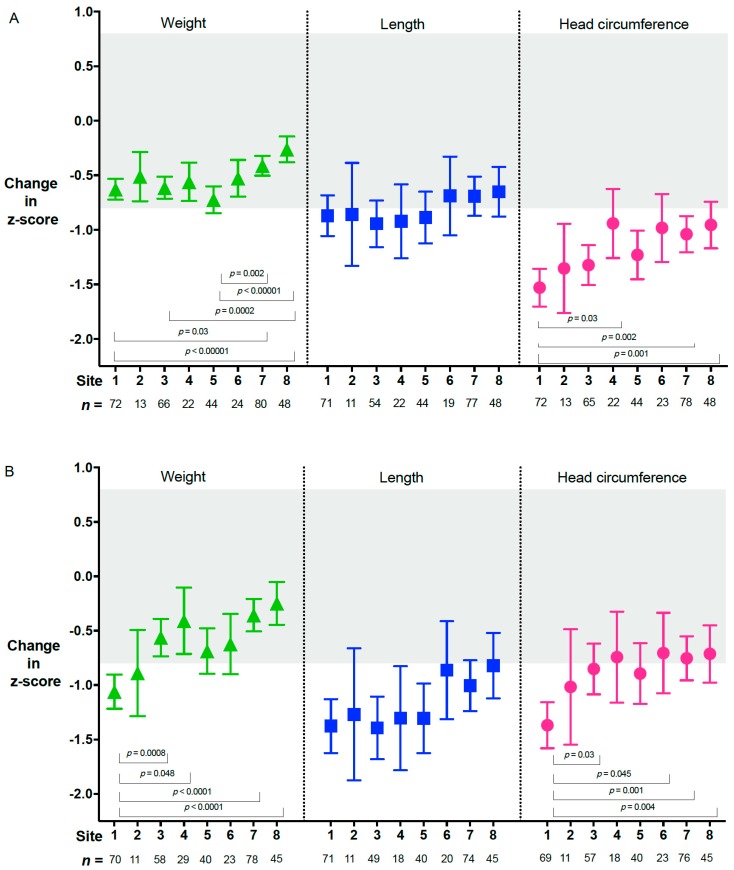
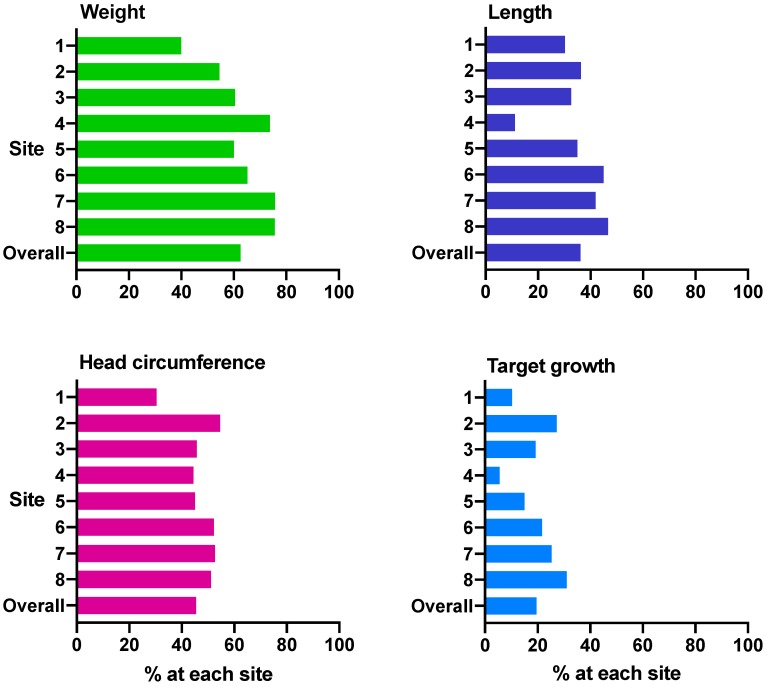
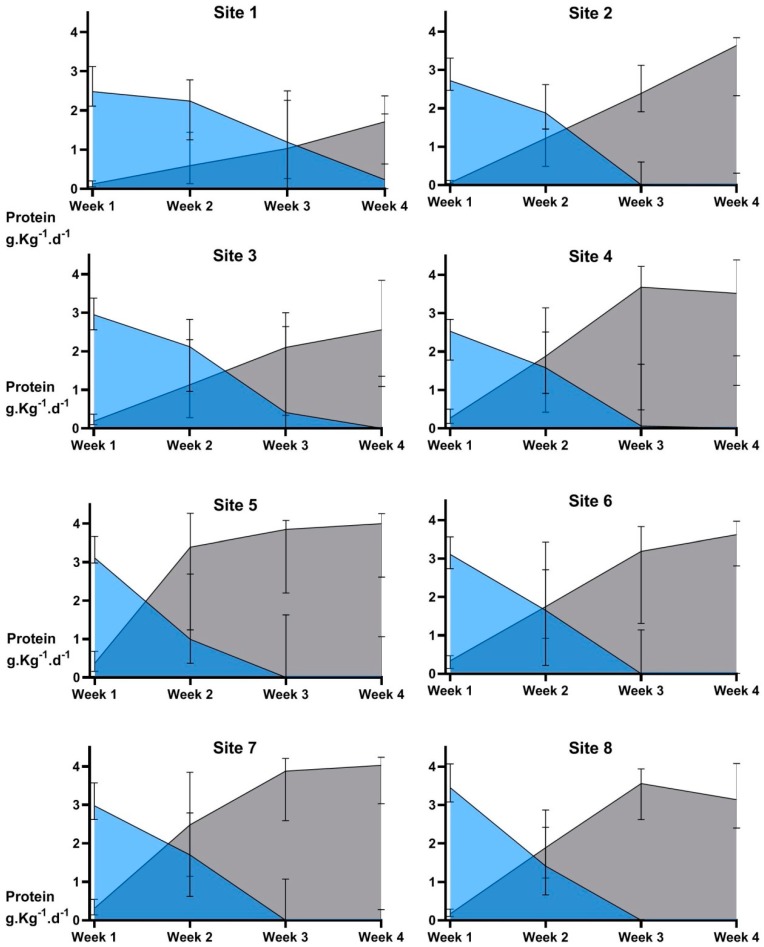
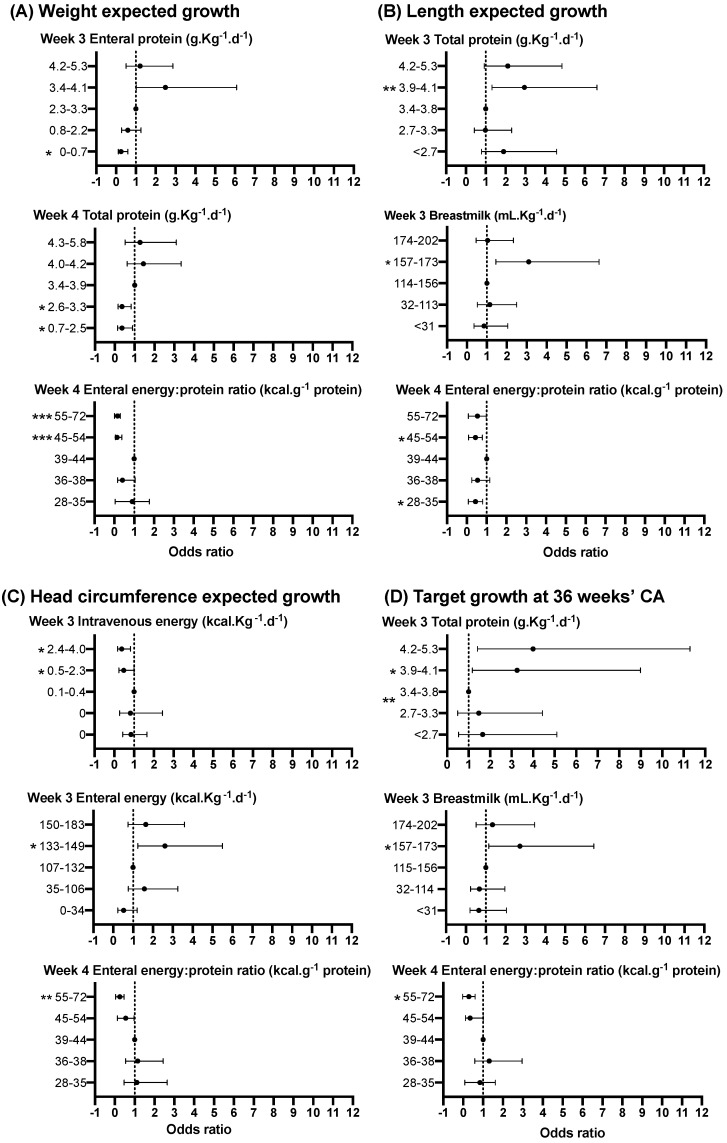
A key modifiable factor for improving neurodevelopment in extremely low birthweight (ELBW) babies may be improving growth, especially head growth, by optimising nutrition in the early neonatal period. We aimed to investigate relationships between nutrient intakes in the 4 weeks after birth, and growth from birth to 36 weeks' corrected age (CA) in ELBW babies. We undertook a prospective cohort study of 434 participants enrolled in a randomised controlled trial (ProVIDe) in eight New Zealand and Australian neonatal intensive care units. Macronutrient intakes from birth to 4 weeks and weight, length and head circumference measurements from birth to 36 weeks' CA were collected. From birth to 36 weeks' CA, the median (IQR) z-score changes were: weight -0.48 (-1.09, 0.05); length -1.16 (-1.86, -0.43), and head circumference -0.82 (-1.51, -0.19). Changes in z-score to 4 weeks and 36 weeks' CA were correlated with protein intake. Each 1 g·Kg-1·d-1 total protein intake in week 2 was associated with 0.26 z-score increase in head circumference at 36 weeks' CA. Both nutritional intake and change in z-scores to 36 weeks' CA differed widely amongst sites. Correlations between nutrition and growth, and differences in these amongst sites, indicate there may be potential to improve growth with enhanced nutrition practices.

Keywords: amino acid; extremely low birthweight; gestational age; growth; infant; newborn; nutrition; parenteral nutrition; premature; preterm; protein.


Conflict of interest statement

The authors declare no conflict of interest. The funders had no role in the design of the study; in the collection, analyses, or interpretation of data; in the writing of the manuscript, or in the decision to publish the results.

Figures

Figure 1
Figure 1
ProVIDe STROBE Flow Diagram.
Figure 2
Figure 2
Enteral feeding and timing of breastmilk fortifier addition in participating sites. (A) Day after birth of the first fortified feed or preterm formula n = 279. (B) Feed volume in mL·Kg−1·d−1 at the time of the first fortified feed or preterm formula n = 279. (C) Days to full enteral feeding (defined as the day when no further intravenous nutrition was given or 150 mL·Kg−1·d−1 enteral feeds was reached). Bottom and the top of the box, the first and third quartiles; band inside the box, median; whiskers, 1.5 times the interquartile range, and circles, outliers. n = 367, 18 babies excluded (C) due to missing data on time from birth to full enteral feeds.
Figure 3
Figure 3
Change in z-score from birth for weight, length and head circumference. Change in z-score for the overall cohort at each time point from birth (median and interquartile range). n: 4 weeks, weight n = 344, length n = 323, head circumference n = 339; 8 weeks, weight n = 343, length n = 334, head circumference n = 339; 36 weeks’ corrected age, n = 369, length n = 346, head circumference n = 339. Expected growth (z-score change >-0.8 to <0.8) is indicated by the grey shaded area. CA, corrected age.
Figure 4
Figure 4
Change in z-score from birth for each site. Change in z-score from birth to 4 weeks (A) and 36 weeks’ corrected age (B) for each site, adjusted for site, sex, gestational age at birth and birthweight z-score. Data are median and interquartile range. Expected growth (z-score change >−0.8 to <0.8) is indicated by the grey shaded area. CA, corrected age.
Figure 5
Figure 5
Percentage of babies at each site with expected growth from birth 36 weeks’ corrected age. (A) weight (n = 369), (B) length (n = 346), (C) head circumference (n = 339) and (D) target growth (n = 335). Expected growth is change in z-score from −0.8 to 0.8, target growth is change in z-score from −0.8 to 0.8 for all three of weight, length and head circumference.
Figure 6
Figure 6
Site differences in intravenous and enteral protein intake over the first 4 weeks. Data are median and interquartile range, n = 367. Intravenous protein intakes (blue shading) were significantly different amongst sites in week 1 (p < 0.0001), week 2 (p = 0.04) and week 3 (p < 0.0001). Enteral protein intakes (grey shading) were significantly different amongst sites in each of weeks 1 to 4 (all p < 0.0001).
Figure 7
Figure 7
Relationship between selected nutrient intakes in each of the first 4 weeks and expected growth for weight (A), length (B) and head circumference (C), and target growth (D). Data are adjusted OR and 95% confidence interval (CI) of achieving expected or target growth for each quintile of intake, where quintile 3 is the referent. Significant p values are shown as *<0.05, **<0.01, ***<0.001. For full details, see Supplementary Table S2.

Similar articles

Cited by

References

    1. Ziegler E.E., O’Donnell A.M., Nelson S.E., Fomon S.J. Body composition of the reference fetus. Growth. 1976;40:329–341. - PubMed
    1. Agostoni C., Buonocore G., Carnielli V.P., De Curtis M., Darmaun D., Decsi T., Domellof M., Embleton N.D., Fusch C., Genzel-Boroviczeny O., et al. Enteral nutrient supply for preterm infants: Commentary from the European Society of Paediatric Gastroenterology, Hepatology and Nutrition Committee on Nutrition. J. Pediatr. Gastroenterol. Nutr. 2010;50:85–91. doi: 10.1097/MPG.0b013e3181adaee0. - DOI - PubMed
    1. Joosten K., Embleton N., Yan W., Senterre T. ESPGHAN/ESPEN/ESPR/CSPEN guidelines on pediatric parenteral nutrition: Energy. Clin. Nutr. 2018;37:2309–2314. doi: 10.1016/j.clnu.2018.06.944. - DOI - PubMed
    1. van Goudoever J.B., Carnielli V., Darmaun D., Sainz de Pipaon M., ESPGHAN ESPEN ESPR CSPEN Working Group on Pediatric Parenteral Nutrition Guidelines on pediatric parenteral nutrition: Amino acids. Clin. Nutr. 2018;37:2315–2323. doi: 10.1016/j.clnu.2018.06.945. - DOI - PubMed
    1. Horbar J.D., Ehrenkranz R.A., Badger G.J., Edwards E.M., Morrow K.A., Soll R.F., Buzas J.S., Bertino E., Gagliardi L., Bellù R. Weight growth velocity and postnatal growth failure in infants 501 to 1500 g: 2000–2013. Pediatrics. 2015;136:e84–e92. doi: 10.1542/peds.2015-0129. - DOI - PubMed

Publication types

MeSH terms