. 2020 Mar 13;11(3):304.
doi: 10.3390/genes11030304.

G-quadruplex Stabilization Fuels the ALT Pathway in ALT-positive Osteosarcoma Cells

Affiliations

G-quadruplex Stabilization Fuels the ALT Pathway in ALT-positive Osteosarcoma Cells

Roberta Amato et al. Genes (Basel). .

Abstract

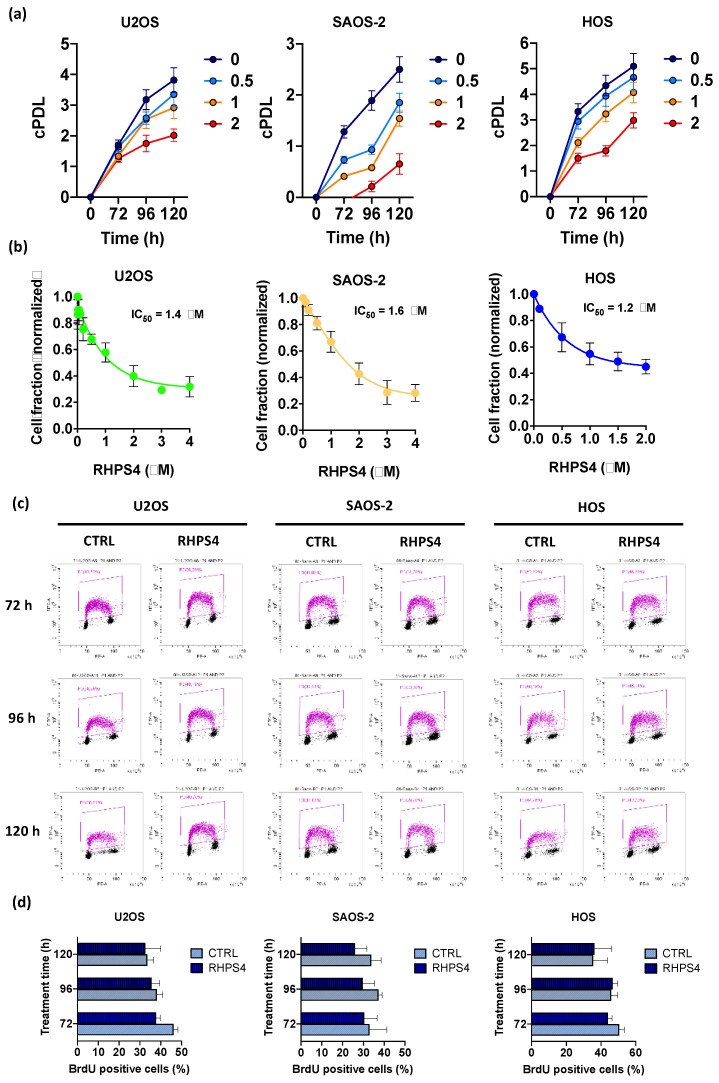
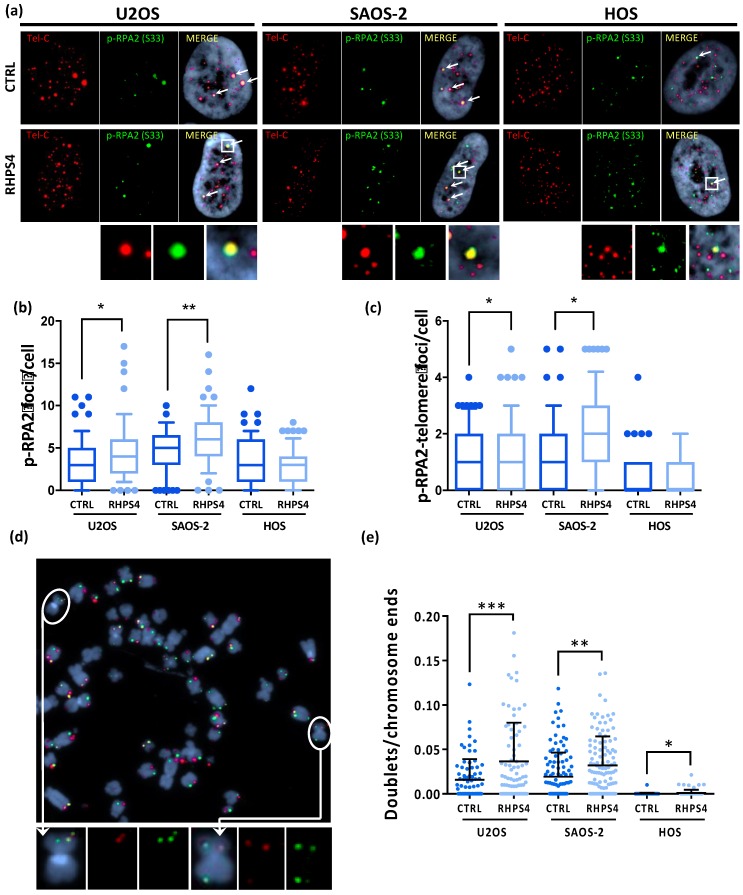
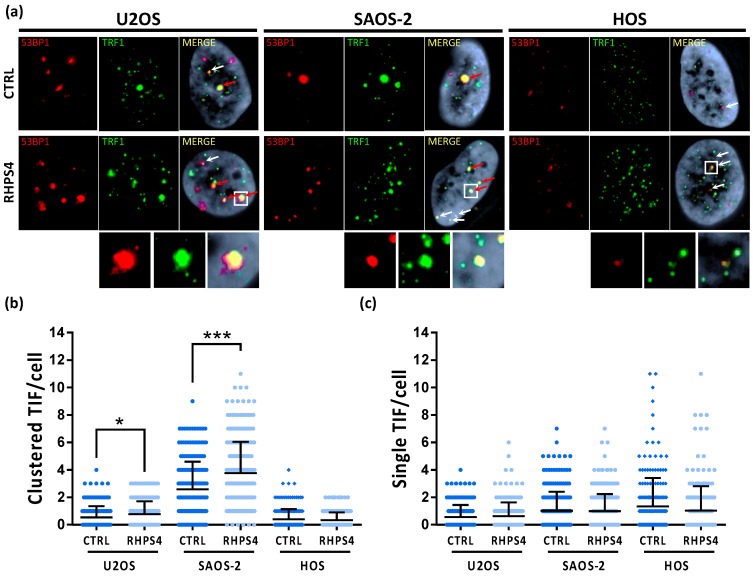
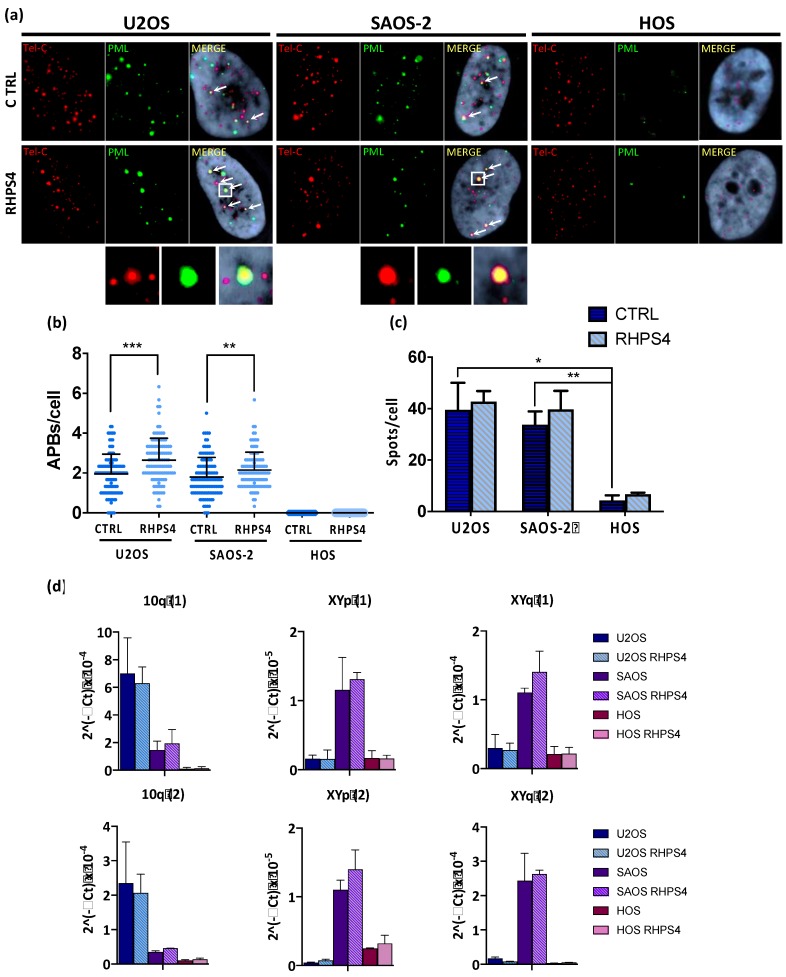
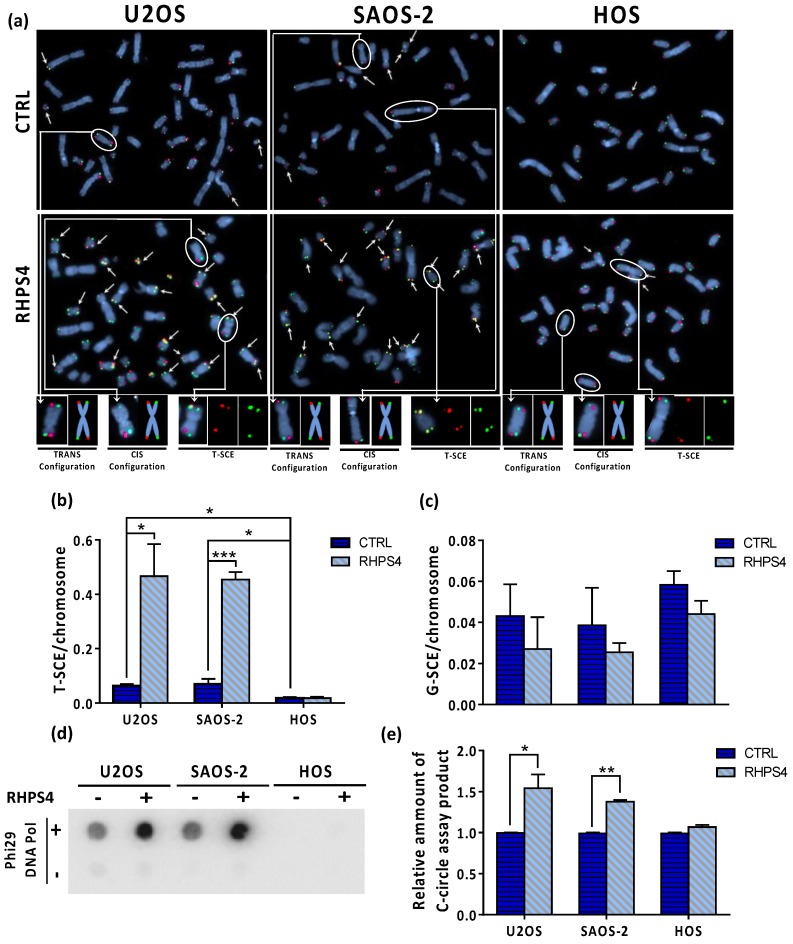
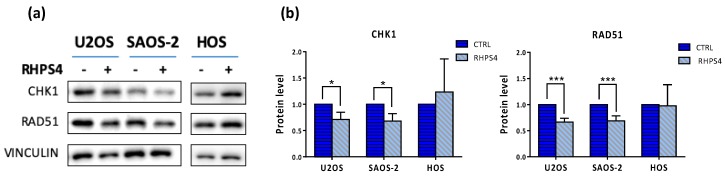
Most human tumors maintain telomere lengths by telomerase, whereas a portion of them (10%-15%) uses a mechanism named alternative lengthening of telomeres (ALT). The telomeric G-quadruplex (G4) ligand RHPS4 is known for its potent antiproliferative effect, as shown in telomerase-positive cancer models. Moreover, RHPS4 is also able to reduce cell proliferation in ALT cells, although the influence of G4 stabilization on the ALT mechanism has so far been poorly investigated. Here we show that sensitivity to RHPS4 is comparable in ALT-positive (U2OS; SAOS-2) and telomerase-positive (HOS) osteosarcoma cell lines, unlinking the telomere maintenance mechanism and RHPS4 responsiveness. To investigate the impact of G4 stabilization on ALT, the cardinal ALT hallmarks were analyzed. A significant induction of telomeric doublets, telomeric clusterized DNA damage, ALT-associated Promyelocytic Leukaemia-bodies (APBs), telomere sister chromatid exchanges (T-SCE) and c-circles was found exclusively in RHPS4-treated ALT cells. We surmise that RHPS4 affects ALT mechanisms through the induction of replicative stress that in turn is converted in DNA damage at telomeres, fueling recombination. In conclusion, our work indicates that RHPS4-induced telomeric DNA damage promotes overactivation of telomeric recombination in ALT cells, opening new questions on the therapeutic employment of G4 ligands in the treatment of ALT positive tumors.

Keywords: ALT; G-quadruplex; RHPS4; replicative stress; telomeres.


Conflict of interest statement

The authors declare no conflict of interest. The funders had no role in the design of the study; in the collection, analyses, or interpretation of data; in the writing of the manuscript, or in the decision to publish the results.

Figures

Figure 1
Figure 1
(a) Graphs show the cumulative population doubling levels (cPDL) of U2OS, SAOS-2, and HOS. Each cell line was treated with RHPS4 at different concentrations (untreated in blue, 0.5 µM in light blue, 1 µM in yellow, and 2 µM in red) and harvested at different times (72, 96, and 120 h). (b) Sensitivity of U2OS, SAOS-2, and HOS osteosarcoma cell lines to RHPS4 concentrations ranging from 0.01 to 4 μM, evaluated after 120 h. These data, obtained by sulforhodamine B (SRB) assay, indicate that RHPS4 sensitivity was comparable in alternative lengthening of telomeres (ALT)-positive (IC50 = 1.4 and 1.6 μM in U2OS and SAOS-2, respectively) and telomerase-positive (IC50 = 1.2 μM in HOS) osteosarcoma cell lines. (c) Analysis of the percentage of BrdU incorporating cells as evaluated at 72, 96, and 120 h after RHPS4 treatment. (d) Histogram showing the percentage of BrdU incorporating cells excluded S-phase depletion upon RHPS4 treatment at the different fixing times (72, 96, and 120 h). Errors bars denote standard deviations. * p < 0.05, ** p < 0.01, *** p < 0.001 (Student’s t-test).
Figure 2
Figure 2
(a) Representative images of RHPS4-treated or untreated osteosarcoma cell lines stained for p-RPA2 (S33). For each cell line and condition, single channels (p-RPA2 signals in green and telomeric signals in red) and merged images are illustrated. Arrows indicate p-RPA2 and telomere colocalizations. (b) Dotplot showing total amount of p-RPA2 foci per cell. (c) Dotplot showing colocalizations between p-RPA2 and telomere. The middle bar denotes median, the box extends from 25th to 75th percentiles and the whiskers above and below the box denote 90th and 10th percentile. (d) Representative image of chromosome orientation–FISH (CO–FISH) stained metaphase of SAOS-2 cell line in which double colored doublets are pointed out as shown in enlarged images. (e) Dotplot of double color doublets frequency in osteosarcoma cell lines. Black lines denote means and errors bars denote standard deviations. * p < 0.05, ** p < 0.01, *** p < 0.001.
Figure 3
Figure 3
(a) Telomere dysfunction induced foci (TIFs) observed by immunofluorescence in osteosarcoma cell lines after 120 h treatment with RHPS4. For each line and condition, single channels (53BP1 protein signals in red and TRF1 protein signals in green) and merged images are illustrated. White arrows indicate TRF1 (green) and 53BP1 (red) colocalizations; red arrows indicate the dysfunctional telomeres aggregation (telomere clusters). (b) Dotplot of telomeres clusters formed in ALT cell lines by dysfunctional telomeres aggregation. RHPS4 treatment induces a significant increase in both ALT lines, but not in HOS. (c) Dotplot of single colocalizations between TRF1 and 53BP1 showing telomeric localization of DNA damage.. The middle bar denotes mean and the bars above and below the mean denotes standard deviation. * p < 0.05, *** p < 0.001 (Student’s t-test).
Figure 4
Figure 4
(a) Representative images of ALT-associated PML bodies (APBs) in osteosarcoma cell lines after 120 h treatment with RHPS4 obtained by immune-FISH technique. For each line and condition, single channels (PML signals in green and telomeric signals in red) and merged images are illustrated. Arrows indicate PML and telomeres colocalization. (b) Dotplot showing colocalizations per cell between telomeres and PML protein. Black lines denote the means and errors bars denote standard deviations. (c) Histogram of TERRA frequency in osteosarcoma cell lines obtained by RNA–FISH technique. Data were obtained counting number of spots for each nucleus. Errors bars denote standard deviations. (d) qPCR analysis of the expression of TERRA transcribed at different subtelomeres. Errors bars denote standard deviations. * p < 0.05, ** p < 0.01, *** p < 0.001 (Student’s t-test).
Figure 5
Figure 5
(a) Representative images of CO–FISH stained metaphases in U2OS, SAOS-2, and HOS osteosarcoma cell lines after RHPS4 treatment. Arrows indicate telomere sister chromatid exchanges (T-SCE). (b) Histograms show T-SCE frequency per chromosome end in osteosarcoma cell lines. RHPS4 treatment induced a significant increase of telomeric sister chromatid exchanges (T-SCE) in U2OS and SAOS-2 but not in HOS cells. (c) Genomic sister chromatid exchanges (G-SCE) in U2OS, SAOS-2, and HOS, determined using the method proposed by Cornforth and Eberle [46], are not modulated by RHPS4. (d) Dot blot analysis of c-circles in presence or absence of Phi29 DNA Pol enzyme in the indicated cell lines. (e) Densitometry of c-circles signals. For each cell line, the background value (-Phi29 DNA Pol sample) was subtracted and reported in histograms. Errors bars denote standard deviations. * p < 0.05, ** p < 0.01, *** p < 0.001 (Student’s t-test).
Figure 6
Figure 6
(a) Representative image of CHK1 and RAD51 proteins obtained by Western blot analysis. (b) Quantitation of protein levels showed a very significant (p < 0.001) and a significant (p < 0.05) decrease of RAD51 and CHK1 proteins, respectively in both ALT-positive cell lines. Errors bars denote standard deviations. * p < 0.05, *** p < 0.001 (Student’s t-test).

References

    1. Blackburn E.H., Chan S., Chang J., Fulton T.B., Krauskopf A., McEachern M., Prescott J., Roy J., Smith C., Wang H. Cold Spring Harbor Symposia on Quantitative Biology. Volume 65. Cold Spring Harbor Laboratory Press; New York, NY, USA: 2000. Molecular manifestations and molecular determinants of telomere capping; pp. 253–264. - PubMed
    1. De Lange T. Shelterin: The protein complex that shapes and safeguards human telomeres. Genes Dev. 2005;19:2100–2110. doi: 10.1101/gad.1346005. - DOI - PubMed
    1. Lejnine S., Makarov V.L., Langmore J.P. Conserved nucleoprotein structure at the ends of vertebrate and invertebrate chromosomes. Proc. Natl. Acad. Sci. USA. 1995;92:2393–2397. doi: 10.1073/pnas.92.6.2393. - DOI - PMC - PubMed
    1. Nikitina T., Woodcock C.L. Closed chromatin loops at the ends of chromosomes. J. Cell Biol. 2004;166:161–165. doi: 10.1083/jcb.200403118. - DOI - PMC - PubMed
    1. De Lange T. Protection of mammalian telomeres. Oncogene. 2002;21:532–540. doi: 10.1038/sj.onc.1205080. - DOI - PubMed

Publication types

LinkOut - more resources