

Basal-Type Breast Cancer Stem Cells Over-Express Chromosomal Passenger Complex Proteins
- PMID: 32183150
- PMCID: PMC7140627
- DOI: 10.3390/cells9030709
Basal-Type Breast Cancer Stem Cells Over-Express Chromosomal Passenger Complex Proteins
Abstract
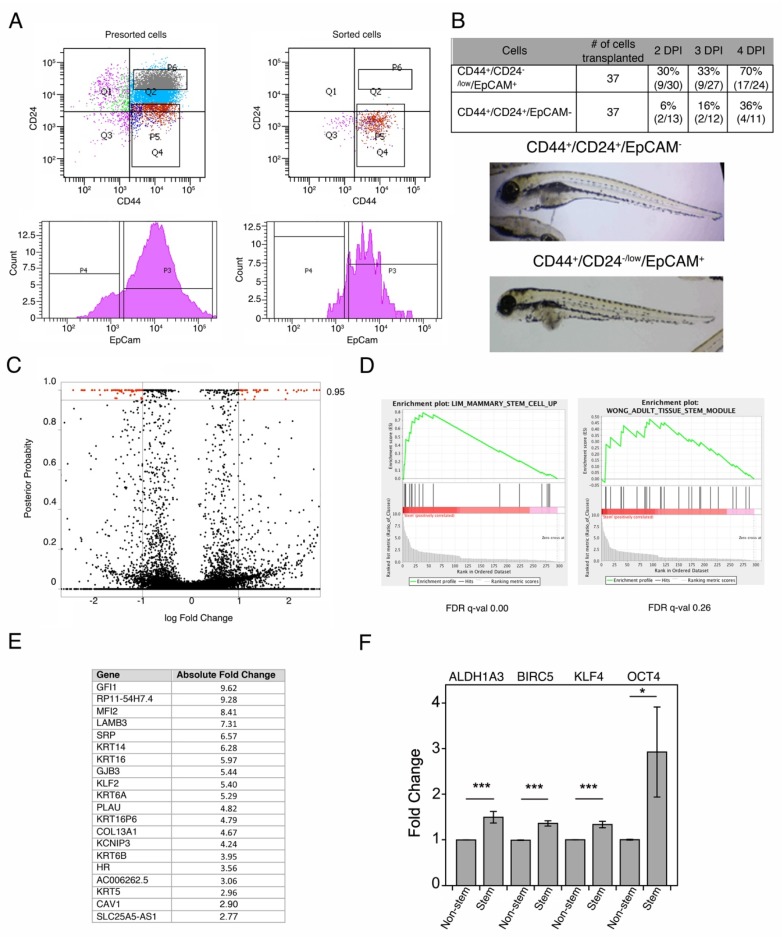
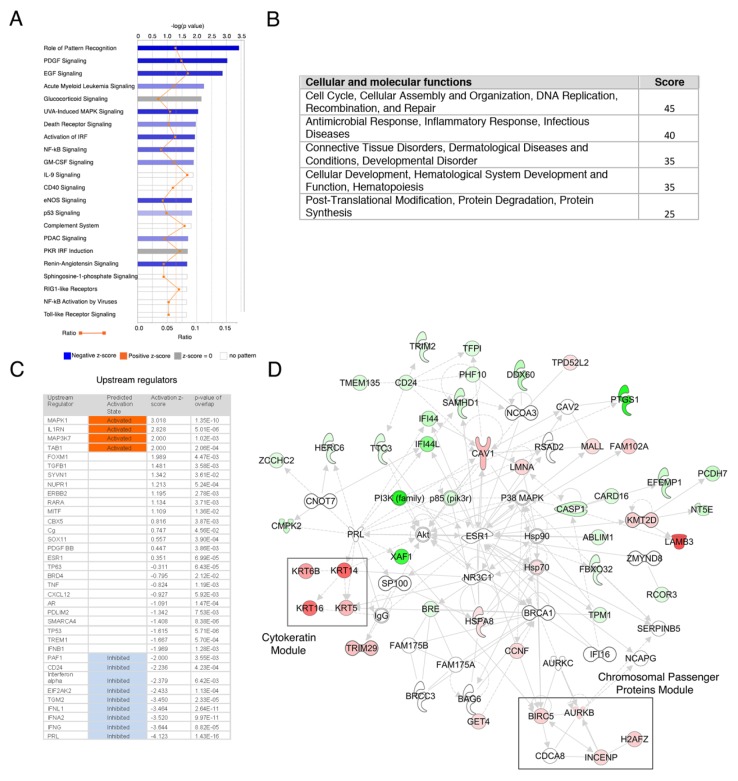
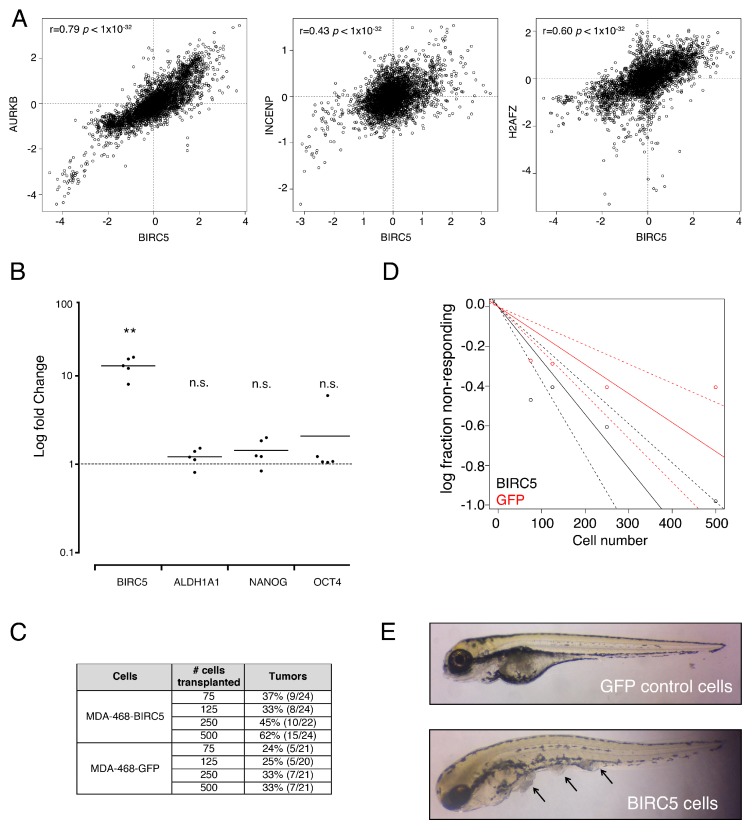
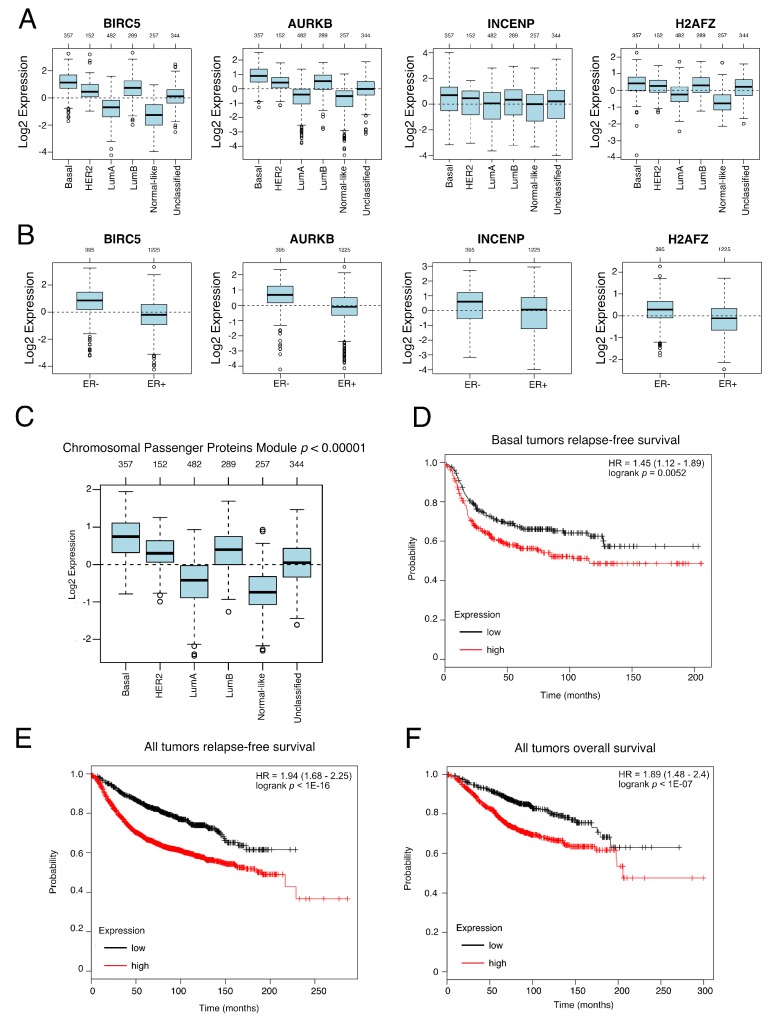
(1) Aim: In the present paper we analyzed the transcriptome of CSCs (Cancer Stem Cells), in order to find defining molecular processes of breast cancer. (2) Methods: We performed RNA-Seq from CSCs isolated from the basal cell line MDA-MB-468. Enriched processes and networks were studied using the IPA (Ingenuity Pathway Analysis) tool. Validation was performed with qRT-PCR and the analysis of relevant genes was evaluated by overexpression, flow cytometry and in vivo zebrafish studies. Finally, the clinical relevance of these results was assessed using reported cohorts. (3) Results: We found that CSCs presented marked differences from the non-CSCs, including enrichment in transduction cascades related to stemness, cellular growth, proliferation and apoptosis. Interestingly, CSCs overexpressed a module of co-regulated Chromosomal Passenger Proteins including BIRC5 (survivin), INCENP and AURKB. Overexpression of BIRC5 increased the number of CSCs, as assessed by in vitro and in vivo zebrafish xenotransplant analyses. Analysis of previously published cohorts showed that this co-regulated module was not only overexpressed in basal breast tumors but also associated with relapse-free and overall survival in these patients. (4) Conclusions: These results underline the importance of Cancer Stem Cells in breast cancer progression and point toward the possible use of chromosomal passenger proteins as prognostic factors.
Keywords: breast cancer; networks; stem cells.
Conflict of interest statement
The authors declare no conflict of interest. The funders had no role in the design of the study; in the collection, analyses, or interpretation of data; in the writing of the manuscript, or in the decision to publish the results.
Figures
Similar articles
-
Inherited variants in the inner centromere protein (INCENP) gene of the chromosomal passenger complex contribute to the susceptibility of ER-negative breast cancer.Carcinogenesis. 2015 Feb;36(2):256-71. doi: 10.1093/carcin/bgu326. Epub 2015 Jan 13. Carcinogenesis. 2015. PMID: 25586992 Free PMC article.
-
Aryl hydrocarbon receptor/cytochrome P450 1A1 pathway mediates breast cancer stem cells expansion through PTEN inhibition and β-Catenin and Akt activation.Mol Cancer. 2017 Jan 19;16(1):14. doi: 10.1186/s12943-016-0570-y. Mol Cancer. 2017. PMID: 28103884 Free PMC article.
-
Expression Profiling of Clinical Specimens Supports the Existence of Neural Progenitor-Like Stem Cells in Basal Breast Cancers.Clin Breast Cancer. 2017 Jul;17(4):298-306.e7. doi: 10.1016/j.clbc.2017.01.007. Epub 2017 Jan 27. Clin Breast Cancer. 2017. PMID: 28216417 Free PMC article.
-
Breast cancer stem cells and intrinsic subtypes: controversies rage on.Curr Stem Cell Res Ther. 2009 Jan;4(1):50-60. doi: 10.2174/157488809787169110. Curr Stem Cell Res Ther. 2009. PMID: 19149630 Review.
-
Concise review: breast cancer stem cells: regulatory networks, stem cell niches, and disease relevance.Stem Cells Transl Med. 2014 Aug;3(8):942-8. doi: 10.5966/sctm.2014-0020. Epub 2014 Jun 5. Stem Cells Transl Med. 2014. PMID: 24904174 Free PMC article. Review.
Cited by
-
The Role of lncRNAs in the Stem Phenotype of Pancreatic Ductal Adenocarcinoma.Int J Mol Sci. 2021 Jun 15;22(12):6374. doi: 10.3390/ijms22126374. Int J Mol Sci. 2021. PMID: 34203589 Free PMC article. Review.
-
Cancer Stem Cells from Definition to Detection and Targeted Drugs.Int J Mol Sci. 2024 Mar 31;25(7):3903. doi: 10.3390/ijms25073903. Int J Mol Sci. 2024. PMID: 38612718 Free PMC article. Review.
-
KRAB-ZFPs and cancer stem cells identity.Genes Dis. 2022 Apr 9;10(5):1820-1832. doi: 10.1016/j.gendis.2022.03.013. eCollection 2023 Sep. Genes Dis. 2022. PMID: 37492743 Free PMC article. Review.
-
Survivin (BIRC5) Peptide Vaccine in the 4T1 Murine Mammary Tumor Model: A Potential Neoadjuvant T Cell Immunotherapy for Triple Negative Breast Cancer: A Preliminary Study.Vaccines (Basel). 2023 Mar 13;11(3):644. doi: 10.3390/vaccines11030644. Vaccines (Basel). 2023. PMID: 36992227 Free PMC article.
-
Testing the Anticancer Effect of Matcha Using Zebrafish as an Animal Model.Nutrients. 2023 May 18;15(10):2369. doi: 10.3390/nu15102369. Nutrients. 2023. PMID: 37242252 Free PMC article.
References
Publication types
MeSH terms
Substances
LinkOut - more resources
Full Text Sources
Medical
Miscellaneous
