

Prediction of the Epidemic Peak of Coronavirus Disease in Japan, 2020
- PMID: 32183172
- PMCID: PMC7141223
- DOI: 10.3390/jcm9030789
Prediction of the Epidemic Peak of Coronavirus Disease in Japan, 2020
Abstract
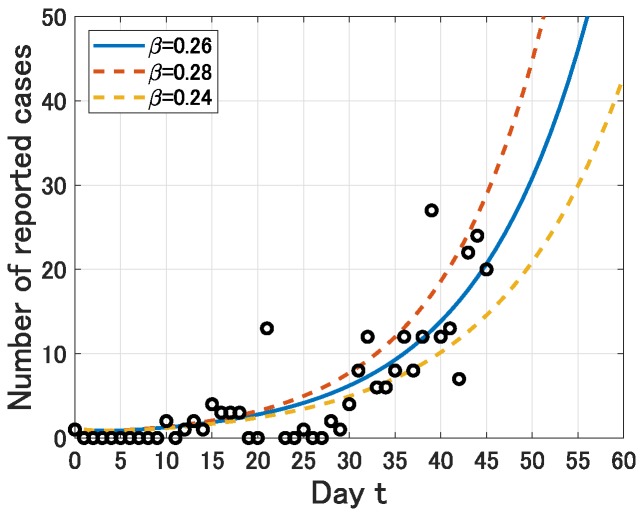
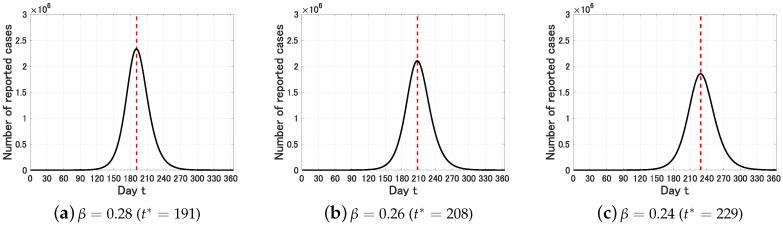
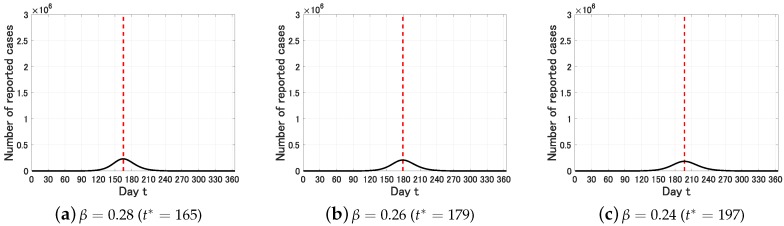
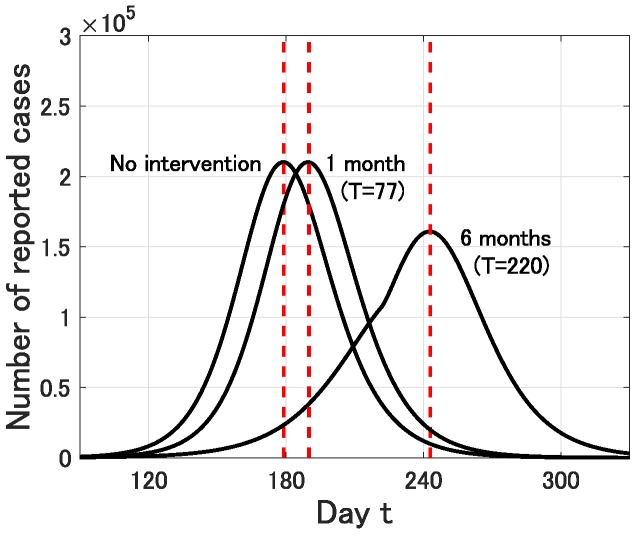
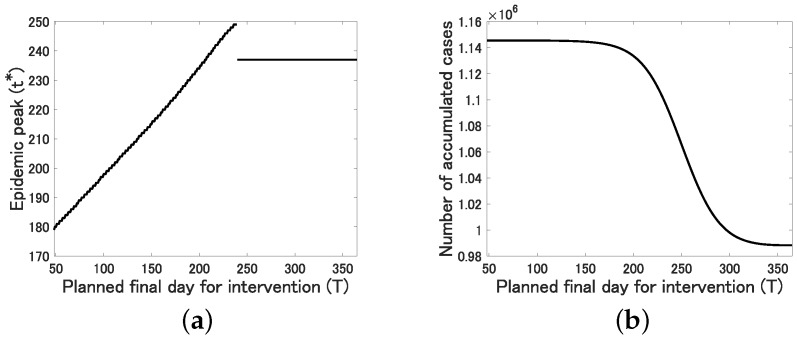
The first case of coronavirus disease 2019 (COVID-19) in Japan was reported on 15 January 2020 and the number of reported cases has increased day by day. The purpose of this study is to give a prediction of the epidemic peak for COVID-19 in Japan by using the real-time data from 15 January to 29 February 2020. Taking into account the uncertainty due to the incomplete identification of infective population, we apply the well-known SEIR compartmental model for the prediction. By using a least-square-based method with Poisson noise, we estimate that the basic reproduction number for the epidemic in Japan is R 0 = 2 . 6 ( 95 % CI, 2 . 4 - 2 . 8 ) and the epidemic peak could possibly reach the early-middle summer. In addition, we obtain the following epidemiological insights: (1) the essential epidemic size is less likely to be affected by the rate of identification of the actual infective population; (2) the intervention has a positive effect on the delay of the epidemic peak; (3) intervention over a relatively long period is needed to effectively reduce the final epidemic size.
Keywords: COVID-19; SEIR compartmental model; basic reproduction number.
Conflict of interest statement
The author declares no conflict of interest.
Figures
References
-
- Centers for Disease Control and Prevention Coronavirus Disease 2019 (COVID-19) [(accessed on 23 February 2020)]; Available online: https://www.cdc.gov/coronavirus/2019-ncov/index.html.
-
- World Health Organization Coronavirus Disease 2019 (COVID-19) Situation Reports. [(accessed on 5 March 2020)]; Available online: https://www.who.int/emergencies/diseases/novel-coronavirus-2019/situatio...
-
- NHK World Japan Japan Sets up Emergency Measures for Coronavirus. [(accessed on 17 February 2020)]; Available online: https://www3.nhk.or.jp/nhkworld/en/news/20200213_07/
-
- Inaba H. Age-Structured Populatin Dynamics in Demography and Epidemiology. Springer; Berlin/Heidelberg, Germany: 2017.
Grants and funding
LinkOut - more resources
Full Text Sources
