. 2020 Mar 14;12(3):685.
doi: 10.3390/cancers12030685.

Vitamin C Restricts the Emergence of Acquired Resistance to EGFR-Targeted Therapies in Colorectal Cancer

Affiliations

Vitamin C Restricts the Emergence of Acquired Resistance to EGFR-Targeted Therapies in Colorectal Cancer

Annalisa Lorenzato et al. Cancers (Basel). .

Abstract

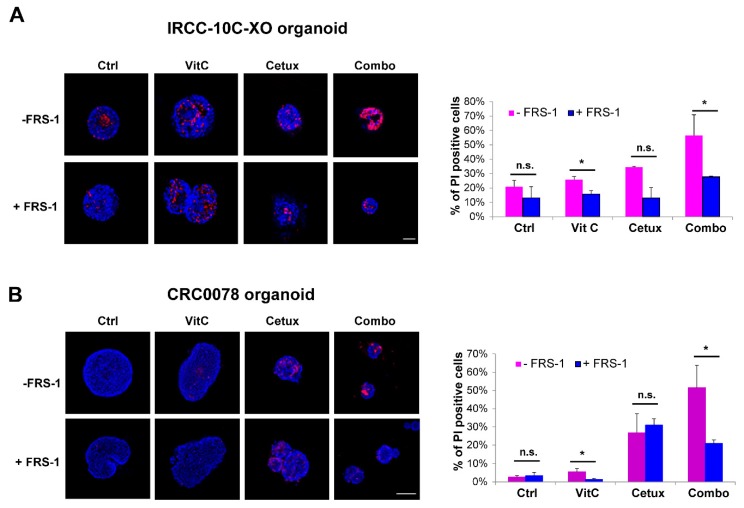
The long-term efficacy of the Epidermal Growth Factor Receptor (EGFR)-targeted antibody cetuximab in advanced colorectal cancer (CRC) patients is limited by the emergence of drug-resistant (persister) cells. Recent studies in other cancer types have shown that cells surviving initial treatment with targeted agents are often vulnerable to alterations in cell metabolism including oxidative stress. Vitamin C (VitC) is an antioxidant agent which can paradoxically trigger oxidative stress at pharmacological dose. Here we tested the hypothesis that VitC in combination with cetuximab could restrain the emergence of secondary resistance to EGFR blockade in CRC RAS/BRAF wild-type models. We found that addition of VitC to cetuximab impairs the emergence of drug persisters, limits the growth of CRC organoids, and significantly delays acquired resistance in CRC patient-derived xenografts. Mechanistically, proteomic and metabolic flux analysis shows that cetuximab blunts carbohydrate metabolism by blocking glucose uptake and glycolysis, beyond promoting slow but progressive ROS production. In parallel, VitC disrupts iron homeostasis and further increases ROS levels ultimately leading to ferroptosis. Combination of VitC and cetuximab orchestrates a synthetic lethal metabolic cell death program triggered by ATP depletion and oxidative stress, which effectively limits the emergence of acquired resistance to anti-EGFR antibodies. Considering that high-dose VitC is known to be safe in cancer patients, our findings might have clinical impact on CRC patients treated with anti-EGFR therapies.

Keywords: ROS; Vitamin C; cetuximab; colorectal cancer; drug resistance; ferroptosis; glucose metabolism; oxidative stress.


Conflict of interest statement

S. S. is an advisory board member for Amgen, Bayer, BMS, CheckmAb, Celgene, Daiichi-Sankyo, Incyte, Merck, Novartis, Roche, and Seattle Genetics; all the other authors declare no potential conflicts of interest.

Figures

Figure 1
Figure 1
Effects of Vitamin C (VitC) treatment on cetuximab-persister colorectal cancer (CRC) cells. (A) DiFi cells were seeded (25,000 cells/well) in 24-well plates for a long-term proliferation assay under treatment with VitC (1 mM), cetuximab (50 μg/mL), or their combination. When cells seeded in the control wells reached confluence, all wells were fixed with paraformaldehyde and stained with crystal violet. Representative images from one of three independent experiments are shown. See also Figure S1 for results in CCK81 CRC cells. (B) Generation of DiFi cetuximab-persister cells (red square) by treating for 2 weeks with cetuximab (100 μg/mL), 5 million DiFi cells were seeded in 10 cm plastic plates (left part) and tested for sensitivity to cetuximab and VitC after 2 weeks of cetuximab treatment (right part). DiFi parental cells treated with control media were used as a control (blue square). (C) Cetuximab-persister cells were further challenged with the indicated treatment (Cetux: 100 μg/mL; VitC: 2 mM) for two more weeks and then fixed and stained with crystal violet for colony assessment. Representative images are shown from one of three independent experiments. (D) Colony area was calculated by the ImageJ software and numbers were normalized on control media (release) treatment. Error bars represent SD. Ctrl, control; Cetux, cetuximab; VitC, Vitamin C; Combo, combination of VitC and cetuximab; release, control media. Statistical significance: *p < 0.05; **p < 0.01; (two-tailed unpaired Student’s t test).
Figure 2
Figure 2
Combinatorial treatment hijacks the emergence of acquired resistance in preclinical CRC models in vitro. (A,B) Top part: Time-To-Progression assay performed in (A) DiFi and (B) CCK81 CRC cell lines. The effect of the indicated treatments on cell proliferation was assessed over time by cell counting. Nonlinear fit with exponential growth curve (Graphpad Prism) was applied to data points to show growth kinetics. Biological duplicates are shown for treatments on DiFi cells. Bottom part: bright-field microscopy images of DiFi and CCK81 cell lines treated with VitC alone and in combination with cetuximab were taken at the end of the experiment. (C) RAS/BRAF wild-type (wt) cetuximab-sensitive organoids (IRCC-10C-XO) were treated with VitC, cetuximab, and combinatorial treatment. At the end of the treatment schedule, organoids were stained with DAPI (blue) and phalloidin (Phall, green) in order to assess their 3D cellular structure. Representative images of organoids are shown for each condition (n = 3). Scale bar 100 μm (10 μm, 63×). (D) RAS/BRAF wt cetuximab-sensitive organoids obtained from a second independent patient (CRC0078) were treated with VitC, cetuximab, and combinatorial treatment and then stained with DAPI (blue) and phalloidin (Phall, green) in order to assess their 3D cellular structure. Representative images of organoids are shown for each condition (n = 3). Scale bar 50 μm (25 μm, 63×). Abbreviations and drug concentrations: Ctrl: control; VitC: Vitamin C (1 mM); Cetux: cetuximab (50 µg/mL); Combo: combination of VitC and cetuximab.
Figure 3
Figure 3
Combinatorial treatment delays the emergence of acquired resistance in cetuximab-sensitive patient-derived xenografts. (A) Left panel: a cetuximab-sensitive CRC PDX (CRC0078) was expanded to create four cohorts. When tumors reached around 300 mm3 in volume mice were randomized (black arrow) and treated with vehicle, VitC (4 g/kg, intraperitoneal injection), cetuximab (10 mg/kg, intraperitoneal injection), or their combination (Combo 1, red curve). A delayed combinatorial treatment called “Combo 2” (blue arrow) was initiated after 13 weeks of cetuximab treatment to intercept tumors in a drug-tolerant condition. Right panel: scatter plot showing comparison and statistical significance between mice treated with cetuximab, Combo 1, and Combo 2. (B) A second cetuximab-sensitive CRC PDX model (CRC0121) was expanded to create four cohorts. When tumors reached around 500 mm3 in volume mice were randomized (black arrow) and treated with vehicle, VitC (4 g/kg, intraperitoneal injection), cetuximab (10 mg/kg, intraperitoneal injection). A delayed combinatorial treatment (blue arrow, Combo 2) was initiated after 4 weeks of cetuximab treatment to intercept tumors in a drug-tolerant condition. Right panel: scatter plot showing comparison and statistical significance between mice treated with cetuximab and Combo 2. Error bars represent SEM. Statistical significance: n.s., not significant; *p < 0.05; **p < 0.01; (two-tailed unpaired Student’s t-test).
Figure 4
Figure 4
Proteomic and metabolic analysis of CRC cells treated with VitC or cetuximab as single agents or in combination. (A) Hierarchical clustering (HCL) of the proteins differentially expressed (ANOVA p-value < 0.05) in two independent batches of DiFi cells (RS and XM) treated for 4 and 24 h with VitC (1mM), cetuximab (50 μg/mL), or the combination. The heat map shows fold change in protein abundance compared with untreated cells. Blue arrows indicate SLC2A1 (GLUT1, Glucose-Transporter 1) and HK2 (Hexokinase2) proteins; green arrow indicates EGFR; orange and pink arrows indicate FT (Ferritin) and TFRC (Transferrin Receptor), respectively. (B) DiFi cells were treated for 4 and 24 h with the indicated drugs and glucose uptake was measured. One representative of three independent experiment performed each with technical triplicates is shown; error bars represent ± SD. (C) DiFi cells were treated for 24 h with VitC (1 mM), cetuximab (50 µg/mL), or their combination and Seahorse XF96 Extracellular Flux Analyzer was used to measure ExtraCellular Acidification Rate (ECAR) and (D) ECAR followed by a Cell MITO Stress Test. Continuous values normalized to micrograms of proteins are shown. Results are reported as mean ± SD of one representative of three independent experiments performed with at least three technical replicates each. (E) ATP production was measured by Seahorse XF Real-Time ATP rate assays after 24 h of treatment with the indicated drugs and source of ATP (glycolysis or oxidative phosphorylation) is shown as percentage of total ATP. R/A: Rotenone/Antimycin.
Figure 5
Figure 5
VitC-mediated ROS production triggers ferroptosis in CRC cells. (A) DiFi cells were treated as indicated for 4 h and ROS levels were measured; N-acetyl cysteine (NAC, 10 mM) was used as a control to rescue ROS production in drug treated cells. See also Figure S8 for results in C75 and CCK81 CRC cells. (B) DiFi were treated as indicated and ROS levels were measured after 24, 48, and 72 h. Results in (A) and (B) are representative of at least three independent experiments; results are normalized to relative controls and error bars represent SD. (C) Cells were treated as indicated and total protein lysates were analyzed for ferritin (FT) expression. Actin was used as a loading control. Right panel: Western blot quantification analysis was performed by the ImageJ software. (D) Cells were treated for 3 h with VitC, cetuximab, or the combination and labile iron pool (LIP) levels were measured by a calcein-AM method. LIP levels are inversely correlated with calcein fluorescence, indicating in this experiment that LIP levels are increased in cells treated with VitC or combo. Deferoxamine (DFO) (200 μM) rescues the increase in LIP at levels comparable to those of the control. (E) DiFi cells (12,000 cells/well) were plated in 96-well white walled plate and incubated overnight for their attachment to the plate surface. Cells were then treated for 24 h with VitC (1 mM), cetuximab (50 µg/mL), or their combination. The GSH/GSSG levels were assessed through GSH/GSSG-Glo™ Assay (Promega™) following manufacturer protocol. Data were normalized with respect to total GSH/GSSG in untreated cells. Statistical significance for each treatment was calculated with respect to GSH or total GSH/GSSG in untreated cells. Bars are the average of three independent experiments. Error bars represent SD. Statistical significance: n.s., not significant; *p < 0.05; **p < 0.01; ***p < 0.001 (two-tailed unpaired Student’s t-test).
Figure 6
Figure 6
Combinatorial treatment increases lipid membrane damage, which is rescued by ferrostatin (FRS-1) treatment. (A,B) IRCC-10C-XO (A) and CRC0078 (B) organoids were treated with VitC, cetuximab, and combinatorial treatment for 2 weeks and then stained with HOECHST (blue) and PI (red) to assess the levels of membrane damage and cell death. FRS-1 (2 μM) was used to rescue the effects dependent on lipid peroxide toxicity. Representative images of organoids are shown for each condition (n = 3). Scale bar: 50 μM (IRCC-10C-XO) and 100 μM (CRC0078). Quantification with ImageJ software is shown in the right panel. Treatments: Ctrl, control media; VitC, 1 mM; Cetux, 50 μg/mL; Combo, VitC 1 mM plus Cetux 50 μg/mL. Error bars represent SD. Statistical significance: n.s., not significant; *p < 0.05; (two-tailed unpaired Student’s t-test).
Figure 7
Figure 7
Proposed mechanism for increased ROS production in combo-treated cells. Iron enters in the cell and in part generates the labile iron pool (LIP), while a part is stored in the ferritin complex (FT). Cetuximab binds to EGFR and promotes the EGFR pathway and metabolic downregulation; VitC enters in CRC cells and triggers, by interacting with LIP, ROS formation, which in turn can chemically reduce FT and promote iron release. The latter will react with VitC, which is continuously provided to cells and will foster increased ROS production with consequent membrane damage and cell death.

Similar articles

Cited by

References

    1. Jonker D.J., O’Callaghan C.J., Karapetis C.S., Zalcberg J.R., Tu D., Au H.J., Berry S.R., Krahn M., Price T., Simes R.J., et al. Cetuximab for the treatment of colorectal cancer. N. Engl. J. Med. 2007;357:2040–2048. doi: 10.1056/NEJMoa071834. - DOI - PubMed
    1. Diaz L.A., Williams R.T., Wu J., Kinde I., Hecht J.R., Berlin J., Allen B., Bozic I., Reiter J.G., Nowak M.A., et al. The molecular evolution of acquired resistance to targeted EGFR blockade in colorectal cancers. Nature. 2012;486:537–540. doi: 10.1038/nature11219. - DOI - PMC - PubMed
    1. Misale S., Di Nicolantonio F., Sartore-Bianchi A., Siena S., Bardelli A. Resistance to anti-EGFR therapy in colorectal cancer: From heterogeneity to convergent evolution. Cancer Discov. 2014;4:1269–1280. doi: 10.1158/2159-8290.CD-14-0462. - DOI - PubMed
    1. Misale S., Bozic I., Tong J., Peraza-Penton A., Lallo A., Baldi F., Lin K.H., Truini M., Trusolino L., Bertotti A., et al. Vertical suppression of the EGFR pathway prevents onset of resistance in colorectal cancers. Nat. Commun. 2015;6:8305. doi: 10.1038/ncomms9305. - DOI - PMC - PubMed
    1. Corcoran R.B., André T., Atreya C.E., Schellens J.H.M., Yoshino T., Bendell J.C., Hollebecque A., McRee A.J., Siena S., Middleton G., et al. Combined BRAF, EGFR, and MEK inhibition in patients with BRAFV600E-mutant colorectal cancer. Cancer Discov. 2018;8:428–443. doi: 10.1158/2159-8290.CD-17-1226. - DOI - PMC - PubMed