. 2020 Mar 14;12(3):690.
doi: 10.3390/cancers12030690.

Comparative Molecular Analysis of Cancer Behavior Cultured In Vitro, In Vivo, and Ex Vivo

Affiliations

Comparative Molecular Analysis of Cancer Behavior Cultured In Vitro, In Vivo, and Ex Vivo

Nicholas R Hum et al. Cancers (Basel). .

Abstract

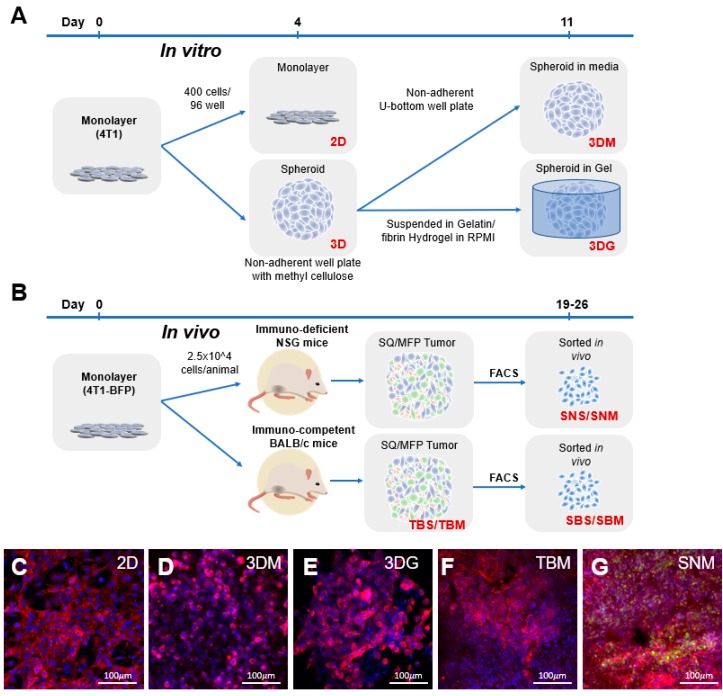
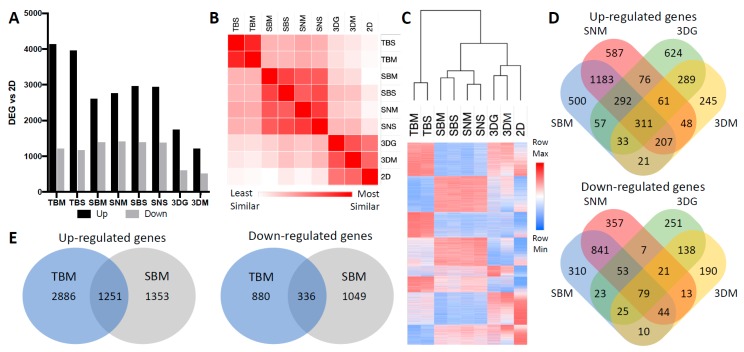
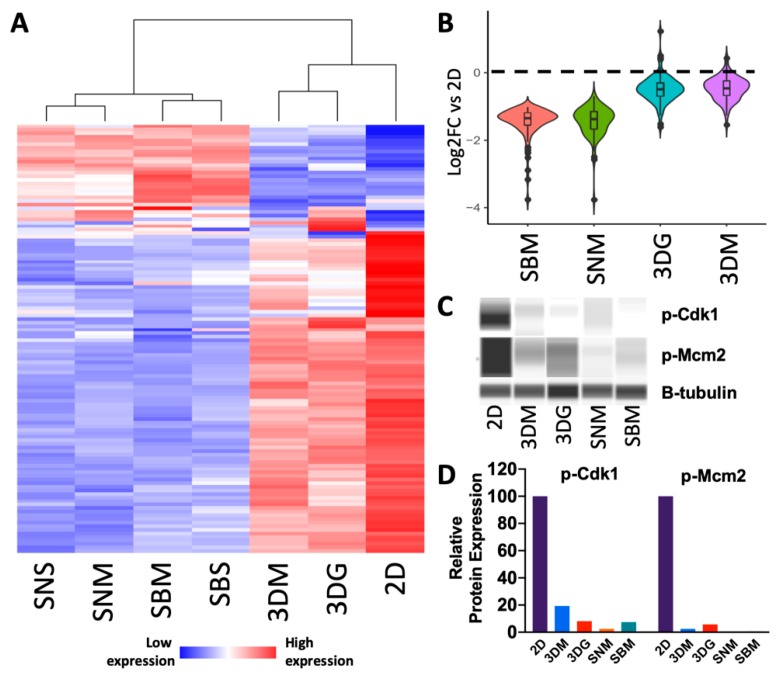
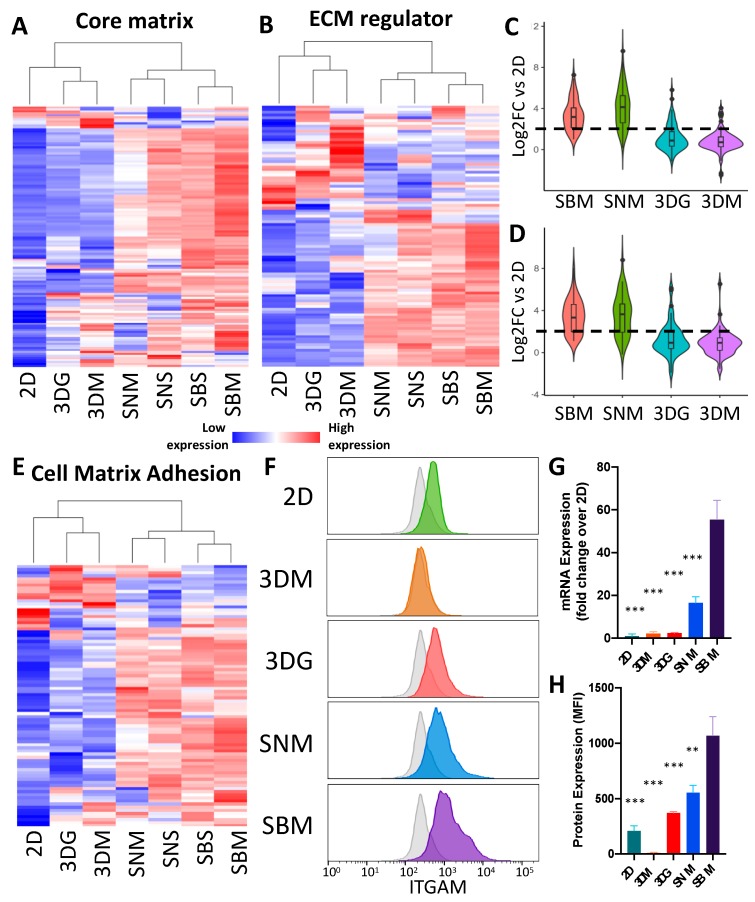
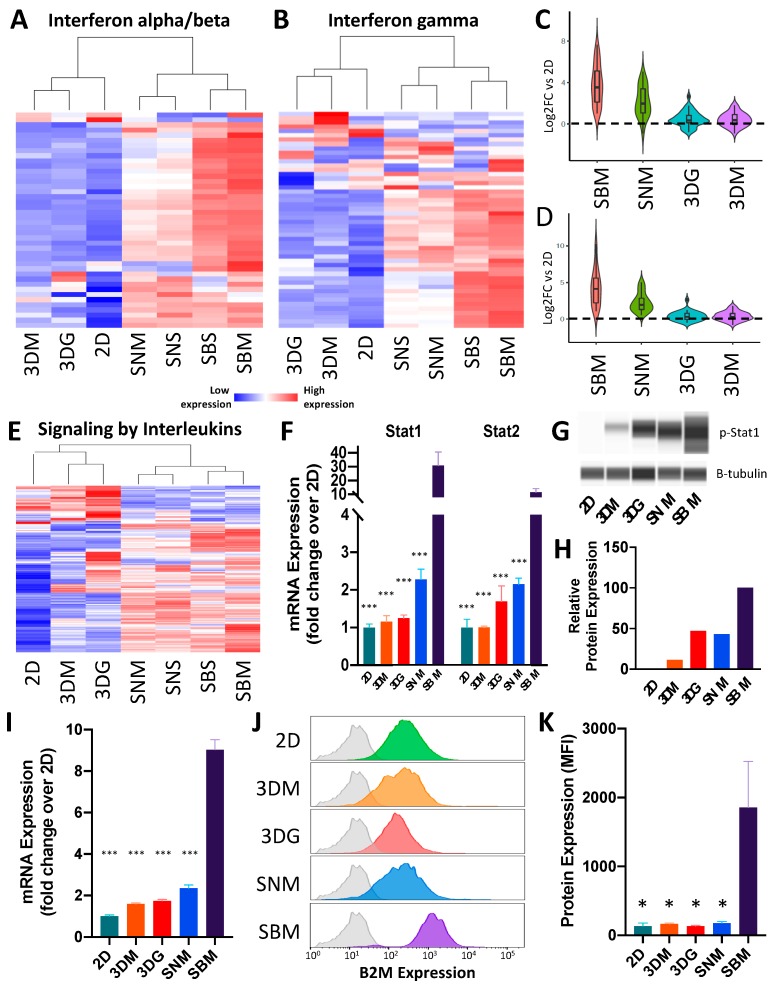
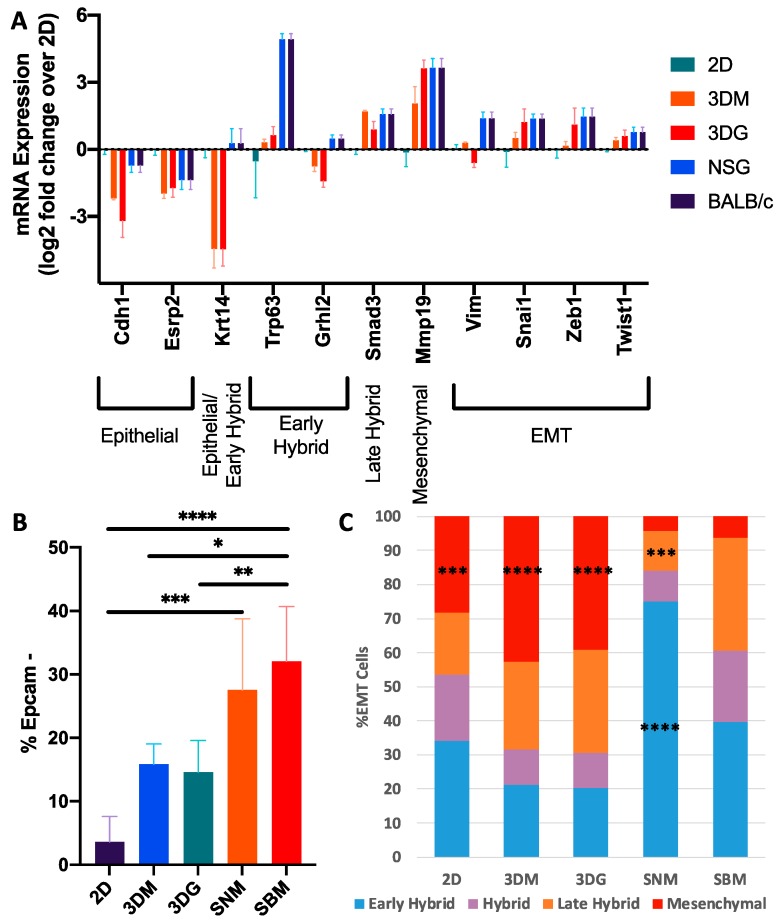
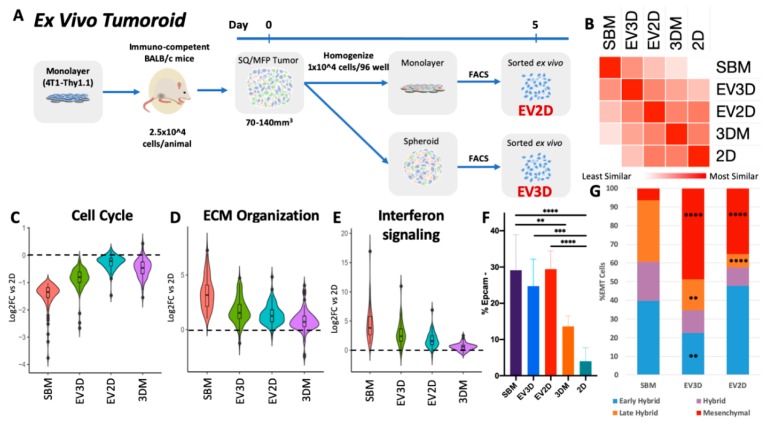
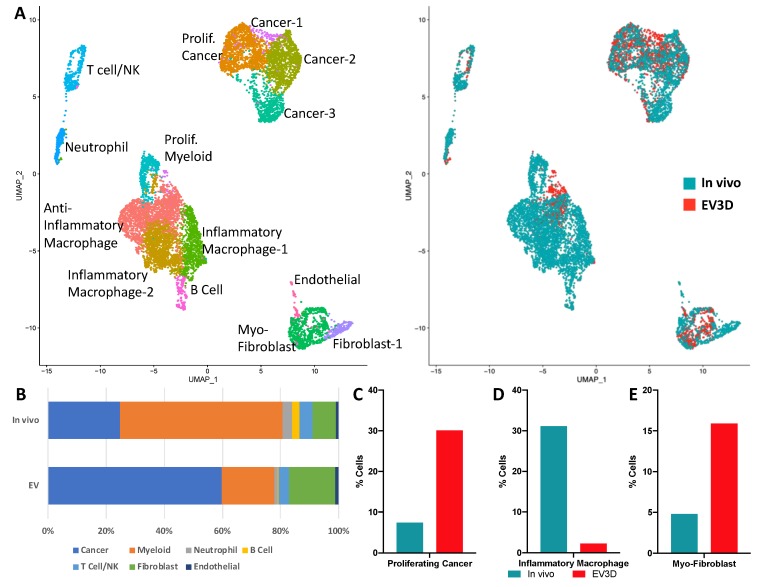
Current pre-clinical models of cancer fail to recapitulate the cancer cell behavior in primary tumors primarily because of the lack of a deeper understanding of the effects that the microenvironment has on cancer cell phenotype. Transcriptomic profiling of 4T1 murine mammary carcinoma cells from 2D and 3D cultures, subcutaneous or orthotopic allografts (from immunocompetent or immunodeficient mice), as well as ex vivo tumoroids, revealed differences in molecular signatures including altered expression of genes involved in cell cycle progression, cell signaling and extracellular matrix remodeling. The 3D culture platforms had more in vivo-like transcriptional profiles than 2D cultures. In vivo tumors had more cells undergoing epithelial-to-mesenchymal transition (EMT) while in vitro cultures had cells residing primarily in an epithelial or mesenchymal state. Ex vivo tumoroids incorporated aspects of in vivo and in vitro culturing, retaining higher abundance of cells undergoing EMT while shifting cancer cell fate towards a more mesenchymal state. Cellular heterogeneity surveyed by scRNA-seq revealed that ex vivo tumoroids, while rapidly expanding cancer and fibroblast populations, lose a significant proportion of immune components. This study emphasizes the need to improve in vitro culture systems and preserve syngeneic-like tumor composition by maintaining similar EMT heterogeneity as well as inclusion of stromal subpopulations.

Keywords: 4T1; EMT; PDX; RNA-seq; TNBC; monolayer culture; single-cell RNA-seq; spheroid; syngeneic culture; tumoroid.


Conflict of interest statement

The authors declare no conflict of interest. The funders had no role in the design of the study; in the collection, analyses, or interpretation of data; in the writing of the manuscript, or in the decision to publish the results.

Figures

Figure 1
Figure 1
Experimental overview. (A) The 4T1 in vitro samples originated from low passage number, subconfluent, monolayer cultured cells seeded at 400 cells/well in 96 wells into tissue culture-treated flat-bottom plates or non-adherent U-bottom plates. Following 4 days of culture, monolayer (C) RNA was collected, and spheroids continued to be cultured in wells containing media (D) or cast into a gelatin/fibrin hydrogel (E) for an additional 7 days prior to RNA isolation. (B) In vivo tumor samples were generated by injection of subconfluent, monolayer 4T1-BFP cultures into mammary fat pad (MFP) or subcutaneously into (SQ) back flank locations in immunodeficient (NSG) or BALB/c mice. Tumors were isolated following a 19–26-day growth period yielding tumors ranging from 70 to 140 mm3. RNA samples were processed from bulk (F) or BFP+ cancer cell populations isolated by fluorescently activated cell sorting (FACS) (G). Blue: nuclear DAPI staining; red: phalloidin staining actin filaments; green: BFP expression.
Figure 2
Figure 2
Transcriptomic variability of cancer cells under different culturing conditions. (A) Quantity of differentially expressed genes (DEGs) compared to 2D samples. DEGs were defined as greater than 2-fold change and FDR < 0.05 (n ≥ 4). Cultured condition abbreviations: TBM: whole Tumor from BALB/c Mammary fat pad; TBS: whole Tumor from BALB/c Subcutaneous back flank; SBM: Sorted BALB/c Mammary fat pad; SBS: Sorted BALB/c Subcutaneous; SNM: Sorted NSG Mammary fat pad; SNS: Sorted NSG Subcutaneous; 3DG: 3D spheroids in hydroGel; 3DM: 3D spheroids in Media; 2D: 2D monolayer. (B) Similarity matrix based on whole transcriptome similarity of average expression values within each condition. Similarity differences calculated using Euclidean distance. (C) Heat map and dendrogram of whole transcriptome based on normalized logarithmic average expression values within each condition and hierarchal clustering of samples based on Euclidean distance. (D) Venn diagrams representing overlapping up- and down-regulated DEGs from 4T1 cultured from immunocompetent tumors, immunodeficient tumors, spheroids in gel, and spheroids in media compared to monolayer culture. (E) Venn diagrams representing overlapping up- and down-regulated DEGs from BALB/c MFP whole tumor vs. BALB/c MFP-sorted 4T1 compared to monolayer culture.
Figure 3
Figure 3
Cell cycle progression genes are up-regulated in cells cultured in monolayer culture. (A) Heat map of differentially expressed cell cycle genes (Supplementary Table S4) relative to 2D culture depicting increased down-regulation as culturing complexity increases (n = 4–5). (B) Violin plot depicting magnitude of down-regulation and distribution of SBM vs. 2D up-regulated cell cycle progression genes across other culturing conditions relative to 2D culture. (C) Pseudogel representation of protein levels of phosphorylated cell cycle genes (Cdk1 and Mcm2) from 4T1 cells cultured across multiple conditions. (D) Quantification of protein levels relative to β-tubulin.
Figure 4
Figure 4
Extracellular matrix organization genes are up-regulated in cells cultured in 3D and in vivo conditions. Heat maps of differentially core matrix genes (A) (Supplementary Table S5) and ECM regulator genes (B) (Supplementary Table S6) relative to 2D culture. Expression values represented are an average of 4–5 replicates. Violin plots depicting magnitude of up-regulation and distribution of SBM vs. 2D up-regulated core matrix genes (C) and ECM regulator genes (D) across other culturing conditions relative to 2D culture. Violin plot depicting magnitude of up-regulation and distribution of SBM vs. 2D up-regulated core matrix genes across other culturing conditions relative to 2D culture. (E) Heat map of differentially expressed cell matrix adhesion genes (Supplementary Table S7) relative to 2D culture (n = 4–5). (F) Histogram of representative Itgam abundance of single cancer cells cultured in different methods. Grey shaded plots represent unstained controls. (G) mRNA expression levels of Itgam in 4T1 cells under differing culturing condition. Expression levels normalized to 2D culture ± SEM. (n = 4–5). (H) Bar graph of flow cytometric analysis of ITGAM protein expression showing up-regulation in 3DG and in vivo conditions. Protein expression values represent background (unstained control) subtracted median fluorescent intensity of cancer cells ± SEM; (n = 4). (** p value < 0.001; *** p value < 0.0001 relative to SBM).
Figure 5
Figure 5
Cell signaling is highly up-regulated under syngeneic culturing conditions. (A) Heat map of differentially expressed interferon alpha/beta signaling genes (Supplementary Table S8) relative to 2D culture (n = 4–5). (B) Heat map of differentially expressed interferon gamma signaling genes (Supplementary Table S9) relative to 2D culture (n = 4–5). (C) Violin plot depicting magnitude of up-regulation and distribution of SBM vs. 2D up-regulated interferon alpha/beta signaling genes across other culturing conditions relative to 2D culture. (D) Violin plot depicting magnitude of up-regulation and distribution of SBM vs. 2D up-regulated interferon gamma signaling genes across other culturing conditions relative to 2D culture. (E) Heat map of differential signaling by interleukin genes (Supplementary Table S10) relative to 2D culture (n = 4–5). (F) mRNA expression levels of Stat1 and Stat2 in 4T1 cells under different culturing conditions. Expression levels normalized to 2D culture ± SEM (n = 4–5). (G) Pseudogel representation of protein levels of phosphorylated Stat1 from 4T1 cells cultured across multiple conditions. (H) Quantification of p-Stat1 protein levels relative to β-tubulin. (I) mRNA expression levels of B2M in 4T1 cells under differing culturing conditions. Expression levels normalized to 2D culture ± SEM; n = 4–5. (J) Histogram of representative Beta-2-microglobulin (B2M) abundance of single cancer cells cultured in different methods. Grey shaded plots represent unstained controls. (K) Bar graph of flow cytometric analysis of B2M protein expression showing up-regulation in BALB/c MFP. Protein expression values represent background (unstained control) subtracted median fluorescent intensity of cancer cells ± SEM (n = 4). (* p value < 0.05; *** p value < 0.0001 relative to SBM).
Figure 6
Figure 6
The 4T1 cells in vivo reside in multiple transitional epithelial-to-mesenchymal transition (EMT) states. (A) The 4T1 log2 expression of EMT-related genes under different culturing methods relative to 2D culture. Error bars ± SEM. (B) Proportion of cells lacking Epcam expression based on flow cytometric analysis (n = 4–7). Error bars ± SD. (C) Distribution of EMT cells across hybrid EMT states induced by the culturing method (n = 4–7). * p < 0.05, ** p < 0.0005, *** p < 0.0005, and **** p < 0.0001 relative to SBM.
Figure 7
Figure 7
Ex vivo tumoroid culture encourages in vivo-like cancer cell behavior. (A) Ex vivo tumoroid culture experimental design. (B) Similarity matrix of 4T1 transcriptomic profiles across in vivo, ex vivo, and in vitro conditions. (C) Violin plot of magnitude of differential expression of cell cycle DEGs of SBM vs. 2D across culturing conditions. (D) Violin plot of magnitude of differential expression of ECM organization DEGs of SBM vs. 2D across culturing conditions. (E) Violin plot of magnitude of differential expression of interferon signaling DEGs of SBM vs. 2D across culturing conditions. (F) Flow cytometric analysis of 4T1 cells undergoing EMT following 5 days of ex vivo culturing. (G) Abundance of hybrid EMT states following ex vivo culturing. Tumoroid conditions n = 6 from three independent tumors. * p < 0.05, ** p < 0.0005, *** p < 0.0005, and **** p < 0.0001 relative to SBM.
Figure 8
Figure 8
Single-cell RNA-seq analysis of 4T1 tumor and tumoroid cultures. (A) Merged uniform manifold approximation and projection (UMAP) of identified cells from a syngeneic tumor (in vivo) and 5-day ex vivo tumoroid (EV3D) cultures. (B) Cell type abundance from original tumor and tumoroids. (C) Abundance of proliferating cancer cells (Epcam+/Mki67+) in tumor/tumoroid. (D) Abundance of inflammatory macrophages (Ptprc+/CD14+/Il1b+) in tumor/tumoroid. (E) Abundance of myofibroblast (Thy1+/Dcn+/Acta2) in tumor/tumoroid.

References

    1. WHO Global Health Reports 2013. [(accessed on 15 January 2020)]; Available online: https://www.who.int/gho/publications/world_health_statistics/EN_WHS2013_....
    1. Siegel R.L., Miller K.D., Jemal A. Cancer statistics, 2018. CA Cancer J. Clin. 2018;68:7–30. doi: 10.3322/caac.21442. - DOI - PubMed
    1. Pampaloni F., Reynaud E.G., Stelzer E.H.K. The third dimension bridges the gap between cell culture and live tissue. Nat. Rev. Mol. Cell Biol. 2007;8:839–845. doi: 10.1038/nrm2236. - DOI - PubMed
    1. Cagan R., Meyer P. Rethinking cancer: Current challenges and opportunities in cancer research. Dis. Model Mech. 2017;10:349–352. doi: 10.1242/dmm.030007. - DOI - PMC - PubMed
    1. Day C.-P., Merlino G., Van Dyke T. Preclinical mouse cancer models: A maze of opportunities and challenges. Cell. 2015;163:39–53. doi: 10.1016/j.cell.2015.08.068. - DOI - PMC - PubMed

Grants and funding